HAL Id: hal-02400819
https://hal.archives-ouvertes.fr/hal-02400819
Submitted on 9 Dec 2019
HAL is a multi-disciplinary open access
archive for the deposit and dissemination of
sci-entific research documents, whether they are
pub-lished or not. The documents may come from
teaching and research institutions in France or
abroad, or from public or private research centers.
L’archive ouverte pluridisciplinaire HAL, est
destinée au dépôt et à la diffusion de documents
scientifiques de niveau recherche, publiés ou non,
émanant des établissements d’enseignement et de
recherche français ou étrangers, des laboratoires
publics ou privés.
The dwarf galaxy satellite system of Centaurus A
Oliver Müller, Marina Rejkuba, Marcel Pawlowski, Rodrigo Ibata, Federico
Lelli, Michael Hilker, Helmut Jerjen
To cite this version:
Oliver Müller, Marina Rejkuba, Marcel Pawlowski, Rodrigo Ibata, Federico Lelli, et al.. The dwarf
galaxy satellite system of Centaurus A. Astronomy and Astrophysics - A&A, EDP Sciences, 2019,
629, pp.A18. �10.1051/0004-6361/201935807�. �hal-02400819�
July 23, 2019
The dwarf galaxy satellite system of Centaurus A
?
Oliver Müller
1, Marina Rejkuba
2, Marcel S. Pawlowski
3, Rodrigo Ibata
1, Federico Lelli
2, Michael Hilker
2, and Helmut
Jerjen
41 Observatoire Astronomique de Strasbourg (ObAS), Universite de Strasbourg - CNRS, UMR 7550 Strasbourg, France
e-mail: [email protected]
2 European Southern Observatory, Karl-Schwarzschild Strasse 2, 85748, Garching, Germany 3 Leibniz-Institut fur Astrophysik Potsdam (AIP), An der Sternwarte 16, D-14482 Potsdam, Germany
4 Research School of Astronomy and Astrophysics, Australian National University, Canberra, ACT 2611, Australia
Received tba; accepted tba
ABSTRACT
Dwarf galaxy satellite systems are essential probes to test models of structure formation, making it necessary to establish a census of dwarf galaxies outside of our own Local Group. We present deep FORS2 V I band images from the ESO Very Large Telescope (VLT) for 15 dwarf galaxy candidates in the Centaurus group of galaxies. We confirm nine dwarfs to be members of Cen A by measuring their distances using a Bayesian approach to determine the tip of the red giant branch luminosity. We have also fit theoretical isochrones to measure their mean metallicities. The properties of the new dwarfs are similar to those in the Local Group in terms of their sizes, luminosities, and mean metallicities. Within our photometric precision, there is no evidence of a metallicity spread, but we do observe possible extended star formation in several galaxies, as evidenced by a population of asymptotic giant branch stars brighter than the red giant branch tip. The new dwarfs do not show any signs of tidal disruption. Together with the recently reported dwarf galaxies by the complementary PISCeS survey, we study the luminosity function and 3D structure of the group. By comparing the observed luminosity function to the high-resolution cosmological simulation IllustrisTNG, we find agreement within a 90% confidence interval. However, Cen A seems to be missing its brightest satellites and has an overabundance of the faintest dwarfs in comparison to its simulated analogs. In terms of the overall 3D distribution of the observed satellites, we find that the whole structure is flattened along the line-of-sight, with a root-mean-square (rms) height of 130 kpc and an rms semi-major axis length of 330 kpc. Future distance measurements of the remaining dwarf galaxy candidates are needed to complete the census of dwarf galaxies in the Centaurus group. 1. Introduction
The hunt for dwarf galaxies in the Local Volume (LV, D < 11 Mpc, Kraan-Korteweg & Tammann 1979; Karachentsev et al. 2004, 2013) has become widely popular, with several indepen-dent teams searching for nearby dwarf galaxies (Chiboucas et al. 2009; Merritt et al. 2014; Müller et al. 2015, 2017a,b, 2018a; Carlin et al. 2016; Crnojevi´c et al. 2016; Javanmardi et al. 2016; Park et al. 2017; Blauensteiner et al. 2017; Smercina et al. 2018). The increased pace of new discoveries reflects the improvements in survey capabilities, but also the growing interest in dwarf galaxies as direct probes of cosmological models on small scales (e.g., Bullock & Boylan-Kolchin 2017). Key motivators are the long-standing missing satellite problem (Moore et al. 1999), the too-big-to-fail problem (Kroupa et al. 2010; Boylan-Kolchin et al. 2011), the cusp-core problem (de Blok 2010), the trinity of cosmological problems (which could be solved with baryonic physics), and lately the plane-of-satellites problem (e.g., Kroupa et al. 2005; Koch & Grebel 2006; Pawlowski & Kroupa 2013; Ibata et al. 2013, 2014; Bílek et al. 2018; Banik et al. 2018; Ham-mer et al. 2018, see Pawlowski 2018 for a recent review). The latter phenomenon is a more fundamental problem mostly unaf-fected by the baryonic processes within the galaxies (Pawlowski et al. 2015).
? Based on observations collected at the European Organisation
for Astronomical Research in the Southern Hemisphere under ESO program 0101.A-0193(A). The photometric catalogs are available in electronic form at the CDS via anonymous ftp to cdsarc.u-strasbg.fr (130.79.128.5) or via http://cdsweb.u-strasbg.fr/cgi-bin/qcat?J/A+A/.
All these studies are mainly based on the dwarf galaxy sys-tem in the Local Group. Therefore, it remains a crucial task to test whether these problems persist in other galaxy groups. One of the closest galaxy groups in reach for such studies is the Centaurus group. It consists of two main concentrations around the dominant early-type galaxy Cen A at D ' 3.8 Mpc (Re-jkuba 2004) and the secondary late-type galaxy M 83 at D ' 4.8 Mpc (Herrmann et al. 2008). Another, less massive galaxy (NGC 4945), with roughly 1/3 of the total luminosity of Cen A, is located at the outskirt of Cen A’s virial radius of rvir= 409 kpc
(Tully 2015, using a Hubble constant of 71 km s−1 Mpc−1,
Ko-matsu et al. 2011). The Centaurus group resides at the border of the Local Void and is well isolated (see e.g., Fig. 7 in Anand et al. 2018). Its isolation makes it a well suited target for studies of the dwarf galaxy population since the contamination of background galaxies is low. However, due to the group’s low Galactic lati-tude, Galactic cirrus becomes a major problem as its small-scale morphology can visually mimic low surface brightness dwarf galaxies. Therefore, it is expected that some dwarf galaxy candi-dates are in fact patches of Galactic cirrus. Only deeper follow-up observations can test the true membership within the galaxy group.
The Centaurus group has recently been targeted by three dif-ferent surveys with the aim of discovering faint dwarf galaxies. The Magellan and Megacam-based PISCeS survey (Crnojevi´c et al. 2014, 2016) screened an area of 50 square degrees around Cen A, exploiting the advantage of the 6.5m Magellan Clay tele-scope and long integration times. This enabled them to resolve individual bright red giant stars in the Cen A halo and its dwarf galaxy satellites. Our own survey (Müller et al. 2015, 2017a),
conducted with the Dark Energy Camera (DECam), covered a much larger area of 550 square degrees in gr bands, including most of the Centaurus association. The SCABS survey (Taylor et al. 2016, 2017, 2018) covers an area of 21 square degrees around Cen A, employing five band imaging (ugriz) also with the DECam. In total, these surveys have more than doubled the cur-rently known dwarf galaxy population around Cen A, assuming that the dwarf galaxy candidates are confirmed with follow-up measurements. Their surface brightnesses and estimated abso-lute magnitudes are in the range of the classical dwarfs, allowing us to perform similar cosmological tests as in the Local Group.
In the Centaurus group there is some evidence for planar structures (Tully et al. 2015; Libeskind et al. 2015; Müller et al. 2016, 2018c), which is similar to the Local Group. Tully et al. (2015) suggested the existence of two, almost parallel planes of satellites, but the subsequent discovery of new dwarf galaxies in the group (Crnojevi´c et al. 2014, 2016; Müller et al. 2017a) weakened the case of a strict separation between the two planes (Müller et al. 2016). Furthermore, Müller et al. (2018b) studied the kinematics of the dwarf galaxies around Cen A and found a phase-space correlation of the satellites, with 14 out of 16 satel-lites seemingly co-rotating around their host. A comparison to ΛCDM simulations finds a similar degree of conflict as earlier studies for the satellite systems in the Local Group (e.g., Ibata et al. 2014).
For many dwarf galaxies around Cen A, no velocity and dis-tance measurements are available to date. Their memberships are mainly based on morphological arguments from integrated-light observations (Müller et al. 2015, 2017a; Taylor et al. 2018). Deep follow-up observations are needed to derive distances with a five percent accuracy, which enables us to study the 3D struc-ture of this galaxy group (e.g., Makarov et al. 2012; Chiboucas et al. 2013; Carrillo et al. 2017; Danieli et al. 2017; Müller et al. 2018c; Cohen et al. 2018; Crnojevi´c et al. 2019). In this paper, we present follow-up observations for 15 dwarf galaxy candi-dates in the region of Cen A using the ESO Very Large Telescope (VLT).
This paper is structured as follows. In Section 2, we present the observations, the data reduction, and photometry; in Section 3, we use the photometric catalog to produce color-magnitude di-agrams and measure the distances of the dwarf galaxies; in Sec-tion 4, we characterize the newly confirmed dwarf galaxies; in Section 5, we discuss the luminosity function of Cen A; in Sec-tion 6, we study the spatial distribuSec-tion of the satellite system; and finally in Section 7, we give a summary and conclusion. 2. Observations and data reduction
Our targets were 12 out of the 57 dwarf galaxy candidates found by our team in the Cen A subgroup (Müller et al. 2017a) and three previously known dwarf galaxy candidates taken from the LV catalog (Karachentsev et al. 2004, 2013). They were selected based on our study of the planes around Cen A (see Table 2 of Müller et al. 2016) since the members could most likely simul-taneously contribute to confirm, or dispute, the existence of the two planes.
In total, 26 hours of VLT time in service mode were specif-ically allocated to the program 0101.A-0193(A). We requested excellent observing conditions, that is dark time and seeing bet-ter than 000. 6, which is necessary to resolve the asymptotic giant
branch (AGB) and the upper red giant branch (RGB) stars at a distance of up to ∼ 5.5 Mpc (Müller et al. 2018c). Deep V and
I CCD images were taken between April and May 2018 with
the FOcal Reducer and low dispersion Spectrograph (FORS2)
mounted on the UT1 of the VLT. With a field of view of 60.8×60.8,
the FORS2 camera is equipped with a mosaic of two 2k×4k MIT CCDs. When using the standard resolution (SR) and 2 × 2 bin-ning, this instrument offers a scale of 000. 25 per pixel. Since the
dwarf galaxy candidates are small on the sky, the targets were centered on Chip 1.
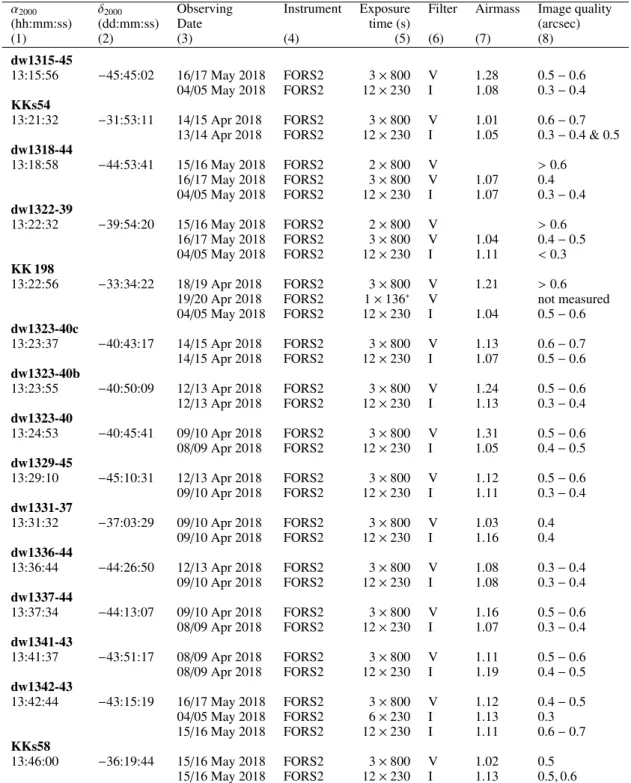
In Table 1, we provide a log of the observations. We re-quested three V-band frames of 800 sec, as well as 12 exposures in I-band of 230 sec for each target. We applied small offsets (<50 pixels) between individual exposures with the aim to im-prove sky subtraction and remove bad pixels. No rotation was ap-plied. During some observations, the conditions suddenly wors-ened. This led to the cancellation and partial repetition of some exposures. In Table 1, we also show the image quality measured on the images. The sky transparency was clear or photomet-ric during all observations, except for I-band data for KKs 54. Mostly, the seeing remained constant over time. We indicate the range of measured image quality if there was a change during the image acquisition.
2.1. Data reduction and calibration
The data reduction was carried out using the python package Astropy (Astropy Collaboration et al. 2013; Price-Whelan et al. 2018), and the Image Reduction and Analysis Facility (IRAF) software (Tody 1993). Within Astropy, a median combined stack of ten bias frames was used to create a master bias. This master bias was subtracted from the individual flat fields. The master flat fields were created by combining ten twilight flats for each filter using a median stack to reject any residual faint stars, bad pixels, and cosmic rays. Then the master flats were normalized by their median values. These final master calibration images, master bias and master flat, were used to process the individual science frames.
Since the initial determination of image transformations with DAOMATCH failed, we decided to resample the individual, sci-entific, and fully calibrated images. To do so, we first generated a combined image using IRAF with the command imcombine utilizing all individual scientific images (using both photometric bands). This combined image contains the full coverage of the sky for the images for one galaxy. All values within this image were then set to zero using the imreplace command to create an empty canvas. Again, using IRAF’s imcombine algorithm, we merged this canvas with each individual scientific image sepa-rately, resulting in a true correspondence between the pixel coor-dinate and the world coorcoor-dinate, and additionally between each image. This gives us our final scientific images that are ready for photometry. We note that the resampling did not change the resolution of the individual images, nor did it change the flux. Cutouts of the final stacked images centered on the dwarf galaxy candidates are shown in Fig 1.
We took the zero points, ZPV and ZPI,and the extinction
co-efficients, kVand kI,from the ESO Quality Control webpages. In
Müller et al. (2018c), we checked and confirmed the consistency between these values and those derived from the standard fields by ourselves. Therefore, we use the former in the following anal-ysis. The photometry was calibrated using the formulae: V = Vinstr+ ZPV − kV· XV− AV+ 2.5 · log10(t),
I = Iinstr+ ZPI− kI· XI− AI+ 2.5 · log10(t),
where the exposure time t is given for a single exposure (800 and 230 seconds for V and I, respectively), XV and XI are the mean
airmasses during the observations, and AVand AI are the
Table 1. Observation summary for 15 dwarf galaxy candidates.
α2000 δ2000 Observing Instrument Exposure Filter Airmass Image quality
(hh:mm:ss) (dd:mm:ss) Date time (s) (arcsec)
(1) (2) (3) (4) (5) (6) (7) (8) dw1315-45 13:15:56 −45:45:02 16/17 May 2018 FORS2 3 × 800 V 1.28 0.5 − 0.6 04/05 May 2018 FORS2 12 × 230 I 1.08 0.3 − 0.4 KKs54 13:21:32 −31:53:11 14/15 Apr 2018 FORS2 3 × 800 V 1.01 0.6 − 0.7
13/14 Apr 2018 FORS2 12 × 230 I 1.05 0.3 − 0.4 & 0.5
dw1318-44 13:18:58 −44:53:41 15/16 May 2018 FORS2 2 × 800 V > 0.6 16/17 May 2018 FORS2 3 × 800 V 1.07 0.4 04/05 May 2018 FORS2 12 × 230 I 1.07 0.3 − 0.4 dw1322-39 13:22:32 −39:54:20 15/16 May 2018 FORS2 2 × 800 V > 0.6 16/17 May 2018 FORS2 3 × 800 V 1.04 0.4 − 0.5 04/05 May 2018 FORS2 12 × 230 I 1.11 < 0.3 KK 198 13:22:56 −33:34:22 18/19 Apr 2018 FORS2 3 × 800 V 1.21 > 0.6
19/20 Apr 2018 FORS2 1 × 136∗ V not measured
04/05 May 2018 FORS2 12 × 230 I 1.04 0.5 − 0.6 dw1323-40c 13:23:37 −40:43:17 14/15 Apr 2018 FORS2 3 × 800 V 1.13 0.6 − 0.7 14/15 Apr 2018 FORS2 12 × 230 I 1.07 0.5 − 0.6 dw1323-40b 13:23:55 −40:50:09 12/13 Apr 2018 FORS2 3 × 800 V 1.24 0.5 − 0.6 12/13 Apr 2018 FORS2 12 × 230 I 1.13 0.3 − 0.4 dw1323-40 13:24:53 −40:45:41 09/10 Apr 2018 FORS2 3 × 800 V 1.31 0.5 − 0.6 08/09 Apr 2018 FORS2 12 × 230 I 1.05 0.4 − 0.5 dw1329-45 13:29:10 −45:10:31 12/13 Apr 2018 FORS2 3 × 800 V 1.12 0.5 − 0.6 09/10 Apr 2018 FORS2 12 × 230 I 1.11 0.3 − 0.4 dw1331-37 13:31:32 −37:03:29 09/10 Apr 2018 FORS2 3 × 800 V 1.03 0.4 09/10 Apr 2018 FORS2 12 × 230 I 1.16 0.4 dw1336-44 13:36:44 −44:26:50 12/13 Apr 2018 FORS2 3 × 800 V 1.08 0.3 − 0.4 09/10 Apr 2018 FORS2 12 × 230 I 1.08 0.3 − 0.4 dw1337-44 13:37:34 −44:13:07 09/10 Apr 2018 FORS2 3 × 800 V 1.16 0.5 − 0.6 08/09 Apr 2018 FORS2 12 × 230 I 1.07 0.3 − 0.4 dw1341-43 13:41:37 −43:51:17 08/09 Apr 2018 FORS2 3 × 800 V 1.11 0.5 − 0.6 08/09 Apr 2018 FORS2 12 × 230 I 1.19 0.4 − 0.5 dw1342-43 13:42:44 −43:15:19 16/17 May 2018 FORS2 3 × 800 V 1.12 0.4 − 0.5 04/05 May 2018 FORS2 6 × 230 I 1.13 0.3 15/16 May 2018 FORS2 12 × 230 I 1.11 0.6 − 0.7 KKs58 13:46:00 −36:19:44 15/16 May 2018 FORS2 3 × 800 V 1.02 0.5 15/16 May 2018 FORS2 12 × 230 I 1.13 0.5, 0.6
Notes. (1) and (2): Coordinates of the dwarf galaxy candidates (epoch J2000); (3) Date of observation; (4): Exposure time; (5) Filter used for the observation; (6) Mean airmass during the observation; and (7): Average image quality. (*): KK198 V-band exposure on 19 and 20 Apr was aborted - here we report it for completeness, but the data was not used.
et al. (1998) and the correction coefficients from Schlafly & Finkbeiner (2011).
For one galaxy – KKs 54 – a problem with the zero point be-came apparent during our analysis because all stars were system-atically shifted toward a blueish color. Indeed, by checking the Atmospheric Site Monitor1data, we saw quite strong variation in sky transparency, indicative of clouds passing during the KKs 54
1 http://www.eso.org/asm/ui/publicLog
I-band imaging observation. Therefore, we had to determine the zero point for this galaxy by calibrating our data with respect to public catalogs. Most photometric surveys like Gaia (Gaia Col-laboration et al. 2016) or Skymapper (Wolf et al. 2018) have no overlap with our targets in I-band: the faintest available stars in these photometric surveys are already saturated in our FORS2 images. Therefore, we used deep ri images of the region around KKs 54 from the DECam archive (proposal ID: 2014A-0306) and calibrated them using APASS (Henden & Munari 2014). In
these DECam images, there are faint stars which also have good quality magnitudes in our FORS2 images. We could then derive the FORS2 offsets by directly matching the instrumental magni-tudes from FORS2 to the calibrated magnimagni-tudes from DECam, adopting the following equation (Lupton 2005):
I= r − 1.2444 · (r − i) − 0.3820
to transform to Peter Stetson’s photometric calibration used by FORS2.
2.2. Photometry
We carried out photometric measurements for all stars on the previously reduced science images using the stand-alone version of DAOPHOT2 (Stetson 1987) package, which is optimized for crowded fields. We followed the same procedure as in Müller et al. (2018c), which includes the detection of point sources, aperture photometry with a small aperture on each such detec-tion, and then point-spread function (PSF) modeling. The first approximation of the PSF model is done using 50 isolated bona fide stars across the field and, which is done on every individual science frame (i.e., 12 times in I band and 3 times in V band for every galaxy). To improve the PSF model, we checked the resid-uals of each star and rejected the stars with a strong residual, deriving a new PSF model, and repeatedly checked the resid-uals until there were no apparent systematic residresid-uals in sub-tracted images of stars used for the PSF model. To produce the deepest possible image (to find the faintest stars) we used MON-TAGE2, which stacks the V and I frames together. On this deep image, the DAOPHOT2 routines FIND, PHOT, and ALLSTAR were run producing the deepest possible point source catalog. This catalog was then used as input for the simultaneous PSF fitting on every science frame using ALLFRAME. The advan-tages of using ALLFRAME to perform simultaneous consistent photometry on all images of a given field are described in detail by Stetson (1994). In essence, ALLFRAME photometry starts with the initial star list that is derived from the very deep im-age, made with MONTAGE2, and then it determines the bright-ness and centroids for all stars in each frame iteratively. In each iteration, the brightness and centroid corrections are computed from the residuals, after PSF subtraction, and are applied to im-prove the fit. Periodically, the underlying diffuse sky brightness is computed around each star’s location after all stars have been subtracted from the frame. This procedure results in a more ro-bust sky correction and stellar centroid determination, which is ultimately important for precise PSF photometry. The resulting catalogs for each individual image were then average combined, per filter, with the DAOMATCH and DAOMASTER routines. We kept only those objects that were measured on at least two thirds of all input images for the given filter, that is twice de-tected in the V band and eight times in the I band. The V and Icatalogs were than merged with a 1 pix tolerance to create the final master catalog of all detected sources in our science images. Subsequently, we purged this photometric catalog from non-stellar and blended sources. To do so, we applied quality cuts on the χ and shar p parameters, and the photometric errors. We im-posed that χ had to be smaller than 1.5, shar p had to be between −2 and 2, and the magnitude errors were only allowed to deviate 50% from the best fitting value at a given magnitude. In total, a detection has to fulfill these four constraints (χ, shar p, Verr, and
Ierr) to remain in the catalog. See Fig. 2 for an example of the
different constraints in the case of dw1322-39. The red symbols are detections which were removed from the catalog since they did not satisfy our quality constrains.
Table 2. Completeness limits according to our artificial star test.
Name V75 I75 V50 I50 V25 I25
mag mag mag mag mag mag
dw1315-45 26.00 24.55 26.31 24.73 26.58 24.90 KKs54 26.01 24.32 26.20 24.58 26.39 24.84 dw1318-44 26.13 24.16 26.46 24.31 26.69 24.46 dw1322-39 26.28 24.96 26.51 25.21 26.70 25.40 KK198 26.00 24.19 26.25 24.35 26.54 24.51 dw1323-40c 25.75 24.09 25.95 24.27 26.16 24.44 dw1323-40b 25.89 24.66 26.19 24.89 26.46 25.18 dw1323-40 25.80 24.61 26.05 24.77 26.34 24.92 dw1329-45 25.83 24.40 26.03 24.73 26.22 24.98 dw1331-37 26.13 24.25 26.43 24.46 26.66 24.72 dw1336-44 26.23 24.58 26.56 24.77 26.89 24.96 dw1337-44 25.54 24.64 25.87 24.88 26.09 25.18 dw1341-43 25.97 24.22 26.29 24.48 26.57 24.76 dw1342-43 25.99 24.22 26.37 24.54 26.65 24.82 KKs58 26.12 24.20 26.45 24.36 26.73 24.54
2.3. Completeness and error analysis
To assess the detection completeness and characterize the mea-surement errors for our PSF photometry, we performed artificial star experiments. In each image we injected 900 artificial stars, all with the same magnitude, and repeated this in 0.5 magnitude steps between 20–28 mag (i.e., 16 realizations). These stars were uniformly spread on a hexagonal grid over each field. The sepa-ration between stars corresponds to twice the PSF fitting radius (i.e., 40 pixels), such that the artificial stars do not increase the natural crowding, while we still added a sufficiently large num-ber of stars to get meaningful statistics out of the experiment. We injected the same V and I instrumental magnitudes to the images, which translates into (V − I) = 0.6 mag when the zero points are applied. We did not make specific simulations that explore a wider range of colors. Since we resampled the scientific images, we could inject each star at the same pixel position throughout the different images of each galaxy. In this way, we created 16 mock-realizations for each galaxy. On these mock-realizations, we applied our PSF photometry pipeline as described before; the only difference was that we did not rederive the PSF model. The pipeline produced new catalogs which include the photometry of the artificial stars. By comparing the number of detected ar-tificial stars and their photometry, we derived the completeness and the photometric error. We present the completeness curves and photometric error as a function of the input magnitude for dw1322-39 in Fig. 3 and all galaxies in the Appendix (Fig. A.1). At the faint end, below the 50% completeness level, the detected artificial stars systematically deviate from the input magnitude. This is due to them overlapping with positive noise peaks, mak-ing them detectable in the first place, but also too bright. The 75%, 50%, and 25% completeness levels are listed in Table 2. We have used a linear interpolation between the measured points to estimate these limits.
3. Color magnitude diagrams
In the previous section we presented the pipeline creating our photometric catalogs. In the following, we produce color mag-nitude diagrams (CMDs) to study the resolved red giant branch of the dwarf galaxies and measure their mean metallicity. Fi-nally, we measure the distances for nine dwarf galaxies using a Bayesian approach.
Fig. 1. FORS2 VLT images combined with MONTAGE. All images are oriented with north up and east to the left and cover a 20× 20area.
3.1. The dwarf galaxy CMDs
At the distance of 4 Mpc of the Centaurus group (Karachent-sev et al. 2013), the dwarf galaxy candidates only cover a small fraction of chip 1 of the CCD. To derive the CMD for the dwarf galaxies, we used a circular aperture of 2.5×reff(effective radius)
around their estimated center to produce the galactic CMDs. The reff values were taken from integrated light photometry (Jerjen
et al. 2000; Müller et al. 2017a). The galaxy’s extent is well approximated with 2.5 × reff. Using larger radii increases the
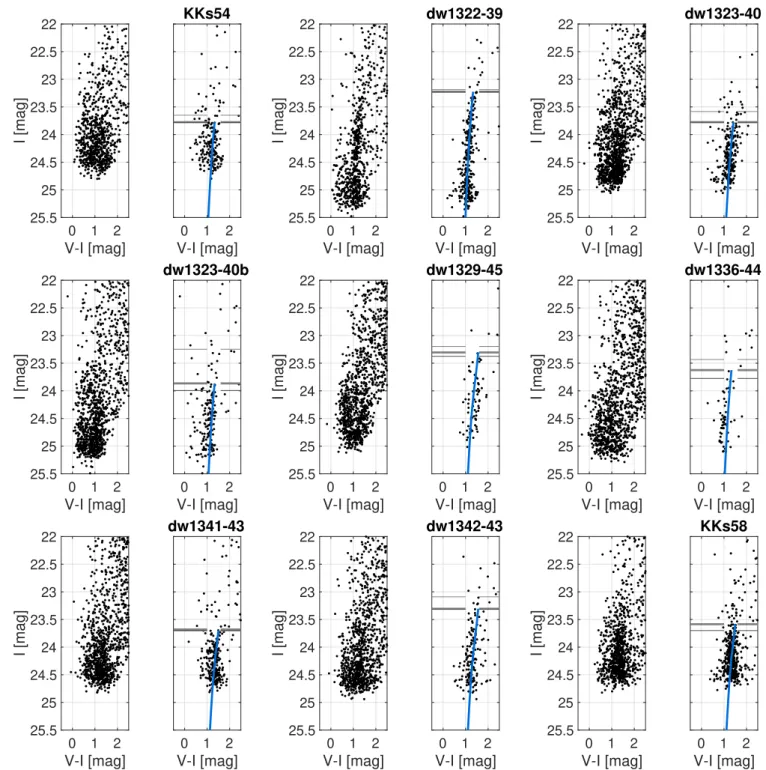
pollution by foreground Milky Way stars and unresolved com-pact background galaxies, which start to be comparable in num-ber to (or even more numerous than) the potential dwarf galaxy members. This thus decreases the signal-to-noise ratio. We sub-sequently produced a reference CMD for each target used to sta-tistically clean the galaxy’s CMD from foreground stars which will unavoidably overlap with the dwarf galaxy. This reference CMD consists of all stars on Chip 1 which are outside of the galactic aperture radius times √2 (to avoid the outmost galaxy stars). The area of the reference CMD is much larger than the galactic aperture because the field of view of Chip 1 is roughly 7 × 8 sq. arcmin, while the targets sizes are typically < 1 ar-cmin in radius. In Fig. 4, we present all stars on the CCD (left) and in the galactic aperture (right) for every galaxy for which we were able to resolve the RGB. The candidates, not being re-solved into their individual stars, are discussed below. In Fig. 4, we also present the detected tip of the RGB (TRGB) magnitude, as well as the best-fitting isochrone, which are discussed in the next subsection. It is noteworthy that the quality of the CMDs strongly varies depending principally on the seeing conditions during the specific target observations.
Every CMD exhibits a continuous population of stars which can be associated to the RGB. For some galaxies (KKs 54,
dw1322-39, dw1323-40b, and KKs 58), an extension of the RGB toward brighter magnitudes and redder color is visible, which bears resemblance to a population of AGB stars. If real, they indicate the presence of an intermediate age stellar population in these dwarf galaxies due to extended star formation activ-ity. There are also some blue stars with (V − I)0 < 0.7 mag in
dw1323-40b. If associated with dw1313-40b, these blue stars would trace recent star formation, similar to the case of dw1335-29 – a satellite member of M 83 – as suggested by Carrillo et al. (2017). However, we find the blue stars to be almost isotropically distributed across the galaxy, indicating that they are probably contaminating background galaxies.
3.2. TRGB distance estimation
In the literature, there are several methods to measure the tip of the red giant branch (TRGB, e.g., Lee et al. 1993; Cioni et al. 2000; Makarov et al. 2006; Conn et al. 2012). Physically, this sharp feature in the CMD is well understood. On their evolu-tionary path through the red giant branch, the stars have long exhausted the hydrogen fuel in the core, while still burning hy-drogen in the shell. Once the thermal pressure is insufficient to stabilize the star, it contracts until the core becomes degenerate. Eventually, the temperature reached in the core is hot enough to ignite the helium burning, and an explosive helium flash oc-curs, ultimately leading to a change in color and temperature. Thus the stars leave the red giant branch. This helium flash is only marginally dependent on the metallicity and is an excellent standard candle to measure the distance of an object (Da Costa & Armandroff 1990; Lee et al. 1993), this has a typical error of 5% (Tully et al. 2015). In Müller et al. (2018c), we used a Sobel edge detector (Lee et al. 1993) to determine the TRGB. In the following, we used a different method based on Bayesian
16 18 20 22 24 26 I [mag] 0 2 4 6 8 10 CHI dw1322-39 16 18 20 22 24 26 I [mag] 0 0.05 0.1 0.15 0.2 I error [mag] 18 20 22 24 26 28 V [mag] 0 0.05 0.1 0.15 0.2 V error [mag] 16 18 20 22 24 26 I [mag] -2 -1 0 1 2 sharp
Fig. 2. Quality cuts on photometric catalog of dw1322-39. The black dots correspond to stars fulfilling the constraints, while the red dots show rejected objects; blue dashed lines in the bottom plots of magnitude vs. error indicate 50% deviation from the best fitting value (black line) at the given magnitude.
20 22 24 26 28
input magnitude [mag] -0.5 0 0.5 m [mag] 0 50 100 rate [%] dw1322-39
Fig. 3. Results of our artificial star experiments for I (red) and V (dashed blue) bands for dwarf galaxy dw1322-39. The remaining galaxies are shown in Fig A.1 in the Appendix. Upper panel: the recovery fraction of the artificial stars induced into the science frames as a function of the input magnitude. Bottom panel: the difference between the input and measured magnitude as a function of input magnitude.
considerations (Conn et al. 2011, 2012). This was necessary
be-cause the Sobel edge detection becomes quite unreliable when the data are noisy, which happens to be the case with low sur-face brightness galaxies in general and even more when they are close to the Milky Way disk (b = 19.4 deg). We followed the implementation of Conn et al. (2011, 2012), which employs a Markov Chain Monte Carlo (MCMC) method. For each star, the probability is calculated for it belonging to a RGB model, a background model, and a radial density model. The RGB model uses a simple power law (Makarov et al. 2006)
ψ = 10a(m−mTRGB)
to describe the luminosity function of stars in the galaxy. The background contamination is modeled with a polynomial func-tion (BG) fit to the luminosity funcfunc-tion of the background stars on the reference CMD. From this BG function, together with the area used for the galaxy and reference CMDs, the expected number of background objects within our galactic aperture can be estimated. The fraction of contaminating sources is given as the contamination factor c. A log likelihood estimation L for a given set of parameters (a, mTRGB, and c) is calculated by
assign-ing a probability to each star:
M(m)=((1 − c) ψ(m)+ c BG(m) if m <= mTRGB
0 1 2 V-I [mag] 22 22.5 23 23.5 24 24.5 25 25.5 I [mag] 0 1 2 V-I [mag] KKs54 0 1 2 V-I [mag] 22 22.5 23 23.5 24 24.5 25 25.5 I [mag] 0 1 2 V-I [mag] dw1322-39 0 1 2 V-I [mag] 22 22.5 23 23.5 24 24.5 25 25.5 I [mag] 0 1 2 V-I [mag] dw1323-40 0 1 2 V-I [mag] 22 22.5 23 23.5 24 24.5 25 25.5 I [mag] 0 1 2 V-I [mag] dw1323-40b 0 1 2 V-I [mag] 22 22.5 23 23.5 24 24.5 25 25.5 I [mag] 0 1 2 V-I [mag] dw1329-45 0 1 2 V-I [mag] 22 22.5 23 23.5 24 24.5 25 25.5 I [mag] 0 1 2 V-I [mag] dw1336-44 0 1 2 V-I [mag] 22 22.5 23 23.5 24 24.5 25 25.5 I [mag] 0 1 2 V-I [mag] dw1341-43 0 1 2 V-I [mag] 22 22.5 23 23.5 24 24.5 25 25.5 I [mag] 0 1 2 V-I [mag] dw1342-43 0 1 2 V-I [mag] 22 22.5 23 23.5 24 24.5 25 25.5 I [mag] 0 1 2 V-I [mag] KKs58
Fig. 4. Extinction-corrected CMDs for newly studied dwarf galaxies. Left: CMD for all stars on the CCD. Right: Stars within an aperture of 2.5 times the effective radius around the galaxy. The thick and thin gray lines indicate the estimated TRGB and the uncertainties, respectively. The blue line shows the best fitting isochrone.
N(r)= exp(−r/reff)
L=
N
X
i=1
log M(m(i)) N(r(i))
For this to work, the BG, ψ, and the exponential density pro-file need to be probability density distributions, which need to be normalized. Now the MCMC scheme comes into play: We propose a new set of parameters (aproposed, mTRGB,proposed, and
cproposed) by randomizing their values drawn from a normal
dis-tribution on top of the current values (acurrent, mTRGB,current,and
ccurrent). The standard deviation is chosen such that the new
val-ues can fully cover the space we expect them to be. Next, the two likelihoods Lproposedand Lcurrentare compared with each other. If
their ratio is less than r, which is drawn from a uniform dis-tribution between zero and one, the proposed set of parameters is accepted and added to the chain. If not, the current value is added. This is repeated 100,000 times. Subsequently, the chain will produce a posterior distribution for (a, mT RGB, and c), where
the mode of the posterior distribution of mT RGBwill be our
esti-mated TRGB magnitude. The uncertainties are given by the 68% confidence interval. The posterior distribution will not follow a
0 1 2 V-I [mag] 22 22.5 23 23.5 24 24.5 25 25.5 I [mag] 0 1 2 V-I [mag] dw1335-29 0 1 2 V-I [mag] 22 22.5 23 23.5 24 24.5 25 25.5 I [mag] 0 1 2 V-I [mag] dw1340-30
Fig. 5. Extinction-corrected CMDs for dwarf galaxies from Müller et al. (2018c). Left: CMDs for all stars on the CCD. Right: Stars within the aperture (black dots), the estimated TRGB (gray line), and the best fit-ting isochrone (blue line).
normal distribution, meaning that this error includes the interval with ±34% around the mode.
The calibration of the TRGB magnitudes is done in accor-dance to Bellazzini et al. (2004) and Rizzi et al. (2007):
MT RGBI = −4.05 + 0.217[(V − I)0− 1.6],
(V − I)0 = 0.581[Fe/H]2+ 2.472[Fe/H] + 4.013.
To estimate the mean metallicities [Fe/H] we fit theoretical BaSTI isochrones (Pietrinferni et al. 2004), using an age of 10 Gyr for the isochrones. BaSTI isochrones are available at [Fe/H] of -2.267, -1.790, -1.488, and -1.266 dex steps, which is sufficient for the given accuracy in the color. The selection of the best-fitting isochrone was done by minimizing the dis-tances between the color of the stars and the color of the di ffer-ent isochrones, respectively. The isochrones are presffer-ented in the CMDs (Figs. 4 and 5). The properties of the dwarfs are presented in Table 3.
As a consistency check, we applied the MCMC method to the two already confirmed M 83 dwarfs, dw1335-29 and dw1340-30 from Müller et al. (2018c), where we used a So-bel Edge detection to find the position of the TRGB, employing
deep VLT+FORS2 VI photometry. The TRGB magnitudes were
estimated to be 24.43±0.1 mag for both galaxies (Müller et al. 2018c). Here we derived 24.40+0.01−0.02mag and 24.43+0.03−0.03mag, re-spectively, which are fully consistent with the previous esti-mates. For one of the dwarfs, dw1335-29, Carrillo et al. (2017)
measured a distance of 5.01+0.74−0.22Mpc independently with HST imaging, which is consistent with our previous estimate of 5.03±0.24 Mpc (Müller et al. 2018c), and our current distance estimate of 4.96+0.02−0.05Mpc. For dw1340-30, we get a new distance estimate of 5.06+0.07−0.08Mpc.
3.3. Metallicity spread
The majority of the stars in the CMDs studied here follow, within a certain spread, the best-fitting isochrone, see for example the CMD of KKs 58 in Fig 4. This spread could potentially indi-cate a complex stellar population and spread in metallicity, as in the globular cluster ega Centauri (Villanova et al. 2014) or the Sculptor dwarf spheroidal for example (Babusiaux et al. 2005). Before such conclusions can be drawn, the error budget has to be understood since it can induce a spread in the (V − I)0 due
to limited photometric precision. For that purpose, we used our artificial star tests to see how a perfect population of stars is scat-tered due to measurement uncertainties. The scatter is mainly driven by two components: the systematic error and the standard deviation at given magnitude (see Fig. 3). To assess the expected spread at given V and I band magnitudes, we calculated:
σ = qI2
err+ Verr(I)2+ I2std+ Vstd(I)2,
by taking Ierr, Verr, Istd, and Vstd directly from Fig. 3 and
in-terpolated where necessary. We then measured the spread of (V − I)0 for the stars in the CMD along the isochrone, binned
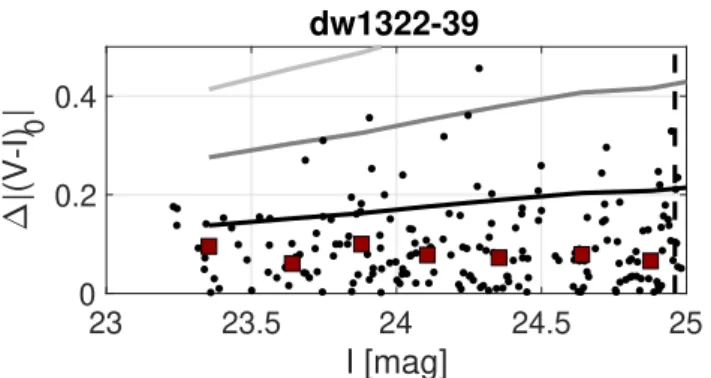
over 0.25 mag steps. Only stars within a color range between 0.9 and 1.8 mag were considered. The spread in this magni-tude bin is then compared to the expected spread of photomet-ric uncertainty, coming from our artificial star experiment. If the measured trend is lower, then there is no significant metallicity spread detected. If it is larger, the spread could be of physical nature. For every galaxy, we created a plot like Fig. 6, where we indicate the measured spread, as well as the 1, 2, and 3σ limits from the artificial star data. We show all plots in the Ap-pendix (Fig. A.2). For all but one galaxy, the measured spread is systematically below the 1σ line, indicating that there is either no metallicity spread, or the uncertainties from the photometric pipeline are too large to detect such a spread. Only for dw1329-45 is there a marginal signal, however, this galaxy is affected by light from a very close-by star (see Fig. 1). Because our artifi-cial star experiments take advantage of the full CCD, the uncer-tainty in the close proximity of this star could be underestimated. We therefore conclude that with our photometry, we have not detected a metallicity spread within the studied dwarf galaxies. The resolved dwarf galaxies are most likely akin to old gas-poor dwarf Spheroidal population around the Milky Way and the An-dromeda galaxy. However, we remark that while for the Milky Way dwarf galaxy, Carina, the color spread in the RGB is rather small, multiple sequences of star formation have been measured (Bono et al. 2010), showing that the absence of a significant color spread in the RGB doesn’t rule out a more complex un-derlying stellar population (i.e., a combination of different ages and metallicities can result in a relatively thin RGB).
3.4. Unresolved targets
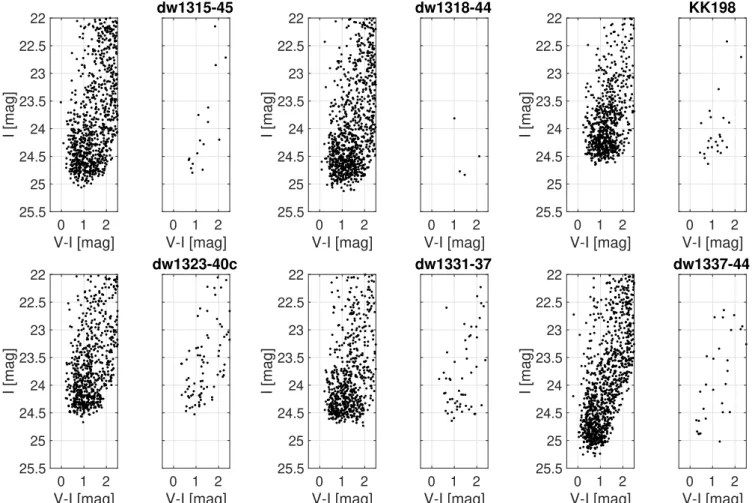
From our 15 targets, we were able to confirm nine to be mem-bers of Cen A based on their resolved stellar population. For six targets, however, we could not identify clear overdensity of stars either spatially, or as RGB sequence in CMDs, see Fig. 7 for
23 23.5 24 24.5 25
I [mag]
0 0.2 0.4|(V-I)
0|
dw1322-39
Fig. 6. Measured (V − I)0 spread as function of I-band magnitude for
stars observed in dw1322-39 (black dots) in comparison with expected uncertainty derived from our artificial star tests. The red squares corre-spond to the mean values binned over 0.25 mag steps. The solid lines correspond to the 1, 2, and 3σ levels, the dotted line to the 75% com-pleteness limit. The remaining galaxies are shown in Fig. A.2 in the Appendix.
the corresponding CMDs. One candidate, dw1337-44, is clearly a patch of spurious galactic cirrus. Another candidate, KK198, is actually a LSB background spiral galaxy. Even with our deep imaging, the spiral arms are barely visible, indicating that indeed such objects will contaminate any dwarf galaxy candidate list based on shallow imaging campaigns. The candidate dw1315-45 appears to be a background galaxy in projection close to a galaxy at redshift z = 0.08 (D = 360 Mpc). Putting dw1314-45 at this distance, it would have an effective radius of reff = 17 kpc.
Spectroscopy will be needed to unravel the true nature of this ob-ject, but it is reasonable to assume that this object lies closer than 360 Mpc. For dw1323-40c, we found no feature what-so-ever, meaning that the detection in Müller et al. (2017a) happened to be due to noise. Lastly, two objects, dw1318-44 and dw1331-37, are clearly visible as extended LSB objects and resemble dwarfs in their morphology. They may be in the outer distant part of the Centaurus aggregate, which is out of reach from our detec-tion limit. Their 25 percent completeness limit is 24.46 mag and 24.72 mag in the I-band, corresponding to a lower distance limit of 5.2 Mpc and 5.8 Mpc, respectively. In Fig. 8, we show the on-sky distribution of all galaxies and remaining candidates in the field around Cen A/M 83.
4. Properties of the new dwarf galaxies
Having derived the distances of the dwarf galaxies, it is possible to investigate their location on the scaling relations defined by Local Group dwarfs. Furthermore, we searched for tidal signa-tures in the stellar distribution.
4.1. Scaling relations
The dwarf galaxies in the Local Group follow several scaling re-lations (Martin et al. 2008; Kirby et al. 2013), such as the central surface-brightness to absolute luminosity relation or the effective radius to absolute luminosity relation (see also McConnachie 2012). These relations are used to estimate the membership of a dwarf galaxy candidate before follow-up observations are con-ducted (e.g., Müller et al. 2017a) by assuming a distance which corresponds to the putative host galaxy. Once the distance has been measured, no assumptions have to be made and the proper-ties of the dwarfs can be compared to those in the Local Group. We did not rederive the structural parameters on our FORS2
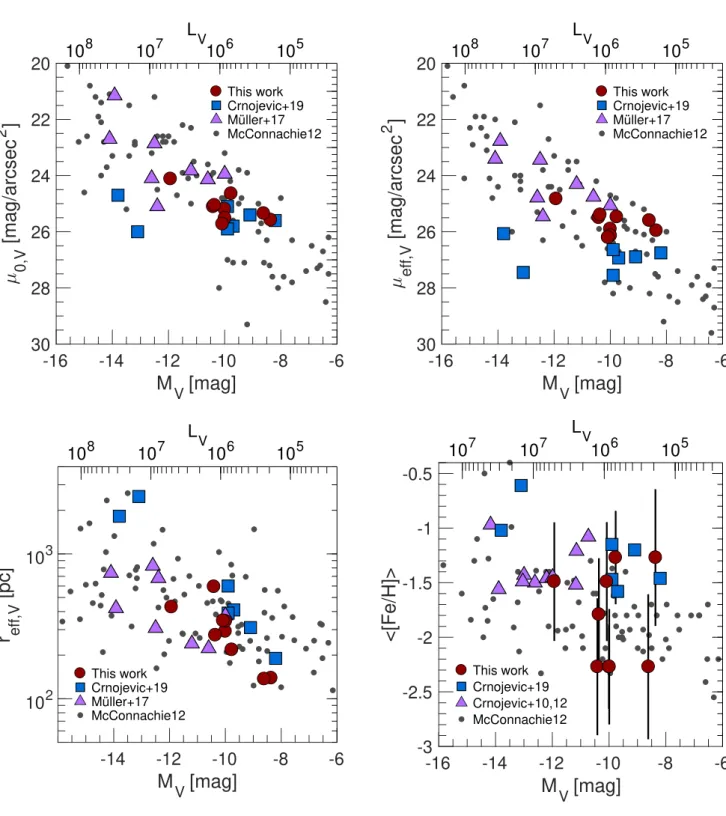
im-ages, we rather used the values derived from integrated light pho-tometry (Jerjen et al. 2000; Müller et al. 2017a). This is due to the difficulty of deriving structural parameters via the resolved stellar population (however, see Martin et al. 2008; Sand et al. 2014), especially when only a handful of stars are available. In Fig. 9, we present several of the scaling relations for our newly confirmed dwarf galaxies and compare them to other known Lo-cal Group (McConnachie 2012) and Centaurus A dwarf galaxies (Crnojevi´c et al. 2010, 2012, 2019; Müller et al. 2017a). It is ap-parent that the Centaurus A dwarf galaxies follow the relations as spanned by the Local Group dwarfs. In Fig. 9, we also show the mean metallicity estimated from the CMD as a function of the luminosity. The errors are estimated by converting the mean color 0.5 mag below the TRGB into a mean metallicity via Rizzi et al. (2007):
[Fe/H]= −12.64 + 12.6 (V − I)0− 3.3 (V − I)20.
This metallicity value is fully consistent with the one obtained by fitting stellar evolutionary isochrones from the BaSTI database (Pietrinferni et al. 2004) and assuming a 10 Gyr old population. In Table 3, we further present the ellipticity (e = 1 − b/a) and position angle (PA) of the dwarf galaxies, measured with MTO (Teeninga et al. 2013), which is a software program to detect as-tronomical sources. The ellipticities range between 0.1 and 0.6, which is consistent with the bulk of Local Group dwarfs (Mc-Connachie 2012).
4.2. Tidal features
The dwarf galaxies studied here are likely bound members of Cen A (Woodley 2006) and tidal forces may be important. One may wonder if tidal disturbances are detectable in the on-sky distribution of the observed RGB stars. For that, we created a stellar map for each detected point source between I=23.0 mag and I=25.5 mag. Additionally, we used the best fitting isochrone to color-code the stars corresponding to a mask of the dwarf galaxy’s red giant branch in red (having a color between 0.9 and 1.8 mag), and the remaining stars are in blue. These stellar maps are then binned into 100 × 100 pixels boxes, which are color-coded according to the RGB stellar density within the box. The centers of the galaxies were estimated with a k-mean algorithm as explained in Müller et al. (2018c). We inspected each stellar map overlayed with its binned density map and searched for the following two distinct features: (a) asymmetries in the overall stellar distribution, and (b) overdensities of potential RGB stars around the dwarf galaxy.
For dw1323-40b, we indeed detected some overdensities of stars at the southern outskirt of the galaxy. The stellar density in this region is almost as high as in the center. By studying the stacked image itself, it is apparent that this dwarf galaxy is elon-gated along this direction and is highly elliptical with e= 0.64. However, with the depth of the photometry no conclusive state-ment can be made about it being truly tidally distorted or not; the overabundance could well be a small-number fluctuation and/or an effect of the large ellipticity.
For dw1336-44, we find a discrepancy between the center of the galaxy derived by the RGB stars only and all the stars within the galactic aperture. But this can be explained by the few stars found within the aperture (∼ 60 stars). In the field outside of the galactic apertures of the studied dwarf galaxies, there are no significant stellar overdensities.
To summarize, we find no convincing evidence that the dwarfs are tidally disturbed based on the probable member star distribution on the CCD chips. This is not unexpected, as there
0 1 2 V-I [mag] 22 22.5 23 23.5 24 24.5 25 25.5 I [mag] 0 1 2 V-I [mag] dw1315-45 0 1 2 V-I [mag] 22 22.5 23 23.5 24 24.5 25 25.5 I [mag] 0 1 2 V-I [mag] dw1318-44 0 1 2 V-I [mag] 22 22.5 23 23.5 24 24.5 25 25.5 I [mag] 0 1 2 V-I [mag] KK198 0 1 2 V-I [mag] 22 22.5 23 23.5 24 24.5 25 25.5 I [mag] 0 1 2 V-I [mag] dw1323-40c 0 1 2 V-I [mag] 22 22.5 23 23.5 24 24.5 25 25.5 I [mag] 0 1 2 V-I [mag] dw1331-37 0 1 2 V-I [mag] 22 22.5 23 23.5 24 24.5 25 25.5 I [mag] 0 1 2 V-I [mag] dw1337-44
Fig. 7. Extinction-corrected color-magnitude diagrams for unresolved targets. Left: CMD for all stars on the CCD. Right: Stars within the aperture. Table 3. Properties of newly confirmed dwarf galaxies.
KKs54 dw1322-39 dw1323-40b dw1323-40 dw1329-45 dw1336-44 dw1341-43 dw1342-43 KKs58 RA (J2000) 13:21:31.8 13:22:31.8 13:23:55.6 13:24:53.9 13:29:09.9 13:36:49.0 13:41:36.6 13:42:43.8 13:46:00.4 DEC (J2000) −31:53:09.8 −39:54:21.6 −40:50:09.1 −40:45:38.7 −45:10:33.7 −44:26:55.5 −43:51:19.6 −43:15:21.1 −36:19:42.4 IT RGB(mag) 23.78+0.01−0.12 23.26+0.01−0.06 23.87+0.13−0.62 23.78+0.00−0.19 23.31+0.07−0.11 23.63+0.15−0.19 23.70+0.00−0.03 23.31+0.01−0.22 23.59+0.12−0.01 [Fe/H] (dex) −2.27 −2.27 −2.27 −1.79 −1.27 −2.27 −1.49 −1.27 −1.49 MT RGB I (mag) −4.09 −4.09 −4.09 −4.08 −4.00 −4.09 −4.05 −4.00 −4.05 (m − M)0(mag) 27.87+0.01−0.12 27.35+0.01−0.06 27.96+0.13−0.62 27.86+0.00−0.19 27.31+0.07−0.11 27.72+0.15−0.19 27.74+0.00−0.03 27.31+0.01−0.22 27.63+0.12−0.01 Distance (Mpc) 3.75+0.01−0.21 2.95+0.02−0.08 3.91+0.24−0.97 3.73+0.01−0.31 2.90+0.10−0.14 3.50+0.25−0.30 3.53+0.00−0.04 2.90+0.01−0.27 3.36+0.18−0.02 AV, AI(mag) 0.176, 0.097 0.244, 0.134 0.334, 0.183 0.306, 0.168 0.252, 0.138 0.338, 0.186 0.255, 0.140 0.218, 0.120 0.169, 0.093 MV (mag) −10.41+0.01−0.12 −10.03+0.01−0.06 −9.99+0.13−0.62 −10.36+0.00−0.19 −8.36+0.07−0.11 −8.61+0.15−0.19 −10.08+0.00−0.03 −9.77+0.01−0.22 −11.93+0.12−0.01 LV (106M ) 1.25+0.01−0.14 0.85+0.01−0.05 0.85+0.11−0.37 1.19+0.00−0.19 0.19+0.01−0.02 0.24+0.04−0.04 0.92+0.00−0.02 0.69+0.01−0.12 5.06+0.57−0.05 re f f,r(pc) 594+1−17 296+2−8 343+20−80 275+0−23 139+5−7 137+10−12 346+0−4 218+1−21 430+23−2 Ellipticity (1 − b/a) 0.21 0.50 0.64 0.10 – 0.33 0.08 0.28 0.14 PA(north to east) 96.8 120.8 168.1 18.8 – 81.0 0.3 67.4 38.5
Notes. The properties for MV, LV, and re f f,r,pcwere derived using the distances estimate here and the published structural parameters from Jerjen
et al. (2000) for KKs54 and KKs58, and from Müller et al. (2017a) for the rest. Due to its closeness to a bright star, we are not able to derive e and PAfor dw1329-45.
was also no visible evidence in the integrated-light images of our DECam survey (Müller et al. 2017a). In contrast, the dwarf galaxies Cen A-MM-dw3 (Crnojevi´c et al. 2016) and KK 208 (Karachentsev et al. 2002) are visibly disturbed in the integrated-light images, see for example Fig. 10 in Müller et al. (2018c) for the latter. These two galaxies are also, on average, closer to the large host (Cen A and M83) than our targets.
5. The luminosity function of Cen A satellite system A crucial test in small-scale cosmology is the number of pre-dicted dark matter subhalos in comparison to the observed num-ber of dwarf galaxies. Around the Milky Way, the numnum-ber of pre-dicted subhalos from dark matter-only simulations exceeded the observations by a factor of more than 100 (Moore et al. 1999). This has since been revised by taking baryons into account with
12:40:00 13:40:00 14:40:00
[hr:mm:ss]
-50 -45 -40 -35 -30 -25 -20[deg]
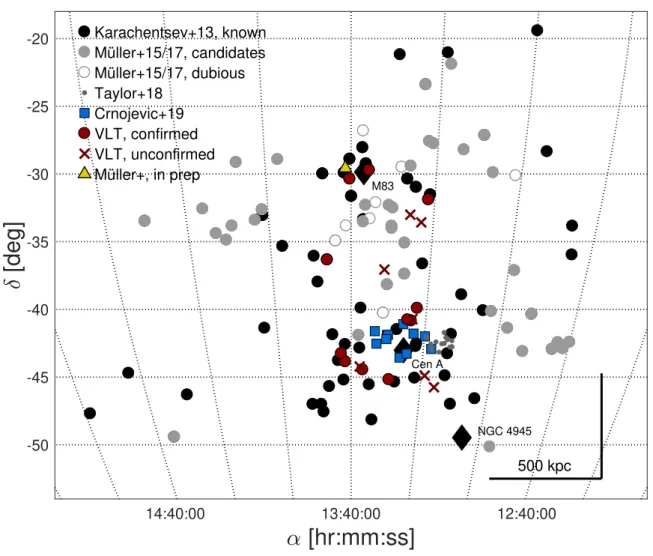
Karachentsev+13, known Müller+15/17, candidates Müller+15/17, dubious Taylor+18 Crnojevic+19 VLT, confirmed VLT, unconfirmed Müller+, in prep NGC 4945 M83 Cen A 500 kpcFig. 8. On-sky distribution of galaxies in field of Cen A/M 83. The large black diamonds correspond to M 83 (top), Cen A (middle), and NGC 4945 (bottom). The black rulers indicate 500 kpc at the distance and declination of Cen A. The black dots are confirmed dwarf galaxies in this field (Karachentsev et al. 2013), the gray dots are the remaining candidates in the field (Müller et al. 2015, 2017a; Taylor et al. 2018). With the gray circles, we denote dubious candidates (probably Galactic cirrus patches), based on their morphology, size, and faintness. The red dots correspond to confirmed dwarf galaxies employing the VLT (Müller et al. 2018c, and this work), the blue squares to the recently confirmed dwarfs with HST (Crnojevi´c et al. 2019). The red crosses are the candidates which we ruled out as dwarf galaxies in the immediate vicinity of Cen A/M 83 (Müller et al. 2018c, and this work). The yellow triangle indicates a newly discovered dwarf galaxy of Cen A, confirmed using SBF distance measurements (Müller et al, in preparation, see Section 6.2). Our Cen A survey ends at roughly δ= −45 deg.
recent simulations matching the observations (e.g., Sawala et al. 2016; Simpson et al. 2018), leading to good agreement between the observations and cosmology in the Local Group. Smercina et al. (2018) claimed a dearth of satellite galaxies around M 94 and find only two satellites in deep Subaru Hyper Suprime Cam imaging within 100 kpc. This is incompatible with state-of-the-art cosmological simulations. However, in the more extended vicinity (∼500 kpc), 14 probable satellites with known radial velocities scatter around M 94 (Karachentsev & Kudrya 2014). Hence, it is still to be seen how the total number of satellites around M 94 compares to cosmological simulations.
Around Cen A, we established a good census of dwarf galax-ies within 200 kpc (see Table 4), which we now compare to cos-mological simulations. The completeness of the dwarf galaxy catalog is MV = −10 mag, based on artificial galaxy tests (Müller
et al. 2017a). At fainter luminosity, incompleteness kicks in, meaning that we underestimated the total number of satellites. We used the IllustrisTNG Project (Springel et al. 2018),
specif-ically the simulation TNG100-1 with a box size of 110.7 Mpc and a dark matter particle mass mDM = 7.5 × 10⁶M . We used
the publicly available z= 0 galaxy catalogs (Nelson et al. 2018). Our Cen A analogs were selected to be the primaries of ha-los within a mass range of 4.0 × 10¹² ≤ M
200 ≤ 1.2 × 10¹³
(Karachentsev et al. 2007; Woodley 2006; Woodley et al. 2007, 2010), where M200 is the total mass within a sphere that has a
mean density of 200 times the critical density of the Universe. To ensure a comparable isolation to Cen A, all hosts that have another halo with M200≥ 0.5 × 10¹²within a distance of 1.4 Mpc
were discarded (representing the separation between Cen A and M 83). This left us with 237 hosts. We mock-observed these sys-tems from random directions by placing them at a distance of 3.8 Mpc and selecting all luminous galaxies that (1) lie within a cone of opening angle 3.5◦ around the host galaxy, (2) are no closer than 0.5◦to the host, and (3) have a distance of less than
800 kpc from the host, mimicking the selection volume of our observed galaxies. The V-band magnitudes MVof the selected
-16
-14
-12
-10
-8
-6
M
V[mag]
20
22
24
26
28
30
0,V[mag/arcsec
2]
10
510
610
710
8L
V This work Crnojevic+19 Müller+17 McConnachie12-16
-14
-12
-10
-8
-6
M
V[mag]
20
22
24
26
28
30
eff,V[mag/arcsec
2]
10
510
610
710
8L
V This work Crnojevic+19 Müller+17 McConnachie12-14
-12
-10
-8
-6
M
V[mag]
10
210
3r
eff,V[pc]
10
510
610
710
8L
V This work Crnojevic+19 Müller+17 McConnachie12-16
-14
-12
-10
-8
-6
M
V[mag]
-3
-2.5
-2
-1.5
-1
-0.5
<[Fe/H]>
10
510
610
710
7L
V This work Crnojevic+19 Crnojevic+10,12 McConnachie12Fig. 9. Scaling relations of dwarf galaxies: central surface brightness (top-left), effective surface brightness (top-right), effective radius (bottom-left), and mean metallicity (bottom-right) vs. absolute luminosity. We show Local Group dwarfs (gray dots, McConnachie 2012), previously studied Cen A dwarfs (blue squares and purple triangles, Crnojevi´c et al. 2010, 2012, 2019; Müller et al. 2017a), and our newly confirmed members (red circles).
“satellites,” as provided by the IllustrisTNG catalog, are then compared to the magnitudes of the observed satellite system.
In Figure 11, we show the observed luminosity function of the Cen A satellite system and the analogs from the simula-tions. Interestingly, there seems to be a lack of bright satellites. However, in absolute numbers this constitutes only a lack of two to three satellites with MV < −15, and this is furthermore
still within the 90% interval defined by the simulated analogs. The right panel indicates that within the considered range, the
lower host halo masses of M200 = 4 to 6 × 10¹²M provide
a better match to the observed luminosity function (down to MV ≈ −10 mag). Nevertheless, for all halo masses there is
agree-ment to within the 90 percent interval such that no strong con-clusions on the halo mass of Cen A can be drawn. On the faint end of the luminosity function (MV> −10), the number of
ob-served dwarfs is actually overshot (but still within the 90% in-terval). However, this might be a sign of lacking convergence in
500 1000 1500 x [px] 200 400 600 800 y [px] KKs54 0 5 10 15
Fig. 10. Stellar map of one confirmed dwarf galaxy. Red indicates stars within the RGB mask according to the best-fitting isochrone. Blue in-dicates the remaining stars. The circle shows the aperture used to con-struct the CMD. The remaining maps are shown in Fig. A.3 and A.4 in the Appendix.
Table 4. Dwarf galaxies within projected radius of 200 kpc around Cen A.
Name α δ D MV
deg (J2000.0) deg (J2000.0) Mpc mag
KK189 198.1875 -41.8319 4.23 -11.2 ESO269-066 198.2875 -44.8900 3.75 -14.1 NGC5011C 198.2958 -43.2656 3.73 -13.9 CenA-MM-Dw11 199.4550 -42.9269 3.52 -9.4 CenA-MM-Dw5 199.9667 -41.9936 3.61 -8.2 KK196 200.4458 -45.0633 3.96 -12.5 KK197 200.5042 -42.5356 3.84 -12.6 KKs55 200.5500 -42.7308 3.85 -12.4 CenA-MM-Dw10 200.6214 -39.8839 3.27 -7.8 dw1322-39 200.6558 -39.9084 2.95 -10.0 CenA-MM-Dw4 200.7583 -41.7861 4.09 -9.9 dw1323-40b 201.0000 -40.8367 3.91 -9.9 dw1323-40 201.2421 -40.7622 3.73 -10.4 CenA-MM-Dw6 201.4875 -41.0942 4.04 -9.1 CenA-MM-Dw7 201.6167 -43.5567 4.11 -7.8 ESO324-024 201.9042 -41.4806 3.78 -15.5 KK203 201.8667 -45.3525 3.78 -10.5 dw1329-45 202.3121 -45.1767 2.90 -8.4 CenA-MM-Dw2 202.4875 -41.8731 4.14 -9.7 CenA-MM-Dw1 202.5583 -41.8933 3.91 -13.8 CenA-MM-Dw3 202.5875 -42.19255 3.88 -13.1 CenA-MM-Dw9 203.2542 -42.5300 3.81 -9.1 CenA-MM-Dw8 203.3917 -41.6078 3.47 -9.7 dw1336-44 204.2033 -43.8578 3.50 -8.6 NGC5237 204.4083 -42.8475 3.33 -15.3 KKs57 205.4083 -42.5819 3.83 -10.6 dw1341-43 205.4221 -44.4485 3.53 -10.1 dw1342-43 205.7029 -43.8561 2.90 -9.8 KK213 205.8958 -43.7692 3.77 -10.0
Notes. The TRGB distances are compiled in the LV catalog (Karachent-sev et al. 2013) and are from the HST programs of Karachent(Karachent-sev et al. (2007), Crnojevi´c et al. (2019), and the VLT data presented here. The photometry comes from Jerjen et al. (2000), Müller et al. (2017a), and Crnojevi´c et al. (2019).
the simulations due to insufficient resolution to reliably model the smaller satellite galaxies.
6. The spatial structure of the Centaurus group Having derived accurate distances, we can study the 3D distri-bution of the galaxies in the Centaurus association. In Fig. 12,
we show all confirmed galaxies in the Centaurus region with TRGB distances. There are the following two main concen-trations: a well populated one around Cen A and a less popu-lated one around M 83. Apart from these concentrations, there are only a handful of galaxies (i.e., four to five) in the field around the two main galaxies. Based on the sky distribution of the dwarf galaxy candidates from our DECam survey, we sus-pected a bridge of dwarf galaxies similar to the ones discovered in the Local Group (Pawlowski et al. 2013). Such a connection is not apparent here, with the dwarf galaxies clustering around the major galaxies. However, several dwarf galaxy candidates still lack distance measurements, especially in the southern region of M 83, as is apparent in Fig. 8.
6.1. Pairs of satellites
Crnojevi´c et al. (2014) announced the first discovery of a pair of satellites outside of the Local Group, the dwarf galaxies Cen A-MM-dw1 and Cen A-MM-dw2, which are satellites of Cen A. Their projected separation is only 3 arcmin (= 3.9 kpc at Cen A’s distance), and they shared the same distance estimates. But with their updated distances (Crnojevi´c et al. 2019), Cen A-MM-dw2 seems to be located 200 kpc further away than what was previ-ously assumed. Crnojevi´c et al. (2019) still argue that the prob-ability for a chance alignment is negligible and, therefore, that they are indeed a pair of satellites given the distance uncertain-ties. We tested this assessment by making a simple Monte Carlo simulation. In every run we created two satellites at a random position in a sphere of 0.4 Mpc radius (i.e., the virial radius). We then calculated their true separation as well as their projected separation in the xy-plane (approximating the sky). After per-forming this 100,000 times, we counted the number of times we found a pair of satellites with an xy projection of 4 kpc or less. In total, 0.01 percent of the random realizations appear to be a pair of satellites by chance, given their on-sky projection. This shows that in principle, we can detect pairs of satellites, given that their on-sky separation is small and their distance estimates are similar.
We calculated the on-sky distances between the dwarf galaxy satellites as well as the 3D distances. We found that one other potential pair, KK 197 and KKs 55, have a projection separa-tion of 12 arcmin (= 13 kpc at a distance of 3.85 Mpc) and a 3D separation of 17 kpc. There are two other galaxies, Cen A-MM-dw1 and Cen A-MM-dw3, with a projection separation of 18 arcmin (= 20 kpc at a distance of 3.89 Mpc) and a 3D sep-aration of 36 kpc. However, Cen A-MM-dw3 is a tidally dis-rupted dwarf extending over several hundred kpc, which com-plicates the analysis. We therefore excluded these two galaxies from the list of pairs. The chance alignments of KK 197 and KKs 55 on-sky projections is with ∼0.1 percent, which is still quite low. Furthermore, adding the 3D separation will make it vanish. The question remains of at which separation do we count two galaxies as pairs. Let us assume that the virial mass of a typ-ical dwarf galaxy is around 1010M
(Bullock & Boylan-Kolchin
2017), which leads us to a virial radius of 45 kpc (using a Hubble constant of 68 km s−1Mpc−1). Thus, with their measured
sepa-rations, the two galaxies could indeed be identified as a physi-cal pair. KK 197 is 2.5 times brighter than KKs 55 (Müller et al. 2017a), that is 2.5 times more massive assuming the same mass-to-light ratio for both galaxies. Assuming that these four dwarf galaxies are indeed two physical pairs, the abundance of pairs of galaxies within the virial radius of Cen A is approximately 14 percent, that is 4 out of 28 dwarf galaxies. However, we note
−22 −20 −18 −16 −14 −12 −10 MV[mag] 0.0 0.2 0.4 0.6 0.8 1.0 1.2 1.4 1.6 log N Cen A TNG100 50 % 90 % 106 107 L10V8[L ] 109 1010 −22 −20 −18 −16 −14 −12 −10 MV[mag] 0.0 0.2 0.4 0.6 0.8 1.0 1.2 1.4 1.6 log N Cen A (5 ± 1) × 1012M (7 ± 1) × 1012M (9 ± 1) × 1012M (11 ± 1) × 1012M 106 107 L10V[L8 ] 109 1010
Fig. 11. Comparison between the observed and the simulated luminosity functions. Left panel: The luminosity function of Cen A within 200 kpc (red line) compared to the Illustris TNG100-1 simulation. The gray lines correspond to individual simulated Cen A analogs, the green line to the median, and the green shaded areas to the 90% and 50% intervals. Right panel: Same as the left panel, but now the simulated systems are binned based on their host halo mass M200, with solid lines indicating their mean relation and dashed lines their 90% intervals.
1.5
1
1
0.5
0
SGY
c
[Mpc]
-0.5
0
-1
SGX
c
[Mpc]
0.5
SGZ
c
[Mpc]
-1
0
-0.5
Fig. 12. 3D distribution of galaxies in Centaurus association, using supergalactic coordinates centered on Cen A. Two subgroups centered around M 83 (large dot on the left) and Cen A (large dot on the right) are clearly visible. In the Cen A subgroup, NGC 4945 is also indicated with a large dot. The dotted line indicates our line-of-sight toward Cen A, originating from the S GYcS GZcplane. The literature distance values are taken from
Tully et al. (2015), Müller et al. (2018c), and Crnojevi´c et al. (2019).
that to confirm these candidate pairs, they should share a similar systemic velocity.
6.2. Planarity of the satellite distribution
Let us now proceed to the question of the planes-of-satellites around Cen A. In Müller et al. (2016), we have studied the
sig-nificance of the two planes proposed by Tully et al. (2015), us-ing our newly detected dwarf candidates (Müller et al. 2017a) and the newly established members by Crnojevi´c et al. (2016). We found that two distinct planes are no longer supported by the new data, with dwarfs filling up the gap between the two planes. The distribution is consistent with a single normal distri-bution within 2σ. Recently, Crnojevi´c et al. (2019) revised the
distances to Cen A dwarf galaxies from their 2016 ground-based study using superior HST imaging. Additionally, they found two new dwarf members. These satellites, together with the dwarfs presented here, doubles the data available to study the 3D distri-bution (with respect to the sample used by Tully et al. 2015). One more dwarf galaxy belonging to Cen A was discovered in very deep DECam images taken from the NOAO archive (Müller et al, in preparation). Its distance of 3.90+1.43−0.86Mpc has been esti-mated by employing surface brightness fluctuations (SBF, Tonry & Schneider 1988). At first, this galaxy was expected to be a member of M 83 due to its close on-sky projection of ∼1 deg (see also Fig 8), but its distance rather suggests that it is a member of Cen A (even though the uncertainties in SBF are quite large). In Fig. 13, we show the edge-on view of the Centaurus planes, as it was defined in Tully et al. (2015). We indicate the new data presented here, from Crnojevi´c et al. (2019), as well as the new dwarf measured with SBF (Müller et al, in preparation). It is evident that the overall structure is flattened. If we assume that the two planes hypothesis is correct, then the addition of more galaxies should increase the signal-to-noise, which is not appar-ent here. Rather, the new dwarfs seem to be distributed between the two proposed planes, as their projected on-sky position al-ready suggested. In particular, the dwarfs can only reside along the indicated lines, given by the distance uncertainty along our line-of-sight. This means that there is no confusion between be-ing a member of the flattened structure or bebe-ing outside of it. Only one confirmed dwarf galaxy, PGC051659, resides outside this structure. However, several dwarf galaxy candidates in the outskirts of Cen A still lack distance measurements (Müller et al. 2017a; Taylor et al. 2018).
Taking all 45 galaxies with accurately estimated distances within 1 Mpc of Cen A into account and excluding the dwarf with the SBF distance estimate, we measured a minor-axis rms height of 160 kpc and a minor-to-major axis ratio of c/a= 0.50 using the tensor of inertia method (ToI, e.g., Pawlowski et al. 2015). The intermediate-to-major axis ratio is b/a = 0.71. Re-moving the outlying galaxy PGC051659, the height was es-timated to be 133 kpc with axis ratios of c/a = 0.41 (i.e.,
a semi major axis of 327 kpc) and b/a = 0.69. The
nor-mal of this sample (i.e., the minor axis) is given as nCASP =
[−0.250, −0.270,+0.930] in supergalactic coordinates, and it is perpendicular to the line-of-sight to within 4◦. The 3D rms ra-dius for all 45 galaxies is 404 kpc, which agrees well with the virial radius of Cen A. The long axis of the satellite distribution is aligned to within 8◦with the line-of-sight to Cen A. This begs the question of whether the found flattening could arise from the direction of the measurement uncertainties. To test this, we as-sumed a typical 5% uncertainty along the line-of-sight for ev-ery galaxy. Then, the true major aintr axis length is given by
a2 intr = a
2 obs− a
2
err, where aobsis the observed major axis length
and aerr is the length arising from measurement uncertainties.
With the 5% uncertainty at the distance of 3.7 Mpc to Cen A, this gives an intrinsic major axis length of aintr = 260 kpc and
a c/aintr= 0.62. This indicates that the measurement
uncertain-ties are indeed an important contribution, but they do not dom-inate the result. An additional caveat we face in this analysis is the obstruction of the Milky Way disk. In our dwarf galaxy survey (Müller et al. 2015, 2017a), we limited our survey area at δ ≈ −45 deg due to the increasing contamination of Galac-tic cirrus and the number of stars; however, several of the plane members (Tully et al. 2015) are outside of this area at roughly δ ≈ −50 deg. The survey footprint thus limits the extent along the plane direction and thus biases toward less extreme flatten-ing because it could potentially cut-off a part of the plane. In
other words, the structure could be more extended than what we observe here. The SCABS survey footprint (Taylor et al. 2016, 2017, 2018) should overlap with this region and shed new light on the distribution of satellites there. In addition, the new dwarf galaxy, confirmed with SBF (Müller et al, in preparation), lies in a region of the sky where further dwarf candidates await follow-up measurements. In principle, some of them could lie in the plane-of-satellites as this recently discovered dwarf galaxy. Therefore, a final conclusion about the overall flattening cannot be drawn as long as we still lack distance information for many of the dwarf candidates.
-1
-0.5
0
0.5
1
CaX [Mpc]
-1
-0.5
0
0.5
1
CaZ [Mpc]
Fig. 13. Edge-on view of Centaurus group in Centaurus A centered coordinate system according to Tully et al. (2015), where CaZ corre-sponds to normal of plane. The two large dots correspond to Cen A and NGC 4945, the small ones to the dwarf galaxies with measured dis-tances (black for the previously known dwarfs, red for the new dwarfs from this study and from Crnojevi´c et al. 2019, and yellow for the new dwarf of Müller et al. (in preparation), based on SBF). The lines indicate the distance uncertainties.
7. Summary and conclusion
TheΛCDM small-scale crisis in the Local Group motivates the study of satellite systems in other groups of galaxies. One of our closest neighbors, Cen A, provides a unique opportunity for such studies because it is close enough to accurately determine the distance of its satellite members. In Müller et al. (2015, 2017a), we found 58 possible dwarf galaxy candidates in a 500 square degree field around Cen A. Here, we present deep V I band follow-up observations with FORS2 at the VLT for 15 of these candidates and confirm nine to be members of Cen A thanks to their resolved stellar populations. For the confirmed members, we employed a Bayesian approach to accurately mea-sure the tip of the red giant branch and derive distances with a typical accuracy of 5%. We also fit theoretical isochrones to the color-magnitude diagrams to estimate the mean metallic-ity of each dwarf. As expected, the confirmed satellites follow the scaling relations (surface brightness, luminosity-effective radius, and luminosity-metallicity) defined by the Lo-cal Group dwarfs. Our photometric precision is not sufficient to detect metallicity spread in individual galaxies. This could ei-ther mean that ei-there is simply no metallicity spread, which is an