HAL Id: hal-02919310
https://hal.archives-ouvertes.fr/hal-02919310
Submitted on 22 Aug 2020
HAL is a multi-disciplinary open access
archive for the deposit and dissemination of
sci-entific research documents, whether they are
pub-lished or not. The documents may come from
teaching and research institutions in France or
abroad, or from public or private research centers.
L’archive ouverte pluridisciplinaire HAL, est
destinée au dépôt et à la diffusion de documents
scientifiques de niveau recherche, publiés ou non,
émanant des établissements d’enseignement et de
recherche français ou étrangers, des laboratoires
publics ou privés.
A star-forming dwarf galaxy candidate in the halo of
NGC 4634
Y. Stein, D. J. Bomans, P. Kamphuis, E. Jütte, M. Langener, R.-J. Dettmar
To cite this version:
Y. Stein, D. J. Bomans, P. Kamphuis, E. Jütte, M. Langener, et al.. A star-forming dwarf galaxy
candidate in the halo of NGC 4634. Astronomy and Astrophysics - A&A, EDP Sciences, 2018, 620,
pp.A29. �10.1051/0004-6361/201731304�. �hal-02919310�
https://doi.org/10.1051/0004-6361/201731304 c ESO 2018
Astronomy
&
Astrophysics
A star-forming dwarf galaxy candidate in the halo of NGC 4634
Y. Stein
1,2, D. J. Bomans
2, P. Kamphuis
2,3, E. Jütte
2, M. Langener
2, and R.-J. Dettmar
21 Université de Strasbourg, CNRS, Observatoire Astronomique de Strasbourg, UMR 7550, 67000 Strasbourg, France
e-mail: [email protected]
2 Astronomisches Institut (AIRUB), Ruhr-Universität Bochum, Universitätsstrasse 150, 44801 Bochum, Germany 3 National Centre for Radio Astrophysics, TIFR, Ganeshkhind, Pune 411007, India
Received 2 June 2017/ Accepted 24 July 2018
ABSTRACT
Context. The halos of disk galaxies form a crucial connection between the galaxy disk and the intergalactic medium. Massive stars, Hii regions, or dwarf galaxies located in the halos of galaxies are potential tracers of recent accretion and/or outflows of gas, and are additional contributors to the photon field and the gas phase metallicity.
Aims. We investigate the nature and origin of a star-forming dwarf galaxy candidate located in the halo of the edge-on Virgo galaxy NGC 4634 with a projected distance of 1.4 kpc and a Hα star formation rate of ∼4.7 × 10⁻³M
yr−1in order to increase our
under-standing of these disk-halo processes.
Methods. With optical long-slit spectra we measured fluxes of optical nebula emission lines to derive the oxygen abundance 12+ log(O/H) of an Hii region in the disk of NGC 4634 and in the star-forming dwarf galaxy candidate. Abundances derived from optical long-slit data and from Hubble Space Telescope (HST) r-band data, Hα data, Giant Metrewave Radio Telescope (GMRT) Hi data, and photometry of SDSS and GALEX data were used for further analysis. With additional probes of the luminosity–metallicity relation in the B-band from the Hα-luminosity, the Hi map, and the relative velocities, we are able to constrain a possible origin of the dwarf galaxy candidate.
Results. The high oxygen abundance (12+ log(O/H) ≈ 8.72) of the dwarf galaxy candidate leads to the conclusion that it was formed from pre-enriched material. Analysis of auxiliary data shows that the dwarf galaxy candidate is composed of material originating from NGC 4634. We cannot determine whether this material has been ejected tidally or through other processes, which makes the system highly interesting for follow up observations.
Key words. galaxies: abundances – galaxies: individual: NGC 4634 – galaxies: dwarf – galaxies: kinematics and dynamics – galaxies: interactions
1. Introduction
Star formation in spiral galaxies usually takes place close to the midplane of the disk. Nevertheless, star formation high above the midplane is detected in the Milky Way and in exter-nal galaxies. Extraplanar Hii regions indicate an exchange of matter between the disk and the halo, for example NGC 3628 and the Virgo cluster galaxy NGC 4522 (Stein et al. 2017) as well as NGC 4402 (Cortese et al. 2004). Some extraplanar Hii regions are related to the intracluster or intergalactic medium of interacting galaxies. These Hii regions probably formed in tidal debris (Mendes de Oliveira et al. 2004;Ryan-Weber et al. 2004) or by ram pressure stripping, for example in the Virgo cluster (Gerhard et al. 2002; Oosterloo & van Gorkom 2005). Under-standing the physical processes in interacting systems, groups, or clusters is essential to understanding galaxy evolution.
Additionally, dwarf galaxies are apparent in external galaxy groups (e.g., Müller et al. 2015) and in the Local Group (e.g.,
Mateo 1998). Based on their optical appearance, dwarf galax-ies are classified into different categories. Mainly, they are divided into star-forming dwarf galaxies with gas, which are interesting to study as analogs for galaxies in the early Uni-verse (e.g.,Vaduvescu et al. 2007); intermediate types with lit-tle star formation and less gas (e.g.,Sandage & Hoffman 1991); and non-star-forming dwarf galaxies with just a little gas, which appear like small elliptical galaxies (e.g.,Binggeli et al. 1994).
Furthermore, stellar/gaseous tidal debris might recondense within the halo of a merger and form a tidal dwarf galaxy (TDG), e.g., due to local gravitational instabilities in the gaseous compo-nent (Duc et al. 2000). As they are born in situ, their stellar popu-lations are young in comparison to those in normal dwarf galax-ies. TDGs can serve as a laboratory for star formation studies in low-density environments (Boquien et al. 2009). The building material of TDGs used to belong to a larger parent galaxy and is chemically pre-enriched compared to normal dwarf galaxies (Duc 2012); i.e., in comparison to dwarf galaxies, TDGs do not follow the luminosity–metallicity relation (L-Z relation).
Here, we investigate the case of a dwarf galaxy candi-date detected byRossa et al.(2008) close to the edge-on spiral galaxy NGC 4634. It is located at a projected distance of 1.4 kpc from the NGC 4634 midplane. NGC 4634 is a Virgo Cluster member with enhanced star-forming activity and a neighbor-ing galaxy of NGC 4633. NGC 4634 has a distance of 19.1 Mpc (Teerikorpi et al. 1992) and it is 2.60× 0.70in size. The
dynam-ical galaxy mass is 2.7 × 10¹⁰M (Rossa et al. 2008). Its Hii
regions in the disk are widely spread throughout the midplane. This could be due to the interaction with NGC 4633 as the two galaxies are a close binary pair (Oosterloo & Shostak 1993;
Rossa & Dettmar 2000). The halo shows diffuse X-ray emission (Tüllmann et al. 2006) and has a bright diffuse ionized gas com-ponent (Rossa & Dettmar 2000).
NGC 4634 was part of a large sample of Hα observa-tions performed by Rossa & Dettmar (2000), who searched systematically for extraplanar diffuse ionized gas (DIG). Among several extraplanar Hii regions an extraordinary emission patch was detected in NGC 4634, which showed, in contrast to the other regions, a distributed stellar population in addition to higher Hα emission.
The authors argued that it could be either part of the DIG or a dwarf galaxy in the halo of NGC 4634. Further study by
Rossa et al. (2008), which is based on the R-band morphology, suggests that this emission patch is a gas-rich dwarf irregular galaxy that has been tidally disrupted by the gravitational forces of NGC 4634. However, this study only used optical imaging, and thus the kinematical state and metallicity of the dwarf galaxy candidate have not been taken into account.
We further analyze and investigate the origin of this pecu-liar object, which we refer to as the dwarf galaxy candidate of NGC 4634, by using various data. We present optical long-slit spectroscopic observations with ESO Faint Object Spectrograph and Camera (v.2; EFOSC2) attached to the ESO 3.6 m Tele-scope, Hubble Space Telescope (HST) r-band and Hα data, and Giant Metrewave Radio Telescope (GMRT) Hi data. We also use photometry of SDSS and GALEX data.
The paper is structured as follows. The data reduction and observational strategy of the different observations are presented in Sect. 2. The analysis and the results of the optical spec-troscopy and the other data are described in Sect.3. In Sect.4
the results are discussed, and in Sect.5the paper is briefly sum-marized.
2. Data
2.1. Long-slit spectroscopic data
The spectroscopic data were obtained at the ESO La Silla obser-vatory with EFOSC2 attached to the 3.6 m Telescope during the nights of 7–9, March 2000. A 2048 × 2048 CCD detector with a pixel size of 15 µm was used. The field of view is 5.40× 5.40with a pixel scale of 0.31600pixel−1. With the two different grisms #7
(3270–5240 Å) and #9 (4700–6700 Å) we were able to detect the important lines in the optical. The slit had a length of 50and a width of 100. The seeing varied between 0.7100 and 0.7400 (see
Table2). The total integration time was split into two exposures of 20 min in each grism (see Table1). In Fig.1the slit position with a position angle of 92◦ is shown superimposed on an Hα image of NGC 4634.
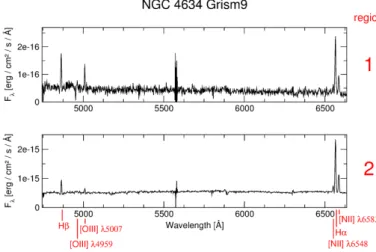
The data reduction was carried out using the image reduction and analysis facility (IRAF;Tody 1986,1993). This includes the corrections of bias and overscan, response, and cosmic rays with L. A. Cosmic (van Dokkum 2001). Additionally, the wavelength calibration was obtained by observing the available helium-argon lamp and the flux was calibrated by observing the standard stars (EG274 and LTT2415). In order to exclude all emission not originating from the Hii regions, night sky background emission close to the regions was averaged and subtracted with the IRAF task background. This procedure left some residuals at 5580 Å in the grism 9 spectrum of NGC 4634. To correct later for stel-lar absorption the spectra were coadded before the continuum subtraction. The resulting spectra of the two regions are shown in Figs.2and3. Our spectra contain strong emission lines like the Balmer lines, [OII] λλ3726, 3729, [OIII] λλ4959, 5007, and [NII] λλ6548, 6583. Due to the spectral resolution the lines of [OII] λ3726.0 and [OII] λ3728.8 were blended and therefore we use the sum of the doublet lines.
2.2. HST imaging
NGC 4634 was observed with the Advanced Camera for Surveys (ACS) at HST as part of program #10416 (PI: Rossa) in the HST-ACS r-band (F625W) and the Hα filter (F658N) using the the Wide Field Channel (WFC) for 2308s and 6888s, respectively. Earlier results from the program were reported by Rossa et al.
(2008,2012), andDettmar et al.(2010). We retrieved the imag-ing data for NGC 4634 from the Space Telescope Science Insti-tute (STScI) HST archive, using on-the-fly reprocessing using the latest calibration files. The pipeline included the new, improved treatment of charge transfer efficiency (CTE) correction, and driz-zling the subexposures to cosmic-ray cleaned, astrometrically improved image, as discussed in the ACS Data handbook V9.0 (Lucas & Desjardins 2018). The pipeline processed and dizzled final images of both filters F625W and F658N were then aligned to subpixel accuracy using IRAF tasks (imexamine, imcentroid, imshift) with several stars in the ACS field. The F625W image is used as a continuum image to correct the Hα emission in the F658N filter for its residual continuum. The fluxes of the Galac-tic foreground stars were used to determine an empirical scaling factor between the F625W and F658N fluxes, which we used to rescale the continuum image to the line plus continuum image. Subtracting the thus scaled F625W image from the F658N image yields a pure narrow line image representing the Hα emission plus some contribution from the [NII] lines, which is also included in the filter band at the given redshift of NGC 4634. Due to the possibility of a slight difference of the continuum slope of the Galactic foreground stars and the continuum emission of the stel-lar disk, we interactively changed the scaling factor around the starting value given by the Galactic stars in order to find the best value. This best value was considered to be the scaling fac-tor that removed the stellar continuum emission of the disk of NGC 4634 from the F658N image without creating regions of negative residuals. It was determined by optically inspecting the corrected image. The optimal value of the scaling factor turned out to be only 2% lower than the formal scaling factor derived from the foreground stars, showing that the above-mentioned effect of the color difference between the foreground stars and the inte-grated color of the stellar disk of NGC 4634 is very small. The uncertainty of the scaling factor is even below the value quoted above since applying the “formal” value still left noticeable con-tinuum artifacts in the disk. The uncertainty of the scaling param-eter (and therefore the stellar continuum flux) is in this case less important than the intrinsic calibration uncertainty using the broadband image, as discussed for ground-based images by, e.g.,
Gil de Paz et al.(2003).
Flux calibration of the narrowband image was then per-formed using the PHOTFLAM keyword, as outlined in the ACS data handbook V9.0 (Lucas & Desjardins 2018). Using a broad-band image for the continuum subtraction is not ideal since the line emission contributes weakly to the broadband filter, but it is a standard method that still yields well-calibrated line images (see, e.g., Gil de Paz et al. 2003). Photometry of the resolved sources was done with DAOPHOT using the aperture photome-try task and directly calibrated to point sources with photomephotome-try in the HST Source Catalog V1 (Whitmore et al. 2016).
2.3. GMRT data
In May 2013 NGC 4634 and its companions were observed for 5.5 h with the GMRT. To calibrate the flux and the bandpass, 3C286 was observed for 15 min at the start and the end of the run and 1264+116 was observed every 30 min in order to calibrate
Table 1. Basic parameters of NGC 4634.
Galaxy RA (J2000) Dec (J2000) Hubble type v (km s−1) D (Mpc) i (◦) PA (◦) Size Galaxy mass (M )
(1) (2) (3) (4) (5) (6) (7) (8) (9)
NGC 4634 12h42m40.9sa 14◦1704500a SBcdb 221c 19.1 ± 0.2d 83e 155 2.60× 0.70c 2.7 × 10¹⁰c
Notes. Columns: (1) Right ascension and (2) Declination, (3) Hubble type, (4) radial velocity, (5) distance, (6) inclination, (7) position angle, (8) major axis × minor axis, and (9) total galaxy mass.
References.(a)NASA/IPAC Extragalactic Database (NED,https://ned.ipac.caltech.edu),(b)de Vaucouleurs et al.(1991),(c)Rossa et al.
(2008),(d)Teerikorpi et al.(1992),(e)Tüllmann et al.(2006).
Table 2. Observational data.
Filter Wavelength tint(s) Seeing (00) AM PA (◦)
(1) (2) (3) (4) (5) (6)
Long-slit spectroscopy ESO 3.6 m Telescope grism 7 3270–5240 Å 2 × 1200 0.74 1.41 92 grism 9 4700–6700 Å 2 × 1200 0.71 1.40 92
HubbleSpace Telescope Hα 6562.82 Å 6888 – –
HubbleSpace Telescope r-band 5446–7100 2308 – –
Giant Meter Radio Telescope HI 21 cm 19700 – –
Notes. Columns: (1) Filter, (2) wavelength range or central wavelength, (3) integration time, (4) seeing, (5) airmass, and (6) position angle of the long slit.
Fig. 1.Slit position on the HST Hα image of NGC 4634. Indicated in red (see inset) are the regions of interest.
Fig. 2.Spectra of grism 7.
Fig. 3.Spectra of grism 9.
the phases throughout the run. The correlator was set up with 4 MHz bandwidth and 512 channels centered at 1419.3 MHz.
The data were reduced with a range of data reduction pack-ages. The raw data, in lta format, is first converted into a fits file through the use of listscan (v2.0) and gvfits (v2.0) as provided by the observatory. The produced fits file is then loaded into the data reduction package MIRIAD (Sault et al. 1995) where RFI is flagged in an automated manner. The data are then further flagged and calibrated through the use of the package FLAGCAL (v0.989;
Chengalur 2013). After this initial calibration the data is loaded into CASA (McMullin et al. 2007). We first visually inspect all the baselines for any residual RFI and then self-calibrate the data through the standard CASA procedures. After the self-calibration we subtract the continuum in the uv-plane from the dataset with UVCONTSUB by fitting polynomials of order one. The 8.1 kHz channels were combined into 24.3 kHz channels with the task SPLIT, and TCLEAN was used to transform the visibilities into a data cube. The visibilities were weighted according to a Briggs weighting scheme with Robust= 0. The dirty cubes were cleaned
with the TCLEAN multiscale clean algorithm, at scales corre-sponding to 1 and 4 beams. The cleaning was performed in an iterative process where we first cleaned the cube to a threshold of 6σ, created a mask with SoFiA (Serra et al. 2015) and then cleaned within this mask to 0.5σ. This procedure was followed until successive iterations showed no changes, while all the emis-sion visible was captured in the mask.
We constructed different cubes, one with a uv taper of 7 kλ and one with a taper of 20 kλ. This resulted in two cubes with a channel width of 5.2 km s−1, one with a Gaussian beam FWHM of 1800× 1700 and one with a resolution of FW H M= 600× 500.
Additionally, a Hanning smoothed version of the high-resolution cube with a velocity resolution of 10.4 km s−1was created.
3. Analysis and results
3.1. Long-slit spectra
3.1.1. Emission line measurement
We analyzed two Hii regions from the long-slit spectra (see Fig.1). The first region is called the Hii region (1); it is in the halo of NGC 4634, which is associated with the dwarf galaxy candidate. The second region is called the disk Hii region (2), and lies in the disk of NGC 4634.
The spectra (Figs. 2 and3) were analyzed via the splot task of IRAF. We chose the size of the extraction area of the dwarf galaxy candidate’s Hii region (1) and disk Hii region (2) of NGC 4634 depending on the extent of their Hα emission along the spatial axis in the spectra. The identified emission lines are marked red in Figs.2and3. The emission line fluxes were mea-sured with the deblending tool within the splot task of IRAF. With the Gaussian fit function we measured fluxes and central peak positions.
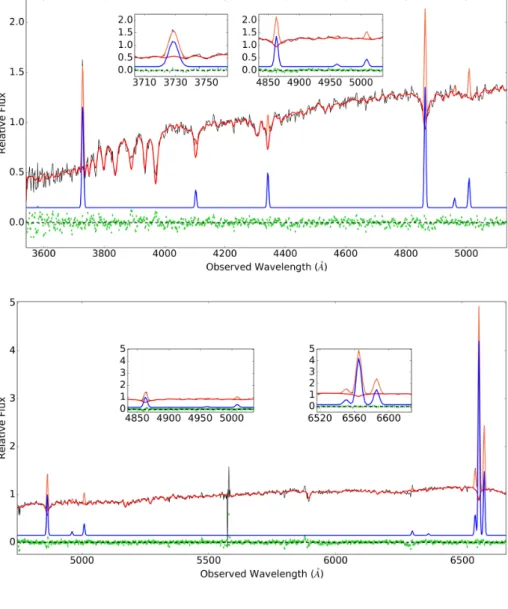
3.1.2. Stellar absorption correction and extinction correction Absorption lines of the underlying stellar populations can have an influence on the measurement of emission lines, especially the Balmer lines. Therefore, we investigated this effect in our spectra. We identified strong underlying stellar continuum includ-ing absorption in the disk Hii region (2) of NGC 4634. A lit-tle stellar continuum is visible in the dwarf galaxy candidate’s Hii region (1). To correct for this effect we adopted pPXF fit-ting (Cappellari & Emsellem 2004;Cappellari 2017; upgrade; see Figs.5and6). To account for internal extinction the absorption corrected fluxes of the disk Hii region (2) were dereddened with the IRAF task redcorr. For this we used the theoretical Balmer decrement of Hα/Hβ = 2.86 (Case B, 10 000 K) and the Galactic extinction law (Savage & Mathis 1979). In the dwarf galaxy can-didate the measured flux ratio of Hα to Hβ is 2.86. As this is equal to the theoretical Balmer decrement we did not correct for absorp-tion and did not deredden Hii region (1). The Hβ fluxes and the dereddened scaled fluxes relative to Hβ are listed in Table3. 3.1.3. Heliocentric velocities
The velocities of both Hii regions were determined with the red-shifts of the [OIII] λ5007 line, which was bright and closest to the center of grism 9 where the wavelength calibration is most reliable. The heliocentric correction was calculated by the IRAF task rvcorrect.
The resulting heliocetric velocity (Table 3) of the dwarf galaxy candidate’s Hii region (1) is similar to that of the Hii
1
Fig. 4.DSS B image of NGC 4634.
region (2) of the galaxy, around 160 km s−1. Comparing the
determined heliocentric velocities with our velocity map helio-centric velocities we find that they are consistent with those derived from the Hi (Fig.14, see Sect.3.5).
3.2. HST r-band and continuum-corrected Hα images With the r-band (F625W) and corrected Hα images (Figs.7–9) observed by the HST we are able to analyze the galaxy and the dwarf galaxy candidate visually.
The HST F625W image of NGC 4634 (Fig. 7) shows an elongation from the major axis, especially to the south and north. This is probably due to tidal interaction with NGC 4633. The galaxy pair is shown in Fig.4.
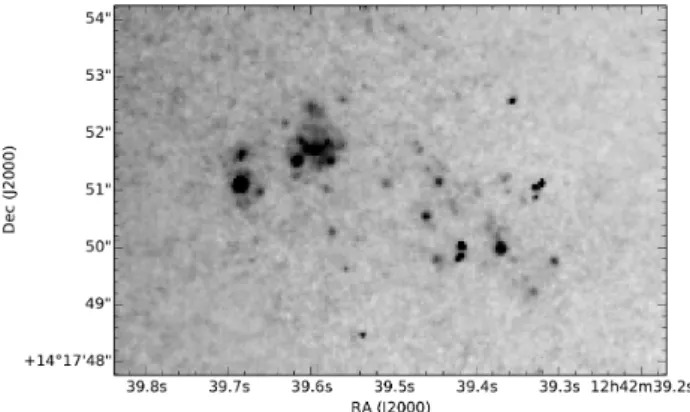
Figure 8shows the subarea of the ACS image centered on the dwarf galaxy candidate. Most of the Hα emission orig-inates from the Hii region (1) to the east. This Hii region seems to have a bubble structure. Nevertheless, there is dif-fuse Hα spread over the whole dwarf galaxy candidate. The dwarf galaxy candidate has a projected distance to the plane of 1.4 kpc at the distance of NGC 4634. This was determined as the distance from the galaxy’s midplane (defined by the cen-tral line from the Hα image) to the dwarf galaxy candidate’s Hii region (1). Its main Hα emission in Fig. 8 has a diameter of 100≈ 90 pc, including the diffuse emission and the stars the diameter increases to 600≈ 550 pc. The F625W image (Fig.9)
shows an elongated body pointing roughly perpendicular toward the disk of NGC 4634. The continuum image is partly resolved into point sources, which are especially visible at the location of the bubble-like Hii emission region (see Fig.8). The stars to the southwest are not foreground stars but can clearly be related to the dwarf galaxy candidate.
3.3. Hα-luminosity and star formation of the dwarf galaxy candidate
The integrated Hα-flux (IHα) of the dwarf galaxy candidate’s
Hii region (1) was determined via aperture photometry on the Hα-image (Fig.8). With IHα = (1.7 ± 0.5) × 10−14erg s−1cm−2
we computed the luminosity and the number of photons pro-duced per second following theOsterbrock(1989) case B with a
Fig. 5. pPXF spectrum of disk Hii region (2) in grism 7. The black line represents the observed spectrum; the orange line shows the emission lines fitted by pPXF to the observed spectrum. The blue line is the extracted pure emission line spectrum; the red line is the fitted continuum to the data; the green dots are the residuals around the zero value (gray dashed line).
Fig. 6. pPXF spectrum of disk Hii region (2) in grism 9. The black line represents the observed spectrum; the orange line shows the emission lines fitted by pPXF to the observed spectrum. The blue line is the extracted pure emission line spectrum; the red line is the fitted continuum to the data; the green dots are the residuals around the zero value (gray dashed line).
temperature of 104K:
LHα= (7.5 ± 2.2) × 1038erg s−1 (1)
Q(H0, T )Hα = (2.7 ± 0.8) × 1050photons s−1 (2)
To calculate the Lyman-α photons from this we multiply by a factor of 2.2 (Hummer & Storey 1987). The final number of pho-tons is then
Q(H0, T )Lyα = (6.0 ± 1.8) × 1050photons s−1. (3)
According toPanagia(1973) several O4 stars or hundreds of B0 stars are able to produce this amount of photons. Additional stars around the Hii region are visible in the R-band image (Fig.9).
We determined the corresponding Hα star formation rate fromKennicutt(1998):
SFR= 7.9 × 10−42LHα(erg s−1)= (4.7 ± 1.4) × 10−3M yr−1
(4) 3.4. Stellar populations and stellar mass
The dwarf galaxy candidate is not only visible in our HST images, but it is also present on the blue SDSS images (filters u’, g’, and r’) of NGC 4634 and the Galaxy Evolution Explorer (GALEX) far-UV (FUV) and near-UV (NUV) images. Interest-ingly, the dwarf galaxy candidate is absent on the red SDSS
images (filters i’ and z’) and in the near-infrared images from UKIRT Infrared Deep Sky Survey (UKIDSS) in the J, H, and Kfilters. A marginal detection in the Y filter coincides with the brightest knot in Hα and may therefore be caused by the emis-sion of the [SIII] λ9512 line, which is the brightest HII emisemis-sion line in the Y filter.
We performed aperture photometry on the SDSS and GALEX images, through apertures with radius of 3.200and 5.300,
respectively, centered on the GALEX FUV emission. The SDSS photometry was directly calibrated by comparison to the nearest isolated star. For the GALEX flux we picked a more distant star to ensure a solid measurement in the FUV filter. For the K filter of UKIDSS we derived an upper limit. The derived magnitudes are listed in Table3.
With the distance modulus of m−M = 31.4 mag and assum-ing no extinction, we calculated the absolute magnitudes in B-band (MB) and in R-band (MR) of the dwarf galaxy
candi-date using the SDSS magnitudes and the conversion relations by Lupton 20051, which are also useable for galaxies, according
to the notes of the SDSS web page. Based on the conversion relation we get MB = −10.76 and MR = −10.87. The blue
col-ors (both in the optical and the UV) of the dwarf galaxy candi-date reflect its ongoing star formation and hints at a lack of a detectable intermediate or old stellar population.
1 https://www.sdss3.org/dr10/algorithms/
Table 3. Results from optical long-slit spectroscopy, magnitudes from different filters and oxygen abundances of the dwarf galaxy candidate (1) and one Hii region of NGC 4634 (2).
Region 1 2 Hβ [10−16erg cm−2s−1] 6.53 ± 0.94 2.07 ± 0.70 [OII] λλ 3726, 3728/Hβ 2.38 ± 0.45 1.27 ± 0.24 [OIII] λ4959/Hβ 0.15 ± 0.04 – [OIII] λ5007/Hβ 0.60 ± 0.10 0.35 ± 0.06 [NII]/Hβ 0.45 ± 0.07 0.30 ± 0.05 Hα/Hβ 2.86 ± 0.31 2.86 ± 0.31 [NII]/Hβ 1.13 ± 0.17 1.00 ± 0.15 c 0.00 0.38 vhelio[km s−1] 166 ± 23 161 ± 23 MB –10.76 ± 0.15 MR –10.87 ± 0.15 SDSS u’ [mag] 21.01 ± 0.10 SDSS g’ [mag] 20.82 ± 0.12 SDSS r’ [mag] 20.66 ± 0.15 GALEX FUV [mag] 19.67 ± 0.25 GALEX NUV [mag] 19.91 ± 0.20 UKIDSS K [mag] <20.7 log(L(Hα)) [erg s−1] 38.88 ±0.16
log(SFRHα) –2.33 ± 0.13
12+ log(O/H)
Kewley & Dopita(2002) 8.99 ± 0.04 9.08 ± 0.04
Pilyugin et al.(2014) 8.51 ± 0.13 8.62 ± 0.11
Pettini & Pagel(2004) 8.67 ± 0.16 8.73 ± 0.15
Mean 8.72 ± 0.11 8.81 ± 0.10
Using the GALEX fluxes and the calibration of Lee et al.
(2009) we estimated the star formation rate from the UV stel-lar continuum to be SFR= 1.0 ± 0.1 × 10⁻³M
yr−1, a factor of 5
lower than the Hα derived star formation rate. Since the GALEX UV bands also probe stars somewhat older than hydrogen ionizing stars, this may imply that the star formation rate of the dwarf galaxy candidate is currently higher than ∼100 Myr ago.
Using the equation inBell et al.(2003) for the SDSS bands from their Table 7, we calculate the mass-to-luminosity ratio for r’-band with the u’ and g’ filters,
log(M/L)r= −0.99 + (0.345 · (u0− g0)= −0.033, (5)
which leads to M/L = 0.9 ± 0.1. With the absolute magnitude from r-band we get L = 1.5 × 10⁶L , and from that a stellar
mass of 1.35 × 10⁶M .
Furthermore, no old stellar population seems to be present down to our detection limits with a 3σ level of mK =
20.7 mag from UKIDSS survey data (Lawrence et al. 2007). This implies an upper mass limit for the old stellar popula-tion (age < 1 × 10⁹yr) of 2.40 × 10³M
(based on SED modeling
with FAST,Kriek et al. 2009). We also note that the ACS F658W (HST r-band) shows only few point sources at the location of the tidal dwarf candidate, consistent with being blue supergiants and/or young clusters, and no extended low surface brightness, granular body consistent with significant mass in an old stellar population.
3.5. Oxygen abundance
To derive oxygen abundances, we used strong-line calibrations. There are different strong-line calibration types, empirical (e.g.,
Fig. 7.NGC 4634 F625W image, from HST/ACS, the box shows the region of Figs.8and9.
Fig. 8.Hα image of the dwarf galaxy candidate.
Pilyugin 2001; Pettini & Pagel 2004; Pilyugin et al. 2014) and theoretical (e.g.,Kewley & Dopita 2002;Kobulnicky & Kewley 2004), which show well-known offsets between 0.1 and 0.7 dex (Stasi´nska 2002; Modjaz et al. 2008; Moustakas et al. 2010). The metallicities were derived using the oxygen abundance 12+ log(O/H) by three different methods in order to have com-parable results:
– Kewley & Dopita(2002; theoretical calibration); – Pilyugin et al.(2014; empirical calibration); – Pettini & Pagel(2004; empirical calibration).
For further information, discussion, and the error analysis see
Stein et al.(2017).
The results of the abundance determination (Table3) show slightly lower but similar (within the errors) oxygen abundances of the dwarf galaxy candidate’s Hii region (1) in comparison to the disk Hii region (2) with each calibration.
Due to the known and here confirmed offsets between the different calibrations, which are in agreement with other anal-yses (Modjaz et al. 2008; Kewley & Ellison 2008), we use the
Fig. 9.F625W image of the dwarf galaxy candidate.
average of all three oxygen abundances of 12+ log(O/H) = 8.72 for the dwarf galaxy cadidate.
3.6. Luminosity–metallicity relation (L-Z Relation)
In order to determine whether the dwarf galaxy candidate was created from gas stripped from NGC 4634 or a dwarf galaxy in the process of being accreted, we use the well-defined relation-ship between the absolute B-band luminosity and the metallicity of galaxies known as the L-Z relation, which also applies to star-forming dwarf galaxies (e.g.,Richer & McCall 1995). This can be applied to the dwarf galaxy candidate in a straightforward manner. The metallicity was taken from our mean oxygen abun-dance of the dwarf galaxy candidate of 12+ log(O/H) = 8.72. The absolute luminosity in B-band (MB) was calculated from
SDSS aperture photometry on the u’, g’, and r’ images (see Sect.3.4).
To compare the calculated L-Z relation for the dwarf galaxy candidate we show in Fig.10the L-Z relation for five different datasets. The data of Richer & McCall(1995) of dwarf irreg-ular galaxies (dIs) are shown as red squares. The fit to that data byRicher & McCall(1995) is shown as the red line. The relation of the data of blue compact dwarfs (BCDs, blue tri-angles) fromZhao et al. (2010) is similar to the relation of the
Richer & McCall(1995) sample.
The location of the dwarf galaxy candidate of NGC 4634 is shown with the orange star. Clearly, the region analyzed here does not follow the relation of the dIs or the BCDs. We therefore use the data of TDGs fromDuc & Mirabel(1999; dark circles) and the data fromWeilbacher et al.(2003; green diamonds).
Figure 10 clearly shows that the abundance of the dwarf galaxy candidate falls within the trend of TDGs which is mainly due to its high oxygen abundance. As these galaxies are formed from the material of a larger interacting galaxy, they are enhanced in metallicity.
3.7. Hi data
The low-resolution Hi map (Fig. 13) shows an indication of a spur at the location of the dwarf galaxy candidate. In Fig. 14
the Hi velocity map is presented, which shows that the velocity at the location of the dwarf galaxy candidate coincides with the value determined from the spectrum and is also in line with the general rotation of the galaxy.
We show further channel maps of the high-resolution Hi-cube around 140 km s−1(Fig.11) and 220 km s−1(Fig.12). From these we see hints of an elongation of the Hi gas toward the
dwarf galaxy candidate. The gas connection to the disk is seen in the two different velocity intervals. In both cases this bridge is seen in four consecutive velocity channels (in Fig. 12 one channel is omitted). As the Hanning smoothed cube is shown, the velocity resolution is doubled (∼10 km s−1). Therefore the
bridge is visible in two independent channels. In Fig.11the Hi gas shows elongation perpendicular to the major axis of the disk of NGC 4634 clearly showing a disturbance in the Hi distribu-tion. The dwarf galaxy candidate is located in a dense spot of the Hi gas distribution but with a low level of significance.
3.8. Total mass of NGC 4634
We further determined the HI mass and dynamical mass of NGC 4634. We fit a simple tilted ring model to the galaxy using the Fully Automated TiRiFiC (FAT; Kamphuis et al. 2015). Visual inspection of the output model shows that the fit is reason-able. The heliocentric systemic velocity of NGC 4634 is found to be 115 km s−1. This deviates significantly from the value reported byOosterloo & Shostak (1993). However, a compari-son between their Table 2 and Fig. 4 shows immediately that their reported velocity values for NGC 4633 and NGC 4634 have been swapped in their Table2. Our value compares well to the systemic velocity reported for NGC 4633. The observed total flux in our GMRT observation is 3.9 Jy km s−1, which is
signifi-cantly less than values reported in the literature; for example, the Arecibo Legacy Fast ALFA Survey (Haynes et al. 2011) finds a total flux of 7.6 Jy km s−1. This indicates that our observations are not sensitive enough to detect low column density gas. This means that at a distance of 19.1 Mpc the total mass of the galaxy is in the range of 3.3–6.5 × 10⁸M
of Hi.
The FAT model shows a symmetric rotation curve which flat-tens off at ∼135 ± 9.8 km s−1. At the radius corresponding to a density of 1 M pc−2of 6.2 kpc (DHI= 134") this translates to a
total dynamical mass of 1.3 × 10¹⁰M .
4. Discussion
All important properties of the dwarf galaxy candidate based on the analysis done in this work are presented and discussed in this section.
4.1. Dwarf galaxy or star-forming patch
To classify faint star-forming objects with no information about the gas kinematics as a galaxy is not straightforward. Even some of the faint dwarf galaxies around the Milky Way cannot be con-firmed as galaxies by certain definitions of galaxies. Here we define a galaxy as a gravitationally bound collection of stars whose properties cannot be explained by a combination of baryons and Newton’s laws of gravity (seeWillman & Strader 2012). This def-inition includes a dark matter halo. This is not fulfilled automati-cally by TDGs, especially as there are observational hints which are supported by simulations that TDGs do not contain dark mat-ter or are deficient in dark matmat-ter (Duc 2012;Lelli et al. 2015). Therefore, we summarize the main characteristics of the dwarf galaxy candidate analyzed here, and if possible compare them with the known characteristics of dwarf galaxies, TDGs, and globular clusters to get hints on the classification.
In the spectra we see galaxy continuum at the location of the dwarf galaxy candidate’s Hii region. Its core size in Hα is about 90 pc in diameter, including the diffuse emission, and the star’s size is 550 pc in diameter. This is quite small for a dwarf galaxy, but too big for a usual globular cluster of a few pc in
Fig. 10. Luminosity–metallicity relation. The data point of the dwarf galaxy candidate is represented by the orange star. The data of Richer & McCall (1995) of dwarf irregular galaxies (dIs) are shown as red squares. The fit to that data byRicher & McCall (1995) is shown as the red line. The relation of the data of blue compact dwarfs (BCDs, blue tri-angles) is from Zhao et al. (2010). The data of TDGs fromDuc & Mirabel(1999) are rep-resented as dark circles, and the data from Weilbacher et al.(2003) as green diamonds.
Fig. 11.Individual channel maps of the Hanning smoothed high-resolution Hi cube. The contours are at –3, –1.5, 1.5, 3, 6, 12 × 0.62 mJy beam−1;
negative contours are dashed light gray.
the Milky Way (Harris 1996). Nevertheless, it is comparable to several dwarf galaxies in the Local Group (Mateo 1998).
The projected distance of the dwarf galaxy candidate to its host galaxy NGC 4634 is 1.4 kpc. This distance is quite small. The projected distance merely provides a lower limit, and the true distance between NGC 4634 and the dwarf galaxy candi-date could be higher. However, as they have similar velocities we expect them to have similar distances, and thus the true sep-aration between the dwarf galaxy candidate and NGC 4634 is not expected to be orders of magnitude larger than the projected distance.
The photometric analysis shows that the galaxy appears very young. As it is seen in the HST F625W and Hα images, the dwarf galaxy candidate is actively producing stars and contains already-formed stars. Comparing the computed Lyman-α pho-tons to Panagia(1973), a few O4 stars or several hundred B0 stars are able to produce the required number of photons. The number of log(L(Hα))= 38.88 ± 0.16 erg s−1 is, considering the low absolute B-band magnitude of MB= −10.76 mag, high
com-pared to local dwarf and TDGs analyzed byCroxall et al.(2009), where most dwarf galaxies comparable in the absolute flux show significantly lower Hα fluxes of log(L(Hα)) < 36.6 erg s−1.
The derived SFR from UV (1 ± 0.1) × 10−3M yr−1 is
rela-tively high compared, for example, to the dwarf irregular galaxy
DDO210 of the local group with MB= −10.76 mag and the
UV SFR= 1.58 × 10⁻⁴M yr−1fromLee et al.(2009). The
com-puted stellar mass of 1.35 × 10⁶M
is low in comparison to other
dwarf galaxies and tidal dwarfs (e.g., Kaviraj et al. 2012), but high for globular clusters (e.g.,Vanzella et al. 2017) placing the stellar mass of the dwarf galaxy candidates in the intermediate regime between dwarf galaxies and globular clusters.
The absolute B-band magnitude (–10.76 mag) is low in com-parison to the presented samples of other dwarf galaxies, which is probably a selection effect as faint objects are not detected easily. Nevertheless, in theRicher & McCall(1995) sample, one dwarf galaxy (GR 8) exists with a comparable MB. Furthermore,
it is comparable to faint Milky Way and local group dwarf galax-ies, as seen above.
With all this, the conclusion ofRossa et al. (2008) that the dwarf galaxy candidate is likely a galaxy might be true. Never-theless, like for other faint dwarf galaxies, the uncertainties of a galaxy classification are large (Willman & Strader 2012) and the close distance to NGC 4634 is still peculiar. With the data pre-sented here we cannot establish that it is gravitationally bound, let alone whether it is embedded in its own dark matter halo, and hence drawing a strong conclusion on the dwarf galaxy candi-date being a galaxy must be postponed until such data can be obtained.
Fig. 12.Individual channel maps of the Hanning smoothed high-resolution Hi cube. The contours are at –3, –1.5, 1.5, 3, 6, 12 × 0.62 mJy beam−1;
negative contours are dashed light gray.
Fig. 13. Hi map in low resolution. The beam is 1700× 1800 and is
shown in the lower left corner. A 4.3σ mask is applied with σ = 11.5 mJy beam−1.
4.2. Observational hints to the origin of the dwarf galaxy candidate
Because of the similar velocities of the dwarf galaxy candidate and the host NGC 4634 (from long-slit spectra and Hi), they seem to be coupled to each other. The mean oxygen abundance of the dwarf galaxy candidate of 8.72 is similar to that of the host galaxy NGC 4634. Comparing the L-Z relation of isolated dwarf galax-ies with the dwarf galaxy candidate of NGC 4634, it is obvious that they are not correlated. The dwarf galaxy candidate is located in the upper part due to a higher metallicity and seems to fol-low the correlation of TDGs. The elongation in the appearance of the dwarf galaxy candidate is perpendicular to the major axis of NGC 4634 in the DSS-image. This seems to be confirmed by the low-resolution Hi map where a tentative spur in the same direc-tion is visible. The high-resoludirec-tion channel maps show a dense spot at the location of the dwarf galaxy candidate. This leads to the conclusion that, whether it is a galaxy or not, the material from which the dwarf galaxy candidate was created came from the disk of NGC 4634 or is at least equally chemically enriched.
Fig. 14.Velocity map in low resolution. The beam is 1700
× 1800
and is shown in the lower left corner. The same mask as for the Hi map is used.
4.3. Possible origins of the dwarf galaxy candidate 4.3.1. Origin 1: Material from NGC 4634
The oxygen abundance of the extraplanar region is high in com-parison to other dwarf galaxies and comparable to the host galaxy NGC 4634. The position of the dwarf galaxy in the L-Z relation indicates that its material comes from NGC 4634. The analyzed dwarf galaxy candidate is located very close to NGC 4634 and seems to be young. This could be explained by two different scenarios pulling or pushing the material out of the midplane of NGC 4634 into the halo. This might be outflow driven or tidal.
Outflow driven. The region could be a star-forming region in the lower halo and no dwarf galaxy at all. The material orig-inating from NGC 4634 was expelled from the galaxy disk via outflow processes. The main process of outflow models is ther-mal pressure from supernova-driven energy, where SNe explo-sions shock heat the interstellar medium (ISM; e.g., Larson 1974). Nath & Shchekinov (2013) suggested that correlated supernovae from OB associations in molecular clouds in the
central region can drive powerful outflows. With the other components of the ISM also playing an important role, e.g.,
Samui et al. (2018) conclude that CR-driven outflows can go to a larger radii compared to a purely thermally driven out-flow with same total energy input. With the outout-flow scenario the expelled gas condenses in the halo and forms new stars. A simi-lar scenario in an AGN driven outflow was recently discussed by
Maiolino et al.(2017) for another galaxy. This scenario cannot be ruled out with the current data.
Tidal. The findings could be explained by a tidal dwarf scenario.Zwicky (1956) argued long ago that tidal forces can tear long tails of stars and gas from the bodies of interacting disk galaxies, and that this debris may include self-gravitating objects, which could become small galaxies. Numerical simula-tions of encounters between disk galaxies show that dwarf sys-tems can form in material that is drawn out during an encounter (e.g.,Barnes & Hernquist 1992).
The key element is that the building material of TDGs used to belong to a larger parent galaxy, and thus it is pre-enriched (Duc 2012). Therefore, dwarf means that the object born in tidal fea-tures should have the size and mass of a dwarf galaxy. In obser-vations that would imply that TDGs have inherited the metal content of interstellar medium from their parents. Their metal-licity tells about the past chemical enrichment of their parents, and is therefore not correlated with their actual mass, contrary to conventional galaxies. Additionally, their dust content and molecular gas content, as traced by CO, is higher than in reg-ular star-forming dwarf galaxies (Duc 2012).
The high oxygen abundance and the other characteristics of the dwarf galaxy candidate could be explained by the tidal dwarf scenario. It is therefore possible that the dwarf galaxy was formed in the spur as a result of tidal interactions with the neighboring galaxy, namely NGC 4633. However, the low-resolution Hi image of the NGC 4634 and NGC 4633 does not show any cold gas between the two galaxies. This might be due to sensitivity limits (1σ ∼ 3 × 1019cm2; see also Sect. 3.7);
a comparison between single-dish data (Haynes et al. 2011) and our GMRT observations indicates we are missing a sig-nificant amount of emission. However, both disks are clearly detected and show little to no signs of being disturbed. On the other hand, the F625W image (Fig. 7) shows clear signs of the stellar disk being disturbed, indicating past tions. Hence, NGC 4634 has clearly undergone recent interac-tion even though it remains unclear whether this was caused by NGC 4633.
Without more detailed kinematical information on the dwarf galaxy candidate it is impossible to distinguish between the two possible forces, outflow driven and tidal.
4.3.2. Origin 2: Dwarf galaxy
In hierarchical structure formation scenarios such asΛ cold dark matter (ΛCDM), it is expected that dwarf galaxies merge into big galaxies. Especially in the group environment of the Virgo cluster, this could be the case. Thus, the extraplanar region could also be a dwarf galaxy of the Virgo Cluster that is gravitation-ally coupled to NGC 4634, but not necessarily a tidal dwarf. The analysis performed here shows that, except for its metallicity, the structural parameters of the dwarf galaxy candidate are con-sistent with it being a dwarf galaxy (see discussion in Sect.4.1
and, e.g.,Misgeld et al. 2011for further comparisons). However, it is rather puzzling as to why the candidate should then have a metallicity comparable to NGC 4636. Could it be due to the cluster environment that both galaxies reside in, assuming there
is more interaction between galaxies and intermixing of the gas happening in a cluster environment? The argument against this comes from Lee et al. (2003), who concluded that at a given optical luminosity there is no systematic difference in oxygen abundance between a sample of Virgo star-forming dwarfs and a sample of nearby star-forming dwarfs. Therefore, this scenario is unlikely.
4.3.3. Origin 3: Gas cloud
The analyzed dwarf galaxy candidate could have been a cloud in the Virgo cluster. The material could originate from the outer part of galaxies torn by tidal forces in an interaction or ram pres-sure stripping as suggested for the Virgo clouds in Kent et al.
(2009). It furthermore could originate from gas clouds with very low star formation. This free floating gas would likely be metal poor, as the classical example of the Virgo HI cloud shows (Salzer et al. 1991). We expect then a relatively low oxygen abundance, which is not the case. In contrast to this, with the first origin of a cloud, the material would have comparable oxygen abundances to other galaxies in the cluster. We therefore cannot rule out for sure that the dwarf galaxy candidate originates from another galaxy of the Virgo Cluster. Nevertheless, the velocity map suggests that the velocity of the dwarf galaxy candidate is not disturbed and in line with the general rotation of NGC 4634, which would probably not be the case for an infalling gas cloud.
5. Summary and conclusion
In this paper we present multifrequency data of a dwarf galaxy candidate and its edge-on host NGC 4634. With optical long-slit spectra we calculate the oxygen abundances of one disk Hii region and of a dwarf galaxy candidate’s Hii region. The compa-rable oxygen abundances hint at the material of the dwarf galaxy candidate being pre-enriched and that it originates from the disk of NGC 4634. This is confirmed by its location in a L-Z diagram, which shows that its metallicity is much higher than expected for a dwarf galaxy that evolved in relative isolation. The images of r-band, B-band, and the Hα-luminosity show that the dwarf galaxy candidate is star forming and approximately 550 pc in diameter. The heliocentric velocities of the dwarf galaxy and its host NGC 4634 are similar and indicate that the galaxies are con-nected. The Hi data give the hint that a spur of NGC 4634 is located at the same position as the dwarf galaxy candidate. We furthermore determined the total dynamical mass of NGC 4634 to be 1.3 × 10¹⁰M from the GMRT data analyzed here.
With the above discussion one possible origin is the tidal dwarf scenario where the dwarf galaxy candidate formed in the spur of NGC 4634 from disk material. However, the data pre-sented in this paper cannot rule out other forces that separated the gas in the star-forming region from the disk of NGC 4634. In any case, it is clear that the halo of NGC 4634 contains a star-forming object of significant size that is formed from gas stripped from NGC 4634, which is an excellent laboratory for further studies in terms of galaxy evolution.
Acknowledgements. We thank the anonymous referee for the helpful and con-structive comments. Furthermore, we thank Pierre-Alain Duc for interesting discussions about this work. We thank Anika Beer for helping perform the pPXF. This research was suported in part by the DFG (German Research Foun-dation) research unit FOR1048. This research has made use of the “Aladin sky atlas” developed at CDS, Strasbourg Observatory, France, and has made use of IRAF, the NASA’s Astrophysics Data System Bibliographic Services, the GOLDMine Database, and the NASA/IPAC Extragalactic Database (NED) which is operated by the Jet Propulsion Laboratory, California Institute of
Technology, under contract with the National Aeronautics and Space Adminis-tration. This research has used data provided by the GALEX mission, the SDSS, and UKIDSS. GALEX is a NASA small explorer, launched in April 2003. It is operated for NASA by Caltech under NASA contract NAS5-98034. Funding for the Sloan Digital Sky Survey IV has been provided by the Alfred P. Sloan Foun-dation, the U.S. Department of Energy Office of Science, and the Participating Institutions. SDSS-IV acknowledges support and resources from the Center for High-Performance Computing at the University of Utah. The SDSS web site iswww.sdss.org. SDSS-IV is managed by the Astrophysical Research Con-sortium for the Participating Institutions of the SDSS Collaboration including the Brazilian Participation Group, the Carnegie Institution for Science, Carnegie Mellon University, the Chilean Participation Group, the French Participation Group, Harvard-Smithsonian Center for Astrophysics, Instituto de Astrofísica de Canarias, The Johns Hopkins University, Kavli Institute for the Physics and Mathematics of the Universe (IPMU)/University of Tokyo, the Korean Participa-tion Group, Lawrence Berkeley NaParticipa-tional Laboratory, Leibniz Institut für Astro-physik Potsdam (AIP), Max-Planck-Institut für Astronomie (MPIA Heidelberg), Max-Planck-Institut für Astrophysik (MPA Garching), Max-Planck-Institut für Extraterrestrische Physik (MPE), National Astronomical Observatories of China, New Mexico State University, New York University, University of Notre Dame, Observatário Nacional/MCTI, The Ohio State University, Pennsylvania State University, Shanghai Astronomical Observatory, United Kingdom Participation Group, Universidad Nacional Autónoma de México, University of Arizona, Uni-versity of Colorado Boulder, UniUni-versity of Oxford, UniUni-versity of Portsmouth, University of Utah, University of Virginia, University of Washington, University of Wisconsin, Vanderbilt University, and Yale University. The UKIDSS project is defined in Lawrence et al. (2007). UKIDSS uses the UKIRT Wide Field Camera (WFCAM;Casali et al. 2007). The photometric system is described in
Hewett et al.(2006), and the calibration is described inHodgkin et al.(2009). The pipeline processing and science archive are described in Irwin et al. (in prep.) andHambly et al.(2008).
References
Barnes, J. E., & Hernquist, L. 1992,Nature, 360, 715
Bell, E. F., McIntosh, D. H., Katz, N., & Weinberg, M. D. 2003,ApJS, 149, 289
Binggeli, B. 1994, in ESO Conf. and Workshop Proc., eds. G. Meylan, & P. Prugniel,49, 13
Boquien, M., Duc, P.-A., Wu, Y., et al. 2009,AJ, 137, 4561
Cappellari, M. 2017,MNRAS, 466, 798
Cappellari, M., & Emsellem, E. 2004,PASP, 116, 138
Casali, M., Adamson, A., Alves de Oliveira, C., et al. 2007,A&A, 467, 777
Chengalur, J. N. 2013,Flagcal: A flagging and calibration pipeline for GMRT data, Tech. Rep. NCRA/COM/001
Cortese, L., Gavazzi, G., Boselli, A., & Iglesias-Paramo, J. 2004,A&A, 416, 119
Croxall, K. V., van Zee, L., Lee, H., et al. 2009,ApJ, 705, 723
de Vaucouleurs, G., de Vaucouleurs, A., Corwin, H. G., Jr., et al. 1991, Sky Telesc., 82, 621
Dettmar, R.-J., Rossa, J., Dahlem, M., & van der Marel, R. 2010,Astrophys. Space Sci. Lib. Proc., 15, 161
Duc, P.-A. 2012,Astrophys. Space Sci. Lib. Proc., 28, 305
Duc, P.-A., & Mirabel, I. F. 1993,IAU Symp., 186, 61
Duc, P.-A., Brinks, E., Springel, V., et al. 2000,AJ, 120, 1238
Gerhard, O., Arnaboldi, M., Freeman, K. C., & Okamura, S. 2002,ApJ, 580, L121
Gil de Paz, A., Madore, B. F., & Pevunova, O. 2003,ApJS, 147, 29
Hambly, N. C., Collins, R. S., Cross, N. J. G., et al. 2008,MNRAS, 384, 637
Harris, W. E. 2015,VizieR Online Data Catalog: VII/195
Haynes, M. P., Giovanelli, R., Martin, A. M., et al. 2011,AJ, 142, 170
Hewett, P. C., Warren, S. J., Leggett, S. K., & Hodgkin, S. T. 2006,MNRAS, 367, 454
Hodgkin, S. T., Irwin, M. J., Hewett, P. C., & Warren, S. J. 2009,MNRAS, 394, 675
Hummer, D. G., & Storey, P. J. 1987,MNRAS, 224, 801
Kamphuis, P., Józsa, G. I. G., & Oh, S. H. 2015,Astrophysics Source Code Library[record ascl:1208.008]
Kaviraj, S., Darg, D., Lintott, C., Schawinski, K., & Silk, J. 2012,MNRAS, 419, 70
Kennicutt, R. C., Jr. 1998,ARA&A, 36, 189
Kent, B. R., Spekkens, K., Giovanelli, R., et al. 2009,ApJ, 691, 1595
Kewley, L. J., & Dopita, M. A. 2002,ApJS, 142, 35
Kewley, L. J., & Ellison, S. L. 2008,ApJ, 681, 1183
Kobulnicky, H. A., & Kewley, L. J. 2004,ApJ, 617, 240
Kriek, M., van Dokkum, P. G., Labbé, I., et al. 2009,ApJ, 700, 221
Larson, R. B. 1974,MNRAS, 169, 229
Lawrence, A., Warren, S. J., Almaini, O., et al. 2007,MNRAS, 379, 1599
Lee, H., McCall, M. L., & Richer, M. G. 2003,AJ, 125, 2975
Lee, J. C., Gil de Paz, A., Tremonti, C., et al. 2009,ApJ, 706, 599
Lelli, F., Duc, P.-A., Brinks, E., et al. 2015,A&A, 584, A113
Lucas, R. A., & Desjardins, T. 2018,ACS Data Handbook Version 9.0, Tech. rep., STScI Baltimore
Maiolino, R., Russell, H. R., Fabian, A. C., et al. 2017,Nature, 544, 202
Mateo, M. L. 1998,ARA&A, 36, 435
McMullin, J. P. Waters, B. Schiebel, D. Young, W., & Golap, K. 2007,ASP Conf. Ser., 376, 127
Mendes de Oliveira, C. Cypriano, E. S. Sodré, L., & Balkowski, C. 2004,IAU Colloq., 195, 450
Misgeld, I., Mieske, S., Hilker, M., et al. 2011,A&A, 531, A4
Modjaz, M., Kewley, L., Kirshner, R. P., et al. 2008,AJ, 135, 1136
Moustakas, J., Kennicutt, R. C., Jr., Tremonti, C. A., et al. 2010,ApJS, 190, 233
Müller, O., Jerjen, H., & Binggeli, B. 2015,A&A, 583, A79
Nath, B. B., & Shchekinov, Y. 2013,ApJ, 777, L12
Osterbrock, D. E. 1989,Astrophysics of Gaseous Nebulae and Active Galactic Nuclei(Mill Valley, CA: University Science Books)
Oosterloo, T., & Shostak, S. 1993,A&AS, 99, 379
Oosterloo, T., & van Gorkom, J. 2005,A&A, 437, L19
Panagia, N. 1973,AJ, 78, 929
Pettini, M., & Pagel, B. E. J. 2004,MNRAS, 348, L59
Pilyugin, L. S. 2001,A&A, 369, 594
Pilyugin, L. S., Grebel, E. K., & Kniazev, A. Y. 2014,AJ, 147, 131
Richer, M. G., & McCall, M. L. 1995,ApJ, 445, 642
Rossa, J., & Dettmar, R. 2000,A&A, 359, 433
Rossa, J., Dahlem, M., Dettmar, R., & van der Marel, R. P. 2008, ArXiv e-prints [arXiv:0804.3819]
Rossa, J., Dahlem, M., Dettmar, R. J., & van der Marel, R. P. 2012, inEAS Pub. Ser., ed. M. A. de Avillez,56, 221
Ryan-Weber, E. V., Putman, M. E., Freeman, K. C., Meurer, G. R., & Webster, R. L. 2004,IAU Symp., 217, 492
Salzer, J. J., di Serego Alighieri, S., Matteucci, F., Giovanelli, R., & Haynes, M. P. 1991,AJ, 101, 1258
Samui, S., Subramanian, K., & Srianand, R. 2018,MNRAS, 476, 1680
Sandage, A., & Hoffman, G. L. 1991,ApJ, 379, L45
Sault, R. J., Teuben, P. J., & Wright, M. C. H. 1995,ASP Conf. Ser., 77, 433
Savage, B. D., & Mathis, J. S. 1979,ARA&A, 17, 73
Serra, P., Westmeier, T., Giese, N., et al. 2015,MNRAS, 448, 1922
Stasi´nska, G. 2002, ArXiv e-prints [arXiv:astro-ph/0207500]
Stein, Y., Bomans, D. J., Ferguson, A. M. N., & Dettmar, R.-J. 2017,A&A, 605, A5
Teerikorpi, P., Bottinelli, L., Gouguenheim, L., & Paturel, G. 1992,A&A, 260, 17
Tody, D. 1986,Proc. SPIE, 627, 733
Tody, D. 1993,ASP Conf. Ser., 52, 173
Tüllmann, R., Breitschwerdt, D., Rossa, J., Pietsch, W., & Dettmar, R. 2006,
A&A, 457, 779
Vaduvescu, O., McCall, M. L., & Richer, M. G. 2007,AJ, 134, 604
van Dokkum, P. G. 2001,PASP, 113, 1420
Vanzella, E., Calura, F., Meneghetti, M., et al. 2017,MNRAS, 467, 4304
Weilbacher, P. M., Duc, P. A., Fritze, V., & Alvensleben, U. 2003,A&A, 397, 545
Whitmore, B. C., Allam, S. S., Budavári, T., et al. 2016,AJ, 151, 134
Willman, B., & Strader, J. 2012,AJ, 144, 76
Zhao, Y., Gao, Y., & Gu, Q. 2010,ApJ, 710, 663