HAL Id: hal-00688507
https://hal.archives-ouvertes.fr/hal-00688507
Submitted on 17 Apr 2012
HAL is a multi-disciplinary open access
archive for the deposit and dissemination of
sci-entific research documents, whether they are
pub-lished or not. The documents may come from
teaching and research institutions in France or
L’archive ouverte pluridisciplinaire HAL, est
destinée au dépôt et à la diffusion de documents
scientifiques de niveau recherche, publiés ou non,
émanant des établissements d’enseignement et de
recherche français ou étrangers, des laboratoires
Experimental study on the impact of ventilation
parameters on pollutants transfer from outdoor air into
a dwelling
Bernard Collignan, Jean-Paul Flori, Séverine Kirchner, Anne-Marie Laurent,
Yvon Le Moullec, Olivier Ramalho, Jean Georges Villenave
To cite this version:
Bernard Collignan, Jean-Paul Flori, Séverine Kirchner, Anne-Marie Laurent, Yvon Le Moullec, et
al.. Experimental study on the impact of ventilation parameters on pollutants transfer from outdoor
air into a dwelling. 22ND Annual AIVC Conference, Sep 2001, Bath, United Kingdom. 10 p.
�hal-00688507�
DDD ENEA/CVA 01-113C
MARKET OPPORTUNITIES FOR ADVANCED
VENTILATION TECHNOLOGY
22
NDANNUAL AIVC CONFERENCE
BATH, UNITED KINGDOM, 11-14 SEPTEMBER 2001
EXPERIMENTAL STUDY ON THE IMPACT OF VENTILATION
PARAMETERS ON POLLUTANTS TRANSFER FROM
OUTDOOR AIR INTO A DWELLING
Bernard COLLIGNAN
1, Jean-Paul FLORI
2, Séverine KIRCHNER
1,
Anne-Marie LAURENT
3, Yvon LE MOULLEC
3, Olivier RAMALHO
1,
Jean Georges VILLENAVE
11 Centre Scientifique et Technique du Bâtiment (CSTB), 24, av. Jean Jaurès. Champs-sur-Marne
B.P. 02 - 77421 Marne la Vallée Cedex 2, France
2 Centre Scientifique et Technique du Bâtiment (CSTB), 11, rue Henri Picherit
BP 82341 - 44323 Nantes Cedex 3, France
Synopsis
In urban areas, people stand the most of their time in indoor environment. In this context, indoor air quality is more and more a subject of concern. Outdoor air quality can have a large impact on indoor air quality. An experimental study has been conducted into a dwelling, in collaboration between the LHVP and the CSTB, in order to study the indoor concentration of pollutants depending on the outdoor pollution and the air renewal due to ventilation system.
Different experiments have been conducted in an empty dwelling situated in a polluted area in Paris during winter and summer periods. The measured pollutants were indoor and outdoor CO, SO2, NO, NO2, O3, VOC, PM2.5
particles and black smoke index. Additional measurements have been performed as meteorological conditions (wind speed and direction, external and internal temperature and humidity). The pollutants sampling time steps were comprised between two minutes and one hour depending on pollutant.
The transfer of the pollutants has been tested as regards different ventilation strategies. Air renewal of the dwelling was thus controlled : the dwelling has been air tight and the residual air leakage has been characterised using blower door and tracer gas technique. A mechanical ventilation system has been installed in the dwelling in order to have two controlled extract flows. During the summer experiments, measurements have also been carried out with opened windows.
This paper presents the impact of ventilation parameters on outdoor pollutants transfer.
The results of the study are the part of the outdoor pollution entering in the dwelling, versus the ventilation air renewal. On the basis of these experiments, we have also developed a methodology to assess the air renewal. W e adjust the air change rate by comparison between the indoor concentration measurements of carbon monoxide and calculations based on outdoor concentration measurements of carbon monoxide using computer code Siren2000.
1. Introduction
In urban areas, people stand the most of their time in indoor environment. In this context, indoor air quality is more and more a subject of concern. Outdoor air quality can have a large impact on indoor air quality. An experimental study has been conducted into a dwelling, in collaboration between the LHVP and the CSTB, in order to study the indoor concentration of pollutants depending on the outdoor pollution and the air renewal due to ventilation system.
Different experiments have been conducted in an empty dwelling situated in a polluted area in Paris during winter and summer periods. The measured pollutants were indoor and outdoor CO, SO2 (only in winter), NO, NO2, O3
(only in summer), VOC, PM2.5 particles and black smoke index. Additional measurements have been performed as
meteorological conditions : wind speed and direction, indoor and outdoor temperature and humidity. The sampling time steps were comprised between two minutes and one hour depending on pollutant.
The main objectives of this study were to analyse the impact of ventilation strategies, seasons, climate, the presence of absorptive surfaces and physical and chemical reactions, on the indoor concentration of pollutants depending on the outdoor pollution.
In this paper, we present the impact of ventilation parameters on outdoor pollutants transfer.
2. Preparation of the dwelling
The dwelling chosen for the experimentation is situated in Paris close to a busy street and not far from the ring road. The objectives were not to obtain very high levels of pollution but to have significant ones in order to be
able to measure the pollutant transfer phenomenon. Situated at the third floor of a 10 floors building built in 1955, the dwelling is about 55 square meters.
2.1 Initial state
At the initial state, the dwelling was naturally ventilated. During experiments, it was non occupied and empty in order to prevent any indoor pollutants sources and to be sure that indoor pollutant levels came from outdoor environment.
2.2 preparation of the dwelling
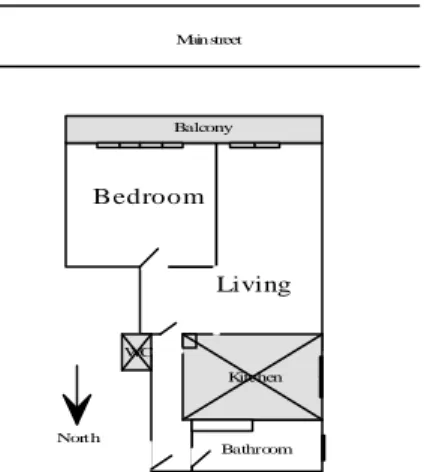
One objective of the study is to have the best control of air renewal in order to test different ventilation strategies. That is why, the dwelling has been air tight as well as possible and a mechanical ventilation has been installed as described below. Initially, The dwelling has two facade with windows. To simplify the experimentation, the western living room window has been blocked up. For the same reason the kitchen and toilets were airtight in order not to be considered as making part of the dwelling. The figure 1 shows the configuration of the dwelling considered for the experimentation.
Bedroom Living Kitchen WC Balcony Main street North Bathroom
Figure 1 : configuration of the dwelling at initial state
For the experimentation, indoor measurements has been conducted in the living and in the bedroom and outdoor ones on t he balcony. A meteorological station has also been installed on the roof of the 10 floors building.
2.3 Air leakage measurements
The dwelling has been characterised before and after its air leakage control. We used the technique of blowing door to make the dwelling in depression. We adapted this technique to the window of the bathroom. The final state of the dwelling corresponds to an air tightness of the main fortuitous leakage : windows, entrance door, traps, … The figure 2 shows the air tightness chara cterisation of the dwelling.
10 100 1000
10 100
Depression of the dwelling (Pa) Q (m3/h)
Initial state Final state
Figure 2 : Air tightness of the dwelling Initial state : Q = 29.5 ∆P0.66 Final state : Q = 4.3 ∆P0.79
The permeability level obtained once the dwelling as been airtight is considered very closed to the best recognised value asked for new buildings.
2.4 Installation of mechanical ventilation
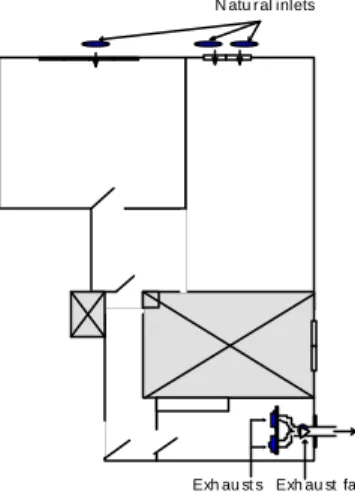
Further to the air tightness of the dwelling, an extraction mechanical ventilation has been installed. Natural inlets have been introduced on bedroom and living room windows and a mechanical extraction group with the exhausts have been put into the bathroom. The figure 3 gives the principle scheme of the dwelling with its mechanical ventilation.
N atu r al inlets
Exh au st s Exh au st fan
Figure 3 : dwelling prepared for the experimentation
2.5 Assessment of air renewal
An assessment of air renewal has been conducted in the bedroom and in the living room using SF6 tracer gas technique. The value of air renewal obtained for these rooms is a bit less than the value of extract flow measured at the exhausts. This is explained by the fact that part of the residual air leakage of the dwelling is situated in the corridor and in the bathroom. To confirm this assumption and because the air leakage characterisation of the whole dwelling has been done, we have made numerical calculations with the ventilation code Siren2000, for the same configuration and with a repartition of permeability as followed : a quarter for the bedroom, a quarter for the living room and an half for the corridor and the bathroom. A good agreement was obtained between air renewal measured with tracer gas and calculated one. The figure 4 shows these results for an example in the living room.
0 1 0 2 0 3 0 4 0 5 0 6 0 7 0 0 1 2 3 h o u r s p p m m e a s u r e d c a l c u l a t e d
Figure 4 : comparison between measured and calculated SF6 concentration decrease
These preliminary studies, enabled us to assess the air renewal of experimented rooms for a given extract air flow.
3. Experimental protocol
Two measurement campaigns were conducted in the dwelling, one in winter between the 21 of January and 23 of March 2000, and one in summer between the 19 of June and the 11 of August 2000. Preliminary measurements showed that no horizontal and vertical gradients were observed in the dwelling for the main target compounds (NO, NO2, V.O.C., PM2.5).
For each campaign, different scenarios were tested including (1) ventilation rate at about 0.9 vol/hour (2) ventilation rate at about 0.6 vol/hour (3) introduction of sorbing component (acoustic slabs) in the bedroom and in the living room at two different loading rates. During the summer campaign, measurements were als o realised with two scenario of opened windows : two slightly opened windows and one largely opened window. The measurements of parameters were done continuously in the dwelling and in the closely outdoor environment. The parameters of concern are : carbon monoxide (CO), nitrogen monoxide (NO), nitrogen dioxide (NO2), ozone (O3 –
only in summer), sulphur dioxide (SO2 - only in winter), PM2.5 particles, black smoke index, temperature, humidity,
wind velocity and direction. Some external and internal measurements of Volatile Organic Compounds (V.O.C.) have also been realised on few days periods. The sampling time steps were comprised between two minutes and one hour depending on measured parameter.
4. Effect of ventilation on outdoor pollutant transfer
The present paper focuses on the effect of ventilation on outdoor/indoor pollutant transfer. The analysis of other results concerning physical and chemical reactions, sorption mechanisms and season effect will be presented in further publications.
The objectives of ventilating buildings are to bring “clean” air from outside, to preserve the indoor environment from humidity accumulation and to dilute internal pollutant production. When outdoor air is polluted, the indoor concentration of this pollution depends on outdoor level, air flow rate and physical and chemical reactions of pollutants during time transfer.
In this chapter, the impact of ventilation on pollutant transfer is analysed for the pollutants where an effect of ventilation strategies is observed. The figures presented below correspond to an averaged day profile of outdoor and indoor measured concentrations for each ventilation strategy considered. Calculated indoor concentration are also presented using Siren2000 code and based on outdoor concentra tion measurements and on the assumption of non reactive pollutants. The analysis of the ratio between indoor measurements and the calculated indoor concentration with the assumption of non reacting pollutant could enable to highlight the effect of ventilation level on the eventual reacting part of considered pollutant.
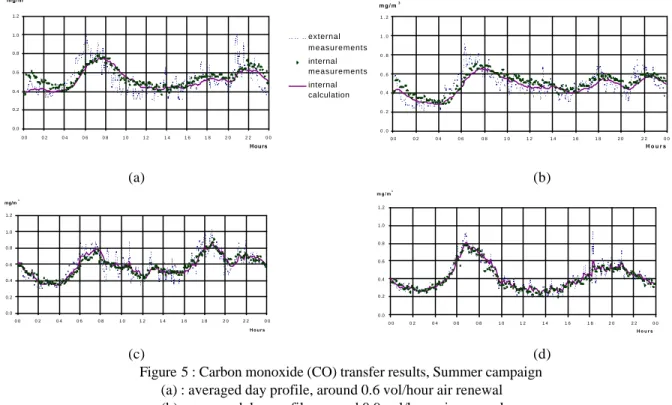
4.1 Carbon monoxide results
Figure 5 shows the results obtained for the carbon monoxide (CO) during the summer campaign. This pollutant is an inert gas. Indoor concentration depends thus only on both outdoor concentration and air renewal. A good agreement is found with our calculations. In spite of the low levels measured, the results observed correspond to the well known one that the more important is the air renewal, the less the smooth and the delay of indoor concentration compared to the outdoor one exists. For the slightly opened windows case (figure 5-c), the delay is less than half an hour and for the largely opened window case (figure 5-d), outdoor and indoor concentrations are quite similar.
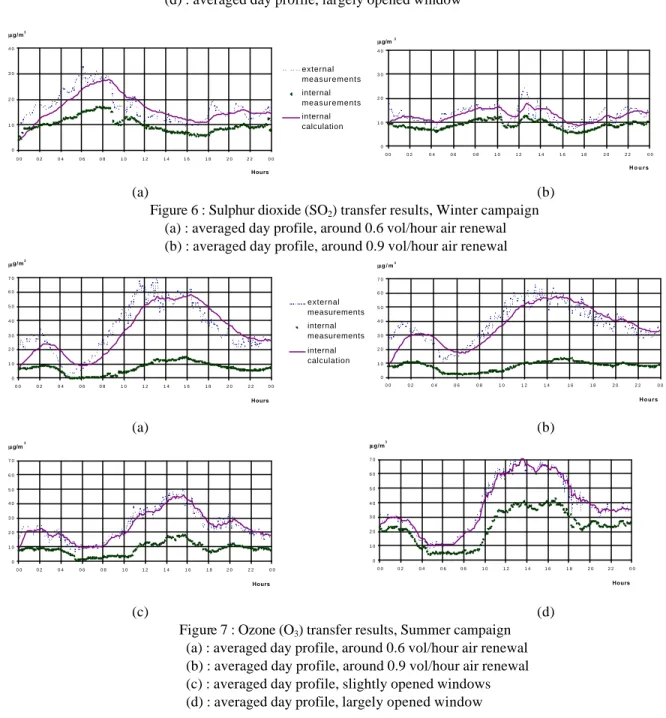
This pollutant has only been measured in winter. Figure 6 shows the results obtained. For the 0.6 vol/hour air renewal case, the measured indoor concentration is around 0.6 time the calculated indoor concentration without reactions. For the 0.9 vol/hour air renewal case, the same ratio is around 0.7. This could be explained by the fact that the more the air renewal is, the less is the residence time of air from the outside. So pollutant has less time to react.
4.3 Ozone results
Figure 7 shows the results obtained for the ozone (O3) during the summer campaign. Ozone gas is produced by
photochemical reaction between VOC and nitrogen dioxide. With a controlled air renewal (cases 7-a and 7-b), the ratio between the measured indoor concentration and the calculated one without reactions is independent of the air renewal value and around 0.2. For the slightly opened window case and for the largely opened window case, the ratio is higher and around 0.4 and 0.6 respectively. The reason of this discrepancy is equivalent to the analysis done for sulphur dioxide : the more the air renewal is, the less is the residence time of air from the outside. So pollutant has less time to react.
4.4 Nitrogen monoxide, nitrogen dioxide, PM2.5 particles and black smoke results
For these pollutants, the ratio previously mentioned is not very dependent of air renewal case. So, different experimental results are not shown in this paper.
However, it could be interesting to say that for nitrogen monoxide, when the outdoor ozone level is low, the ratio between the measured indoor NO concentration and the calculated one without reaction is around 0.85. During outdoor ozone picks, the ratio falls until 0.2.
For nitrogen dioxide, the ratio is always around 1. In winter, it could be around 1.15 at the beginning of the afternoon and in summer, it could reach 1.35 during outdoor ozone picks.
For PM2.5 particles, the ratio is always around 0.8. For black smoke, the frequency acquisition of this pollutant is
about an hour. So, there is an information loss towards effect of ventilation which could have a higher frequency. However, the ratio is always below one and seems to be closer to one when the ventilation rate grows up.
0.0 0.2 0.4 0.6 0.8 1.0 1.2 0 0 0 2 0 4 0 6 0 8 1 0 1 2 1 4 1 6 1 8 2 0 2 2 0 0 Hours mg/m3 external measurements internal measurements internal calculation 0 . 0 0 . 2 0 . 4 0 . 6 0 . 8 1 . 0 1 . 2 0 0 0 2 0 4 0 6 0 8 1 0 1 2 1 4 1 6 1 8 2 0 2 2 0 0 H o u r s m g / m3 (a) (b) 0.0 0.2 0.4 0.6 0.8 1.0 1.2 0 0 0 2 0 4 0 6 0 8 1 0 1 2 1 4 1 6 1 8 2 0 2 2 0 0 H o u r s mg/m3 0.0 0.2 0.4 0.6 0.8 1.0 1.2 0 0 0 2 0 4 0 6 0 8 1 0 1 2 1 4 1 6 1 8 2 0 2 2 0 0 H o u r s m g / m3 (c) (d)
Figure 5 : Carbon monoxide (CO) transfer results, Summer campaign (a) : averaged day profile, around 0.6 vol/hour air renewal (b) : averaged day profile, around 0.9 vol/hour air renewal
(c) : averaged day profile, slightly opened windows (d) : averaged day profile, largely opened window
0 1 0 2 0 3 0 4 0 0 0 0 2 0 4 0 6 0 8 1 0 1 2 1 4 1 6 1 8 2 0 2 2 0 0 Hours µ µ g/m3 external measurements internal measurements internal calculation 0 1 0 2 0 3 0 4 0 0 0 0 2 0 4 0 6 0 8 1 0 1 2 1 4 1 6 1 8 2 0 2 2 0 0 H o u r s µ µ g/m3 (a) (b)
Figure 6 : Sulphur dioxide (SO2) transfer results, Winter campaign
(a) : averaged day profile, around 0.6 vol/hour air renewal (b) : averaged day profile, around 0.9 vol/hour air renewal
0 1 0 2 0 3 0 4 0 5 0 6 0 7 0 0 0 0 2 0 4 0 6 0 8 1 0 1 2 1 4 1 6 1 8 2 0 2 2 0 0 Hours µ µ g/m3 external measurements internal measurements internal calculation 0 1 0 2 0 3 0 4 0 5 0 6 0 7 0 0 0 0 2 0 4 0 6 0 8 1 0 1 2 1 4 1 6 1 8 2 0 2 2 0 0 Hours µ µ g / m3 (a) (b) 0 1 0 2 0 3 0 4 0 5 0 6 0 7 0 0 0 0 2 0 4 0 6 0 8 1 0 1 2 1 4 1 6 1 8 2 0 2 2 0 0 Hours µ µ g/m3 0 1 0 2 0 3 0 4 0 5 0 6 0 7 0 0 0 0 2 0 4 0 6 0 8 1 0 1 2 1 4 1 6 1 8 2 0 2 2 0 0 Hours µ µ g/m3 (c) (d)
Figure 7 : Ozone (O3) transfer results, Summer campaign
(a) : averaged day profile, around 0.6 vol/hour air renewal (b) : averaged day profile, around 0.9 vol/hour air renewal (c) : averaged day profile, slightly opened windows (d) : averaged day profile, largely opened window
4. Evaluating the air renewal using carbon monoxide measurements
For the experiments, the dwelling has been prepared in order to control as well as possible the air renewal. It has been air tight and a mechanical extraction ventilation has been installed. Extracted flow has been punctually measured during experiments. Due to the non reactive behaviour of carbon monoxide gas, its indoor concentration depends only of the outdoor concentration and of the air renewal of the experimented room of the dwelling. So, on the basis of carbon monoxide results, a methodology has been developed to evaluate more precisely the air renewal of the experimented room. Air renewal was adjusted in order to minimise the measured CO indoor concentration with a calculated one following the equation :
AR CO outdoor CO indoor CO outdoor CO indoor
(
t
)
C
(
t
)
[
C
(
t
1
)
C
(
t
)].
e
C
=
+
−
−
where
C
COoutdoor corresponds to the measured outdoor concentration and AR is the air renewal. This methodology enables us to assess an averaged air renewal during a giv en period. The table 1 shows the results obtained and compared to the extract flow measured during the experimentation and the corrected air renewal of the experimented room based on extract flow measurements and the assessment of air leakage repartition previously determined.Generally, the calculated averaged air renewal of the room is in good accordance with results based on extract flow measurements. However, for some cases and especially for high controlled ventilation rate in winter, some discrepancies are observed. They could be explained by different reasons. The level of CO measured concentrations is relatively low (below 1 mg.m-3) so the precision level of such measurements is poor. The precision level of the extract flow measurements is on the order of 3%. The corrected air renewal value of the room is based on an hypothesis of air leakage repartition which could be wrong. Finally, the influence of meteorological condition variations of on the air renewal along time could be significant even if the dwelling is airtight and with a mechanical ventilation system.
These results show the difficulty to control air renewal of a dwelling. However, the method developed with the use of carbon monoxide measurements to assess an averaged air renewal seems t o be efficient, when air renewal is not too different during the analysed period. It permits also to assess an averaged air renewal when windows are opened. However, these last results can’t have been compared with others measurements.
Averaged Air Renewal of the room
assessed with CO measurements
Air Renewal of the room
based on extract flow measurements corrected with air leakage repartition
Extract flow measurements in the
dwelling
Vol/h m3/h Vol/h m3/h Vol/h m3/h
High controlled ventilat ion rate
0.91 86 0.91 86 0.89 102 Low controlled ventilation rate 0.64 60 Low controlled ventilation rate Absorptive surfaces 0.6 57 Low controlled ventilation rate Absorptive surfaces x 2 0.66 62 Winter Low controlled ventilation rate 0.59 56 0.55 52 0.52 60 High controlled ventilation rate 0.84 79 0.95 89 0.92 106 Low controlled ventilation rate 0.64 60 Low controlled ventilation rate Absorptive surfaces x 2 0.63 59 Low controlled ventilation rate Absorptive surfaces 0.61 58 Low controlled ventilation rate 0.70 66 0.58 55 0.55 63 Slightly opened windows 2 190 Summer Largely opened window 3.9 370
Table 1 : Assessment of the air renewal
5. Ventilation strategies against outdoor pollution
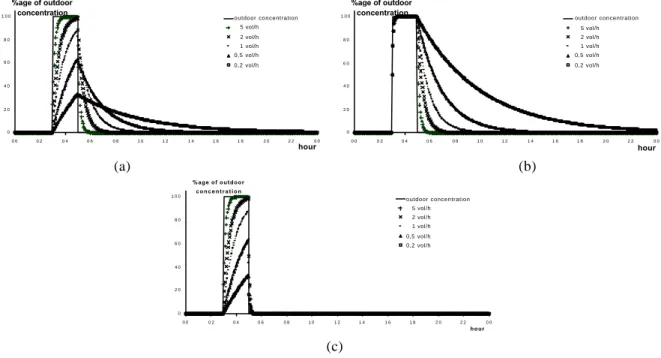
To better illustrate the discussion, figure 8 shows calculations performed with different ventilation strategies for a non reactive pollutant. For each case, an outdoor pollutant pick of two hours is considered.
For the first case, the air renewal is considered as constant and the figure 8-a show the result of the transfer for different air renewals. We observe, as for carbon monoxide in our experiment, that the more the air renewal is important, the less the smooth and the delay of indoor concentration compared to the outdoor one exists. The averaged indoor concentration is independent of air renewal and equal to outdoor one.
In figure 8-b, window is considered opened during outdoor pollution pick (with a 10 vol/hour air renewal), and different air renewal are imposed after pollution pick. In these strategies, indoor concentration is equal to outdoor concentration at the end of the pick and in the second time, the more important the air renewal is, the faster the indoor concentration decrease. On the contrary, figure 8-c shows the opposite case where there are different controlled air renewals during outdoor pollution pick and an opened window after the pick. The less the air renewal is during the pick, the less the indoor concentration is.
These easy doing calculations enables us to say that the best way to protect indoor environment to outdoor air pick exposure is to have the lower air renewal during the pick and the higher after the pick. However, this kind of strategy must take into account the need of fresh air for the occupant during the pick and can not be applied if the time of polluted outdoor air is too long. An other restriction is the fact that in urban environment as studied in this paper, different pollutant picks occur at different moments of the day, as for example carbon monoxide in the morning and ozone in the afternoon. Such a fact could make more complex this kind of ventilation strategy. An other point is that air leakage of a building contributes to air renewal of building for a part comprise between 0.1 and 0.8 vol/hour, depending on meteorological conditions and on building air tightness level. This part of air renewal can not be controlled.
Nevertheless, it is recommended to situate the air inlet on the less exposed to outdoor pollutant facade. The best way to ensure a good protection against a continuous polluted outdoor environment is to treat the incoming air by gaseous filtration and to have airtight building.
0 2 0 4 0 6 0 8 0 1 0 0 0 0 0 2 0 4 0 6 0 8 1 0 1 2 1 4 1 6 1 8 2 0 2 2 0 0 hour %age of outdoor concentration outdoor concentration 5 vol/h 2 vol/h 1 vol/h 0,5 vol/h 0,2 vol/h 0 2 0 4 0 6 0 8 0 1 0 0 0 0 0 2 0 4 0 6 0 8 1 0 1 2 1 4 1 6 1 8 2 0 2 2 0 0 hour %age of outdoor concentration outdoor concentration 5 vol/h 2 vol/h 1 vol/h 0,5 vol/h 0,2 vol/h (a) (b) 0 2 0 4 0 6 0 8 0 1 0 0 0 0 0 2 0 4 0 6 0 8 1 0 1 2 1 4 1 6 1 8 2 0 2 2 0 0 hour %age of outdoor c o n c e n t r a t i o n outdoor concentration 5 vol/h 2 vol/h 1 vol/h 0,5 vol/h 0,2 vol/h (c)
(a) : constant air renewals
(b) : opened window during outdoor pollution pick (c) : opened window after outdoor pollution pick
6. Conclusion
Outdoor and indoor pollutants monitoring outdoor (CO, SO2, NO, NO2, O3, VOC, PM2.5 particles and black smoke)
had been conducted in an empty dwelling to analyse the transfer of outdoor pollution into the dwelling. For these experiments, ventilation parameters had been controlled as much as possible. The dwelling had been airtight and mechanical ventilation system had been installed. The residual air leakage had been characterised using blowing door and air renewal of experimented room had been assessed using SF6 tracer gas technique and confronted with Siren2000 calculations code.
This paper presented the effect of ventilation on outdoor pollutant transfer. For a non reactive gas as carbon monoxide, the more important is the air renewal, the less is the smooth and the delay of indoor concentration compared to the outdoor one. For the slightly opened windows case, the delay is less than half an hour and for the largely opened window case, outdoor and indoor concentrations are quite similar. For reactive gas as sulphur dioxide and ozone, the more is the air renewal, the less is the residence time of air from the outside. So pollutant has less time to react indoor and its part indoor compared to outdoor level is more important.
On the basis of carbon monoxide results, a methodology has been developed and enables us to assess an averaged air renewal during a given period.
This study shows the difficulty to have ventilation strategy that prevents the transfer of outdoor urban pollution into such building. As a matter of fact, different pollutant picks occur at different moments of the day and a low ventilation strategy during these picks would imply an under ventilated indoor environment. Nevertheless, it is recommended to situate the air inlet on the less exposed to outdoor pollutant facade. The best way to ensure a good protection against a continuous polluted outdoor environment is to treat the incoming air by gaseous filtration and to have airtight building.