HAL Id: hal-00317014
https://hal.archives-ouvertes.fr/hal-00317014
Submitted on 1 Jan 2002
HAL is a multi-disciplinary open access
archive for the deposit and dissemination of
sci-entific research documents, whether they are
pub-lished or not. The documents may come from
teaching and research institutions in France or
abroad, or from public or private research centers.
L’archive ouverte pluridisciplinaire HAL, est
destinée au dépôt et à la diffusion de documents
scientifiques de niveau recherche, publiés ou non,
émanant des établissements d’enseignement et de
recherche français ou étrangers, des laboratoires
publics ou privés.
Poker Flat, Alaska (65.1° N, 147.5° W)
P. Kishore, S. P. Namboothiri, K. Igarashi, Y. Murayama, B. J. Watkins
To cite this version:
P. Kishore, S. P. Namboothiri, K. Igarashi, Y. Murayama, B. J. Watkins. MF radar observations of
mean winds and tides over Poker Flat, Alaska (65.1° N, 147.5° W). Annales Geophysicae, European
Geosciences Union, 2002, 20 (5), pp.679-690. �hal-00317014�
Annales Geophysicae (2002) 20: 679–690 c European Geophysical Society 2002
Annales
Geophysicae
MF radar observations of mean winds and tides over Poker Flat,
Alaska (65.1
◦
N, 147.5
◦
W)
P. Kishore1, S. P. Namboothiri1, K. Igarashi1, Y. Murayama1, and B. J. Watkins2 1Communications Research Laboratory, Tokyo, Japan
2Geophysical Institute, Univ. of Alaska, Fairbanks, Alaska, USA
Received: 28 June 2001 – Revised: 1 October 2001 – Accepted: 2 October 2001
Abstract. MF radar wind measurements in the mesosphere
and lower thermosphere over Poker Flat, Alaska (65.1◦N, 147.5◦W) are used to study the features of mean winds and solar tides. Continuous observation with the newly installed radar is in progress and in the present study we have analyzed a database of the first 27 months (October 1998–December 2000) of observation. The observed mean wind climatol-ogy has been compared with previous measurements and the latest empirical model values (HWM93 model). Similarly, the tidal characteristics are described and compared with the Global Scale Wave Model (GSWM00).
The mean wind characteristics observed are fairly con-sistent with previous wind measurements by the Poker Flat MST radar. The main feature of the zonal circulation is the annual variation with summer westward flow and win-ter eastward flow. The annual mean zonal wind has a west-ward motion at altitudes below 90 km. The annual mean meridional circulation has mainly southward motion at 70– 100 km. There is very good agreement between the radar zonal winds and the HWM93 model winds. Comparison of the meridional winds shows some discrepancy. Analysis of two years of data indicated that the year-to-year consistency is preserved in the mean circulation in the mesosphere.
Tidal characteristics observed are also consistent with pre-vious measurements. Semidiurnal tides have the largest amplitudes in summer while the weakest amplitude is ob-served during the winter months. The vertical wavelength is longer during the summer season compared to the winter season. Comparison with the GSWM00 produces mixed re-sults. There is reasonable agreement between the observed and modeled phases. Diurnal tide amplitudes are compara-ble in magnitude with that of the semidiurnal tide. Seasonal variation is less evident in the amplitudes. Comparison of the observed tidal parameters with the GSWM00 reveals some agreement and discrepancies.
Correspondence to: S. P. Namboothiri
(nambooth@crl.go.jp)
Key words. Meteorology and atmospheric dynamics
(cli-matology; middle atmosphere dynamics; waves and tides)
1 Introduction
Studies of the arctic middle atmosphere over Poker Flat, Alaska, took a new dimension with the joint research project recently launched by the Communications Research Labo-ratory of Japan and the Geophysical Institute of University of Alaska, USA. The motivation behind the “Alaska Project” was the complete understanding of the dynamics of the arc-tic middle atmosphere and ionosphere that contribute to the global environmental and climate changes. It has been found that several of the arctic atmosphere phenomena have direct impacts on the structure or variations of atmosphere over other regions. The main focus of the project is the obser-vation of the middle atmosphere as well as the ionosphere by using various ground-based instruments. As part of the project various optical and radio equipments have been in-stalled and currently the project is undergoing its observa-tional phase. Mesosphere and lower thermosphere (MLT) observations (in the Alaska Project) are mainly conducted by using a medium frequency (MF) radar, a Fabry-Perot inter-ferometer, a sodium lidar and a Rayleigh lidar. It is expected that the combined use of the data based on these collocated instruments will be able to address a number of issues of the dynamics of the high-latitude middle atmosphere.
Information on high-latitude middle atmosphere dynamics is documented through observations at a number of stations in the northern and southern hemispheres. At Poker Flat, previous observations using the MST radar during 1980 s were useful to describe various features of the dynamics of the middle atmosphere. The radar relied on backscatter due to turbulent fluctuations in the index of refraction. In ad-dition, meteor echoes have been observed on the radar and have been used to study the mean winds and tides in the 80–
Fig. 1. Average number of wind
esti-mates available per hour at each height gate (between 50 and 100 km) for sum-mer, winter, spring, and fall seasons during 1999. Maximum number possi-ble is 20 estimates/hour.
100 km height range (Avery et al., 1983, 1989; Balsley and Riddle, 1984; Tetenbaum et al., 1986). Various other analy-ses also provided valuable information on other phenomena such as gravity waves, turbulence, and longer-period motions in the high-latitude mesosphere (Carter and Balsley, 1982; Williams and Avery, 1992).
In this paper, we present an analysis of the wind field over Poker Flat for the first 27 months (October 1998–December 2000) of MF radar observation. The study is primarily con-cerned with the mean winds and the tidal oscillations in the wind field. The observed results are compared with the lat-est model results as well as with other earlier observations. We begin by describing the data collection and analysis pro-cedures in Sect. 2. Results and discussion are presented in Sect. 3. The summary of the analysis is presented in the last section.
Table 1. Poker Flat MF radar system specifications
Characteristic
Location 65.1◦N, 147.5◦E Operation frequency 2.43 MHz Peak envelope power 50 kW Half-power pulse width 27 µsec
Antenna spacing 170 m
Sampling interval 2 km Time resolution 3 min
2 Observations and analysis of data
A new MF radar which uses the spaced-antenna (SA) technique was established at Poker Flat, Alaska (65.1◦N,
P. Kishore et al.: MF radar observations of mean winds and tides over Poker Flat, Alaska 681
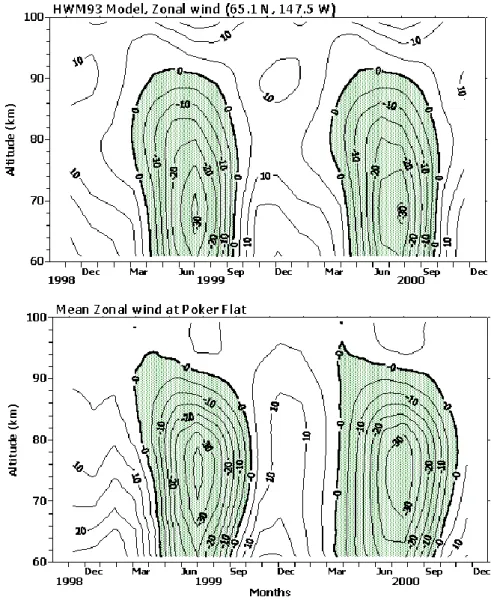
Fig. 2. Time-height cross section of the mean zonal wind component (bot-tom) observed at Poker Flat from Octo-ber 1998 to DecemOcto-ber 2000. HWM93 (Hedin et al., 1996) model contours for Poker Flat are given in the top panel. Shaded regions represent the regimes of westward flow.
147.5◦W) in October 1998. Since then, continuous obser-vation of mesosphere lower thermosphere winds has been underway. The radar is almost identical to the two other MF radars installed by CRL, in Yamagawa and Wakkanai in Japan (for details see Namboothiri et al., 2000). Table 1 gives the specifications of the radar. The radar transmits circularly polarized radiowaves at a frequency of 2.43 MHz, which is slightly larger than the frequency (∼1.95 MHz) used at Yam-agawa and Wakkanai. Three sets of crossed dipoles, spaced at 170 m, are used for reception. The radar uses a pulse length of ∼4 km but data are oversampled at 2 km height in-tervals and observations taken every 3 min. The analysis is carried out in real-time using the conventional full correlation analysis (FCA) (Briggs, 1984). Seasonal characteristics are studied by classifying the data into winter (December, Jan-uary, and February), spring (March, April, and May), sum-mer (June, July, and August), and fall (September, October, and November).
One significant point concerning the data collection over Poker Flat is the availability of echoes even from altitudes
below 50 km. Figure 1 shows the average number of wind values per hour at each height gate (between 50 and 100 km) for the four seasons of 1999. It should be noted that all of the data presented in the study are plotted against the “vir-tual height” of reflection. In a recent study, Namboothiri et al. (1993) described the effects of group retardation on 2.2 MHz signals at Saskatoon and predicted the real heights for different seasons and solar activity conditions. They showed that noontime group retardation is not severe dur-ing winter for both solar maximum and minimum conditions; for such periods the tidal and winds data are valid up to 111 km without any correction. In summer, however, day-time group retardation is more significant and suggest that, during solar minimum periods, the virtual height may be equivalent to the real height up to 97 km. The correspond-ing solar maximum height falls as low as 95 km. Gener-ally, similar constraints are applicable to the Poker Flat data. The results presented here are for the period October 1998– December 2000, which was a solar moderate/maximum pe-riod. From the figure it can be seen that the data yield is
Fig. 3. As in Fig. 2 but for the
merid-ional wind. Periods of equatorward mo-tions are denoted by shaded regions.
low at 50–60 km during nighttime. However, the data yield is much better, even in the altitude range 50–60 km, during daytime. There is a clear seasonal variation in data yield at the lower altitudes where, during the summer, the time of day is larger than during winter. Generally, the maximum data rate is observed in the 70–80 km range. The winter season is characterized by the largest number of wind val-ues; a comparatively lesser data rate is observed in the fall season. The increased data availability in the altitudes near 50 km is due to enhancements in electron density, which may be the effect of aurora and energetic particle precipitation in the polar latitudes. Igarashi et al. (2000) reported larger D-region electron density distributions (compared to the IRI-model and Wakkanai, a mid-latitude station) over Poker Flat. The low altitude echoes are also observed in southern hemi-spheric high latitudes. MF radar observations at Scott Base, Antarctica (77.9◦S, 166.8◦E) showed some evidence of ion-ization, even at altitudes between 40–50 km, and it is sug-gested that the observed ionization is caused by relativistic electrons penetrating into the upper stratosphere (von Biel,
1992, 1995). Rees (1963, 1989) discusses the production of ionization from such an electron flux in connection with au-roral ionization.
Harmonic analysis has been performed to derive the pre-vailing wind and tidal components. Hourly means of winds for each height bin were estimated by averaging all the avail-able wind values for each hour. These hourly mean wind esti-mates for each height gate are averaged to make the monthly or the seasonal mean of mean winds. For the tidal fitting, we adopt the criterion that there should be at least 16 hours represented in the data for a given height. Also, we weighted the hourly means in the fit according to the number of values therein. Time series of amplitudes and phases were deter-mined and studied the climatological aspects. Considering better data reliability, the analysis is mainly focused on the height range 60–100 km.
P. Kishore et al.: MF radar observations of mean winds and tides over Poker Flat, Alaska 683
Fig. 4. The observed and modeled wind components for the year 1999. The data are given for 60–100 km (4 km interval). The correlation
coefficient is given in each box.
3 Results and discussion
3.1 Mean winds
This section presents measurements of the mean circulation in the MLT region over Poker Flat and compares them with the HWM93 empirical model (Hedin et al., 1996). In Fig. 2, the bottom panel illustrates the time-height contours repre-senting average prevailing zonal wind patterns for the first 27 months of MF radar observations at Poker Flat. The HWM93 empirical model winds for the latitude and longitude of Poker Flat are given in the top panel. Monthly mean values are uti-lized to develop these mean wind climatologies.
Describing the circulation characteristics, the dominant feature observed is the annual cycle of summer westward and winter eastward winds. The seasonal variation of the cir-culation is observed mainly at altitudes below 92 km. Two years of wind data presented here show qualitative agree-ment in the flow patterns. Generally, the spring reversal from eastward to westward occurs in March. The summer meso-spheric westward jet maximizes near 75 km at about 35 m/s. This is almost consistent with the past MST radar measure-ments at Poker Flat (Carter and Balsley, 1982; Tetenbaum et al., 1986; Williams and Avery, 1992). The analysis of five years (1985–1989) of wind data by Tetenbaum et al. (1986)
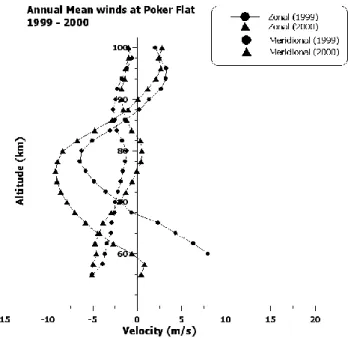
Fig. 5. Annual mean zonal and meridional winds at Poker Flat for
the years 1999 and 2000.
has shown that the summer westward jet has a maximum am-plitude of 30 m/s located at about 80 km. At 80 km the sum-mer westward winds persist for about 6–7 months. The west-ward jet maximizes in June or July. The observed similarity, in the strength of the summer westward jet, with the previ-ous MST radar measurements suggests that the interannual variability is less evident in the amplitude of the winds. The peak summer crossover occurs at around 90 km. Above this altitude the wind flow is mostly eastward at all times of the year. The summer to winter circulation commences during September-October. Winter eastward winds appear to have higher variability. The maximum amplitude of the eastward jet is 20–25 m/s. The eastward maximum tends to occur at a lower altitude (around 60 km). This is somewhat different to the behavior at midlatitude sites, where the maximum east-ward winds occur at an altitude around 75 km. The spring-time seasonal changes show a more abrupt transition in 2000 than compared to the transition in 1999. The fall transition was comparatively gradual in 1999 and 2000. It occured over a period of several weeks in the 60–90 km height region.
Comparison of the observed zonal winds and the HWM93 model winds reveals excellent agreement. The summer and winter cells have similar structure. The summer westward jet has approximately similar intensities both in model and ob-servation. The maximum difference observed is only 5 m/s. The time occurrence of maximum westward winds is gen-erally the same in both datasets. The peak summer reversal occurs around 92 km in the model outputs as well as in the observation. The winter eastward winds also have identical strength in both model and observation.
The time-height contours of the meridional wind are presented in Fig. 3 along with the corresponding model (HWM93) winds. The general pattern of the plots is some-what similar, but there are also some differences. The vari-ability of meridional winds is larger than the zonal winds.
The maximum intensity of southward or northward winds in the model and observation appears to be similar. How-ever, there is some difference in the structure of these south-ward/northward cells. At altitudes above 92 km, the circu-lation shown by the model and observation differ in their pattern. At 88 km the observation shows a consistent strong southward winds (>8 m/s) during June/July. The model pro-duces only weak winds at the same height and time of the year. These summer equatorward motions have also been observed at other high latitude stations, for example, Heiss Island, Molodezhnaya, Tromsø, and Scott Base (Lysenko et al., 1979; Fraser, 1984; Manson et al., 1992). The maximum amplitude of southward winds in the observation and model is 12–16 m/s and the corresponding northward wind ampli-tude is only 4 m/s. Comparison of the observed meridional winds with the earlier MST radar measurements (Tetenbaum et al., 1986) notes some differences. The MST observations basically indicated northward motions at altitudes 80–88 km throughout the entire year. Our observations show evidence of southward motions at similar heights during the summer season. As in the case of zonal winds, the MF and MST radar measurements produce meridional winds of comparable in-tensity. The observed features of the summer southward jet are consistent in both years. The location (88 km) of the jet is just below the zonal reversal height where the zonal shear is largest.
Comparing the MF radar mean winds at Poker Flat with the earlier Mawson (68◦S, 63◦E) measurements (Manson et al., 1991, Figs. 7–8), it can be seen that there is reason-able agreement between the two circulations. At both places the zonal winds are of similar strengths and also the circula-tion features have considerable resemblance. Similarly, the meridional contours also compare well in their structure and intensities of the southward/northward cell. The paper by Manson et al. (1991) extensively discussed and compared the wind contours at the high-latitude stations such as Poker Flat, Tromsø, Mawson etc. It is shown that the circulation at these stations is quite similar.
In order to facilitate the comparison more efficiently, we have calculated the correlation coefficients between the servation and the model values. In Fig. 4 we show the ob-served winds and the model values for altitudes (4 km inter-val) from 60 to 100 km for the year 1999. The correlation values are given in each box. It can be seen that the corre-lation is better in the case of zonal winds. The values are around 0.80 up to 88 km and above this altitude correlation becomes weak. However, the meridional winds show little correlation with the model values throughout the entire alti-tude. Again, the lower altitudes show comparatively better correlation than the upper altitudes.
The annual mean zonal and meridional profiles for Poker Flat are presented in Fig. 5. It follows from the figure that the average zonal wind has a westward circulation at alti-tudes below 90 km and above this limit eastward circula-tion prevails. The westward flow maximizes around 78 km at approximately 6–9 m/s. The meridional profile shows mainly southward motion in the altitude region 70–100 km
P. Kishore et al.: MF radar observations of mean winds and tides over Poker Flat, Alaska 685
Fig. 6. Semidiurnal seasonal mean for summer, winter, spring, and fall of the Poker Flat radar data (zonal component) and the GSWM00
values. Data shown are for the years 1999 and 2000. Horizontal bars represent the standard errors.
Fig. 8. Height-time cross section of amplitude of the semidiurnal
tide of October 1998–December 2000.
and found that the average flow is less than 3 m/s in the same height region.
3.2 Semidiurnal tide
This and the following section present observations of the tidal winds over Poker Flat during 1998–2000. The semid-iurnal and dsemid-iurnal tides are discussed separately and com-pared with the Global Scale Wave Model 2000 (GSWM00) (M. E. Hagan, Private communication, 2001). The advan-tage of GSWM00 over the previous versions is that it can provide tidal parameters for each month. The vertical struc-tures of the seasonally averaged semidiurnal tide at Poker Flat for 1999 and 2000, and the GSWM00 values are shown in Figs. 6 and 7. The horizontal bars on the plot represent the month-to-month variability about the average. For the purpose of comparison, the model results were sampled at heights corresponding to those of the radar data, and then the amplitudes and phases of the semidiurnal tide were averaged
Fig. 9. Two-year averaged vertical wavelengths of the semidiurnal
tide at Poker Flat. Vertical wavelengths ≥140 km are shown by symbols along 140 km level.
over 3-month blocks to obtain the seasonal means. It seems that each component shows almost year-to-year consistency in the amplitude and phase structures. The amplitudes of the meridional component are comparable with those of the zonal component. Weak seasonal variations of amplitude and phase are seen in both radar data and model. Tidal ampli-tudes are largest (10–12 m/s) in summer and fall seasons. The weakest amplitude (5 m/s) occurs in spring. Overall, the comparison between the observation and the model is not good, especially in the case of amplitudes. Generally, above 90 km the model overestimates the observed values. Below 90 km, observed values show larger strength than the model values. In almost all the seasons the model amplitude contin-ues to grow with height. Above 80–90 km an abrupt growth in model amplitude is observed. Model amplitudes of values
>30 m/s are not shown in the plot. Model profiles show the smallest amplitude in summer while the other seasons have comparatively similar values and variations. The phases of the zonal and meridional components of the semidiurnal tide generally show the downward phase progression during most of the months. Both model and observation display a larger vertical wavelength in summer and a shorter vertical wave-length in winter season. The vertical phase structure gener-ally indicates a propagating wave. Comparison of the model and observed phases suggests that there is reasonable agree-ment between the two sets of values.
Figure 8 presents contour plots of the zonal and meridional components of semidiurnal tide amplitudes. The important
P. Kishore et al.: MF radar observations of mean winds and tides over Poker Flat, Alaska 687
Fig. 10. Semidiurnal tidal amplitude and phase observed at Poker
Flat for the heights 86 and 96 kms.
feature is the consistent amplitude maximum in the sum-mer/early fall season. The maximum amplitude observed is 10–13 m/s. The zonal amplitudes are slightly larger than the meridional component. The winter/spring months are char-acterized by comparatively smaller amplitudes than the am-plitudes in the other months.
The seasonally averaged tidal characteristics reported here are often consistent with the previous observations made at Poker Flat (Tetenbaum et al., 1986). However, it should be remembered that the comparison with the previous mea-surements is not entirely valid considering the interannual variability of tides. For example, Tetenbaum et al. (1986) reported semidiurnal tide contours of maximum strength 20 m/s for the 1983/1984 data. The present measurements indicated the value of the maximum contour as 13 m/s. High-latitude tidal structure shows considerable variations be-tween different stations. Tetenbaum et al. (1986) observed large differences between the semidiurnal tides at Mawson (MacLeod and Vincent, 1985) and Poker Flat. Avery et al. (1989) compared the high-latitude tidal behavior by using
the data from several stations, including Poker Flat. They observed a number of similarities as well as differences be-tween the stations. We plan to conduct more comparative studies using the Poker Flat data and concurrent data from other high-latitude stations.
The two-year (1999 and 2000) average vertical wave-lengths of semidiurnal tides at Poker Flat are shown in Fig. 9. Here the height range considered is 80–90 km. It is clear that long vertical wavelengths (>140 km) or evanes-cent structure are observed during summer and compara-tively shorter wavelengths are observed in other seasons. The vertical wavelength (zonal) observed in December is very low (∼13km). It is observed that in both years there are pro-nounced phase jumps which may have contributed to anoma-lous vertical wavelength. Apart from those phase jumps, the gradients in Fig. 6 for winter have reasonably uniform phase slopes corresponding to vertical wavelengths of about 60 km, comparable with the meridional values. Overall the observed values are similar with the MST radar measurements at Poker Flat (Avery et al., 1989).
Figure 10 shows the monthly amplitudes and phases for 1999–2000 at two selected heights. This plot illustrates the seasonal variations of tidal parameters at 86 and 96 km. It can be seen that the monthly amplitude of the zonal compo-nent correlates well with those of the meridional compocompo-nent. The phases also correlate reasonably well. The zonal phase leads the meridional phase by about 3 h, indicating that the tide is circularly polarized. As noted in the contour plots the amplitude maximum is observed in late summer/fall months. At both heights, the amplitude is similar in strength. Summer and winter seasons show distinct phase states. The period of almost constant phase state (especially at 86 km) in summer lasts longer than the period of constant phase state in winter. Phase transition is observed in spring and fall seasons. The analysis of two years of data presented here indicates that the annual pattern of amplitude and phase is repeated in consec-utive years.
3.3 Diurnal tide
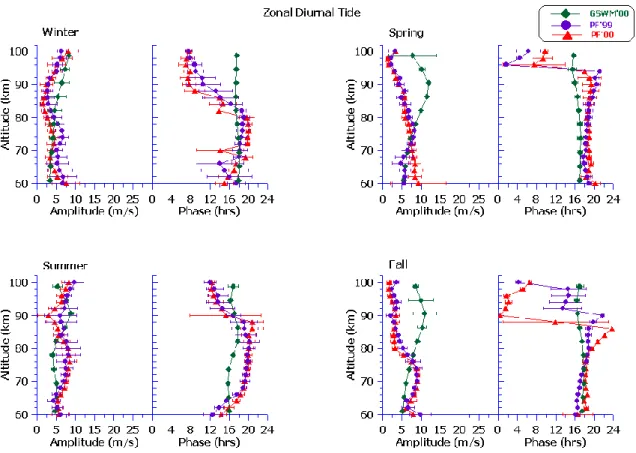
Turning our attention to the diurnal tides, Figs. 11 and 12 display the mean behavior of height dependencies of tidal parameters for Poker Flat during the four seasons. The data are presented in the same fashion as the semidiurnal tides (Figs. 6 and 7). First discussing the amplitudes, like the semidiurnal tide, the diurnal amplitude is also mainly in the range 5–10 m/s. There is no clear seasonal trend evident in the height profiles. The seasonal profiles shown for the two years suggest that the amplitudes appear to have consistent values in 1999 and 2000. Both the zonal and meridional components have roughly similar strengths, especially in the summer seasons. The zonal amplitude in the winter season is marked with slightly larger values than the meridional am-plitude. However, during the spring and fall conditions at some heights, the meridional component tends to have larger (2–4 m/s) amplitude than the zonal component. A linear drop in the amplitude is evident in both components at 74–94 km
Fig. 11. Height profiles of the amplitudes and phases of the zonal wind component of the diurnal tide during summer, winter, spring, and fall
seasons. Data shown are for the years 1999 and 2000. GSWM00 values are also given for comparison.
P. Kishore et al.: MF radar observations of mean winds and tides over Poker Flat, Alaska 689
Fig. 13. Height-time monthly contours of the amplitudes of the
zonal and meridional components of diurnal tide.
during the spring season. The observed amplitudes generally compare well with the model values during the summer and winter seasons. Mostly the model values are within the stan-dard deviation of the observed values. However, comparison is not promising (particularly for the zonal component) in the case of spring and fall conditions. The model values are larger than the observed values at altitudes above 75–80 km. The observed phase profiles show consistency in the two years of data analyzed in the present study. The zonal diur-nal tide, during summer and winter, shows downward phase propagation at altitudes above 80 km. The large error bars for the meridional component during the winter season demon-strate instability of the phase structure. The spring and fall conditions mainly represent evanescent behavior of the diur-nal tide. It is interesting to note that at many heights (gen-erally below 90 km) the phase of the meridional component leads that of the zonal component by several hours in all the four seasons. In spring and fall, sudden changes with height
in the meridional phase are clearly observed. This results from the interference of different tidal modes. The model profiles often show larger vertical wavelengths or evanes-cence in all the seasons. Comparison of the observed and model tidal phases does not show much agreement. The dis-crepancy is larger in the case of meridional component.
Figure 13 shows contour plots of amplitude for the zonal and meridional components of diurnal tide at Poker Flat. The cross sections have some differences compared with the sea-sonal features seen in the previous plots. It appears that the zonal and meridional components have the same ampli-tudes. In general, a very distinct seasonal variation is not seen in the climatological presentation of amplitudes. How-ever, above 90 km during summer, there is a tendency to at-tain larger amplitudes for both zonal and meridional compo-nents. The maximum amplitude observed is nearly 10 m/s at around 100 km. Similarly, a closer look reveals that the amplitude is smaller (3–5 m/s) during the winter season. The year-to-year variability is least significant in the tidal con-tours.
Comparing the present climatological features with the previous measurements conducted at Poker Flat (Tetenbaum et al., 1986), some differences can be seen. For example, Tetenbaum et al. (1986) showed that the amplitude of the meridional component is generally larger than the zonal com-ponent. The present MF measurement does not match the previous measurements. Our measurements agree with the measurements at Tromsø (Manson et al., 1988), which also reported that the zonal and meridional components have the same amplitudes.
4 Summary
This paper is an attempt to provide the mean wind and tidal characteristics over Poker Flat. We have used two years of data collected by a new MF radar, which is installed as part of a collaborative research project. Seasonal variations of mean winds and tides over the site are constructed and the climatologies are compared with earlier observations as well as the latest model results.
The main feature of the zonal circulation in the MLT is the annual variation with summer westward flow and winter eastward flow. The summer westward jet has a maximum intensity of 35 m/s, which is larger than the winter eastward maximum (20 m/s). Dominant annual variation, with sum-mer southward motions and winter northward motions, is ob-served in the meridional circulation. The annual mean zonal wind has a westward motion at heights below ∼90 km. It maximizes at around 80 km with a strength of 7–10 m/s. The annual mean meridional circulation shows mainly equator-ward motions. The model (HWM93) and observations show very good agreement (especially for zonal component) in the wind patterns as well as in the strength.
For the semidiurnal tides, comparison between GSWM00 results and observations shows that model amplitudes (above 80–90 km) are significantly larger than observed amplitudes
during the winter, spring and fall seasons. During the sum-mer, however, observed amplitudes are stronger than the modeled amplitudes. Model and observed tidal phase vari-ations show reasonable similarity. Short vertical wavelength is observed in winter and evanescent or longer vertical wave-lengths are observed in summer.
The height profiles of diurnal tides suggest weak evidence of seasonal variation. The summer amplitudes are slightly larger than the winter amplitudes. The GSWM00 amplitudes and the observed amplitudes match well in the case of diurnal tide. The comparison of the phases shows a larger discrep-ancy particularly in the case of meridional component.
The MF radar observation at Poker Flat is steadily pro-gressing. Creation of an extensive and continuous database is a major priority and such a database would open avenues for promising collaborative studies with other middle at-mosphere research groups. Topics like studies on latitudi-nal/longitudinal dependencies of major dynamical processes in the MLT region can be well addressed through such initia-tives.
Acknowledgements. We thank M. Hagan for providing the tabu-lations of GSWM00. The authors appreciate the financial sup-port from respective funding agencies. The first author especially thanks the Telecommunications Advancement Organization (TAO) of Japan for awarding a fellowship. The Poker Flat MF radar is operated by Communications Research Laboratory in cooperation with the Geophysical Institute, University of Alaska, Fairbanks, USA.
The Editor in chief thanks D. Thorsen and G. Fraser for their help in evaluating this paper.
References
Avery, S. K., Riddle, A. C., and Balsley, B.: The Poker Flat, Alaska, MST radar as a meteor radar, Radio Sci., 18, 1021–1027, 1983. Avery, S. K., Vincent, R. A., Phillips, A., Manson, A. H., and Fraser,
G. J.: High-latitude tidal behavior in the mesosphere and lower thermosphere, J. Atmos. Terr. Phys., 51, 595–608, 1989. Balsley, B. and Riddle, A.: Monthly mean values of the
meso-spheric wind field over Poker Flat, Alaska, J. Atmos. Sci., 41, 2368–2375, 1984.
Briggs, B. H.: The analysis of spaced sensor records by correlation techniques, MAP Handbook, 13, 166–184, 1984.
Carter, D. and Balsley, B.: The summer wind field between 80 and 93 km observed by the MST radar at Poker Flat, Alaska (65◦N), J. Atmos. Sci., 39, 2905–2915, 1982.
Fraser, G. J.: Summer circulation in the Antarctic middle atmo-sphere, J. Atmos. Terr. Phys., 46, 143–146, 1984
Hedin, A. E., Fleming, E. L., Manson, A. H., Schmidlin, F. J.,
Avery, S. K., Clark, R. R., Franke, S. J., Fraser, G. J., Tsuda, T., Vial, F., and Vincent, R. A.: Empirical wind model for the upper, middle and lower atmosphere, J. Atmos. Terr. Phys., 58, 1421–1447, 1996.
Igarashi, K., Murayama, Y., Nagayama, M., and Kawana, S.: D-region electron density measurements by the MF radar in the middle and high latitudes, Adv. Space Res., 25, 25–32, 2000. Lysenko, I. A., Orlyansky, A. D., and Portnyagin, Yu. I.: Results of
wind velocity measurements at middle and high latitudes by the meteor radar method, J. Geomag. Geoelectr., 31, 411–418, 1979. MacLeod, R. and Vincent, R. A.: Observations of winds in the Antarctic summer mesosphere using the spaced antenna tech-nique, J. Atmos. Terr. Phys., 47, 567–574, 1985.
Manson, A. H., Meek, C. E., Fleming, E., Chandra, S., Vincent, R. A., Phillips, A., Fraser, G. J., Smith, M. J., Fellous, J. L., and Massbeuf, M.: Comparisons between satellite-derived gradient winds and radar-derived winds from the CIRA-86, J. Atmos. Sci., 48, 411–428, 1991.
Manson, A. H., Meek, C. E., Brekke, A., and Moen, J.: Mesosphere and lower thermosphere (80–120 km) winds and tides from near Tromsø (70◦N, 10◦E): comparisons between radars (MF, EIS-CAT, VHF) and rockets, J. Atmos. Terr. Phys., 54, 927–950, 1992.
Manson, A. H., Meek, C. E., Hagan, M. E., Hall, C. M., Hocking, W. K., MacDougall, J. W., Franke, S. J., Riggin, D., Fritts, D. C., Vincent, R. A., and Burrage, M. D.: Seasonal variations of the semi-diurnal and diurnal tides in the MLT: multi-year MF radar observations from 2 to 70◦N, and the GSWM tidal model, J. Atmos-Solar. Terr. Phys., 61, 809–828, 1999.
Namboothiri, S. P., Manson, A. H., and Meek, C. E.: E region real heights and their implications for MF radar-derived wind and tidal climatologies, Radio Science, 28, 187–202, 1993.
Namboothiri, S. P., Kishore, P., Igarashi, K., Nakamura, T., and Tsuda, T.: MF radar observations of mean winds over Yamagawa (31.2◦N, 130.6◦E) and Wakkanai (45.4◦N, 141.7◦E), J. Atmos-Solar. Terr. Phys., 62, 1177–1187, 2000.
Rees, M. H.: Auroral ionization and excitation by incident energetic electrons, Planet. Space Sci., 11, 1209–1216, 1963.
Rees, M. H.: Physics and Chemistry of the Upper Atmosphere (ch. 3), Cambridge University Press, Cambridge, 1989.
Tetenbaum, D., Avery, S. K., and Riddle, A. C.: Observations of mean winds and tides in the upper mesosphere during 1980– 1984, using the Poker Flat, Alaska, MST radar as a meteor radar, J. Geophys. Res., 91, 14 539–14 555, 1986.
von Biel, H. A.: Ionisation in the Antarctic stratosphere, J. Atmos. Terr. Phys., 54, 235–242, 1992.
von Biel, H. A.: Ground based radar investigation of the Antarctic mesosphere, Adv. Space Res., 16, 591–598, 1995.
Williams, C. R. and Avery, S. K.: Analysis of long-period waves us-ing the mesosphere-stratosphere-troposphere radar at Poker Flat, Alaska, J. Geophys. Res., 97, 20 855–20 861, 1992.