HAL Id: hal-01213381
https://hal.sorbonne-universite.fr/hal-01213381
Submitted on 8 Oct 2015
HAL is a multi-disciplinary open access
archive for the deposit and dissemination of
sci-entific research documents, whether they are
pub-lished or not. The documents may come from
teaching and research institutions in France or
abroad, or from public or private research centers.
L’archive ouverte pluridisciplinaire HAL, est
destinée au dépôt et à la diffusion de documents
scientifiques de niveau recherche, publiés ou non,
émanant des établissements d’enseignement et de
recherche français ou étrangers, des laboratoires
publics ou privés.
New indicators for delay in initiation of antiretroviral
treatment: estimates for Cameroon
Jacques Da Ndawinz, Xavier Anglaret, Eric Delaporte, Sinata Koulla-Shiro,
Delphine Gabillard, Albert Minga, Dominique Costagliola, Virginie Supervie
To cite this version:
Jacques Da Ndawinz, Xavier Anglaret, Eric Delaporte, Sinata Koulla-Shiro, Delphine Gabillard,
et al.. New indicators for delay in initiation of antiretroviral treatment: estimates for Cameroon.
Bulletin of the World Health Organization, World Health Organization, 2015, 93 (8), pp.521-528.
�10.2471/BLT.14.147892�. �hal-01213381�
New indicators for delay in initiation of antiretroviral treatment:
estimates for Cameroon
Jacques DA Ndawinz,
aXavier Anglaret,
bEric Delaporte,
cSinata Koulla-Shiro,
dDelphine Gabillard,
bAlbert Minga,
eDominique Costagliola
a& Virginie Supervie
aIntroduction
Early initiation of antiretroviral treatment (ART) is needed to reduce morbidity and mortality from human immuno-deficiency virus (HIV) infection and to reduce HIV trans-mission.1,2 The CD4+ T-lymphocyte (CD4+ cell) threshold
for ART eligibility in World Health Organization (WHO) guidelines have changed several times. In 2006, HIV-infected individuals with 200 CD4+ cells/μL or less were eligible for ART. In 2010, 350 cells/μL was the threshold. In 2013, the threshold was raised to 500 cells/μL, but the guidance was to prioritize individuals with advanced HIV disease or less than 350 cells/μL.3–5
These changes in ART eligibility coincided with rapid scaling-up of ART in low- and middle-income countries. In sub-Saharan Africa, the number of people receiving ART increased from 100 000 in 2003 to 9.0 million in 2013.6
Be-tween 2006 and 2011, the median CD4+ cell count increased from 238 to 286 cells/μL at enrolment into care and from 125 to 185 cells/μL at ART initiation.7,8 Thus, many people living
with HIV started ART below the WHO-recommended CD4+ cell count threshold, which indicates a gap between ART guidelines and reality.
Measuring this gap at the population level and its changes over time is important to effectively monitor and evaluate programmes aimed at reducing late ART initiation. Gener-ally, the timeliness of ART initiation is assessed by analysing the distribution of CD4+ cell counts at ART initiation and access to ART is measured by ART coverage, defined as the
number of individuals receiving ART among those eligible.9
However, these indicators do not quantify the time between becoming HIV-infected and the actual ART initiation nor do they measure how much time is lost between the moment – usually unobserved – when HIV-infected people reach the ART eligibility threshold and when they actually start receiving ART. Here, we propose two new population-level indicators to measure these times among HIV-infected people initiating ART: (i) the time from HIV seroconversion – i.e. the time at which the body produces detectable antibodies to HIV – to ART initiation; and (ii) the delay in ART initiation, i.e. the time between eligibility for ART and initiation of ART. To give an example, we estimated these indicators for Cameroon, where ART became freely available in May 2007 and the number of people living with HIV and receiving ART increased from 17 000 in 2005 to 132 000 by the end of 2013.6
Methods
Data sources
Our approach requires two data sets. First, data on CD4+ cell counts at ART initiation among individuals who are represen-tative of the population of interest. Second, data on the natural history of the CD4+ cell count decline during HIV infection. The first data set was obtained from a survey conducted in a representative sample of 55 HIV-care facilities in Camer-oon. The design of this survey has been described elsewhere.10
Briefly, the medical records of 4154 people older than 15 years,
Objective To propose two new indicators for monitoring access to antiretroviral treatment (ART) for human immunodeficiency virus (HIV);
(i) the time from HIV seroconversion to ART initiation, and (ii) the time from ART eligibility to initiation, referred to as delay in ART initiation. To estimate values of these indicators in Cameroon.
Methods We used linear regression to model the natural decline in CD4+ T-lymphocyte (CD4+ cell) numbers in HIV-infected individuals
over time. The model was fitted using data from a cohort of 351 people in Côte d’Ivoire. We used the model to estimate the time from seroconversion to ART initiation and the delay in ART initiation in a representative sample of 4154 HIV-infected people who started ART in Cameroon between 2007 and 2010.
Findings In Cameroon, the median CD4+ cell counts at ART initiation increased from 140 cells/μl (interquartile range, IQR: 66 to 210)
in 2007–2009 to 163 cells/μl (IQR: 73 to 260) in 2010. The estimated average time from seroconversion to ART initiation decreased from 10.4 years (95% confidence interval, CI: 10.3 to 10.5) to 9.8 years (95% CI: 9.6 to 10.0). Delay in ART initiation increased from 3.4 years (95% CI: 3.1 to 3.7) to 5.8 years (95% CI: 5.6 to 6.2).
Conclusion The estimated time to initiate ART and the delay in ART initiation indicate that progress in Cameroon is insufficient. These
indicators should help monitor whether public health interventions to accelerate ART initiation are successful.
a INSERM, Sorbonne Universités, UPMC Univ Paris 06, UMR_S 1136, Institut Pierre Louis d’Epidémiologie et de Santé Publique, F-75013, Paris, France. b INSERM, Université Bordeaux, Bordeaux, France.
c IRD, Université de Montpellier 1, Montpellier, France.
d Faculty of Medicine and Biomedical Sciences, University of Yaoundé, Yaoundé, Cameroon. e Programme PACCI, Abidjan, Côte d’Ivoire.
Correspondence to Virginie Supervie (email: virginie.supervie@inserm.fr).
Research
Delay in starting antiretrovirals, Cameroon Jacques DA Ndawinz et al.
living with HIV and who started ART in the month of October in the years 2007–2010 were reviewed to obtain sociodemographic and CD4+ cell count data, including gender, age at ART ini-tiation, date of ART initiation and CD4+ cell count before ART initiation. Most participants were women (2829, 68.1%), and median age at ART initiation was 35 years (Table 1).
The second data set can be obtained from an observational cohort including individuals with a known or reliably es-timated date of HIV seroconversion and repeated measurements of the CD4 cell count over time. As there was no such cohort study in Cameroon, we used data from a cohort of blood donors who had documented seroconversion between donations in Côte d’Ivoire (ANRS 1220 Primo-CI study).11,12 Blood donors had
been invited to participate if they met the following criteria: diagnosed with HIV during a blood donation; HIV-seronegative at the preceding donation; less than 36 months had elapsed since seroconversion. The date of serocon-version was estimated as the midpoint between the last negative and the first positive HIV test. We used data on 351 cohort participants in our analyses, with 3037 CD4+ cell count measurements before ART initiation or death; CD4+ cell counts obtained more than 10 years after seroconversion were discarded to avoid a selection bias for slow progressors. Me-dian age at seroconversion was 28.8 years and 60.7% (213) were men (Table 2).
The median time between the last negative and first positive HIV test was 8.5 months and the median time from seroconversion to inclusion into the cohort was 9.0 months. The median CD4+ cell count at cohort inclusion was 450 cells/μL and the median number of CD4+ cell measurements per individual was eight.
Blood samples from the partici-pants were collected at inclusion into the cohort and every six months thereafter to measure the CD4+ cell count.
Analyses
The analysis was completed in three steps. First, we modelled the natural decline in CD4+ cell counts in HIV-infected indi-viduals who had not yet received ART, us-ing data from the seroconversion cohort. Second, we used the model to estimate the average time from seroconversion to eligibility for ART in this cohort. Third, we used the model and data on CD4+ cell
counts at ART initiation in Cameroon to estimate the average time between seroconversion and ART initiation in Cameroon. Then, we calculated the delay in ART initiation in Cameroon by sub-tracting the average time between HIV seroconversion and ART eligibility from the average time between HIV serocon-version and ART initiation.
We first used a linear mixed model13
to describe the natural decline in CD4+ cell numbers in ART-naïve HIV-infected individuals with estimated dates of HIV seroconversion and repeated measure-ments of the CD4+ cell count over time. To take into account the correlation of repeated measurements in a given in-dividual, the parameters were allowed to vary from one individual to another through a random intercept and slope. CD4+ cell count data were square-root
transformed to normalize their distri-bution.14 The model equations are as
follows: 0 1 0 1 1 0 0 1 1 1 0 1 4 4 4 ... ... ij i i ij ij i ij k ijk i i ij k ijk i CD CD t CD x x b x x b β ε α α α β β β β ⎧ = + + ⎪⎪ = + + + + ⎨ ⎪ = + + + + ⎪⎩ (1) where CD4ij is the CD4+ cell count measured at the jth visit of the ith indi-vidual, CD4i0 is the estimated CD4+ cell count at HIV seroconversion, defined as time 0 in the model; βi1 is the CD4+ cell count slope; tij is the interval from
the estimated date of seroconversion to the jth visit; and εij is the residual error.
Table 1. Characteristics of people living with HIV who started antiretroviral treatment,
and had a measure of CD4+ cell count at treatment initiation, Cameroon 2007–2010
Characteristic People who started ART
n = 4154
Number of women (%) 2829 (68.1)
Median age at ART initiation, years (IQR) 35.0 (29.0 to 43.0)
Median CD4+ cell count at ART initiation, cells/μL (IQR)
2007–2009 All 140 (66 to 210) Women 147 (73 to 215) Men 123 (53 to 198) 2010 All 163 (73 to 260) Women 170 (78 to 263) Men 147 (69 to 239)
ART: antiretroviral therapy; HIV: human immunodeficiency virus; IQR: interquartile range.
Notes: People included in the study were older than 15 years and started ART in the month of October each year. The ART eligibility threshold was 200 cells/μL in 2007–2009 and 350 cells/μL in 2010.
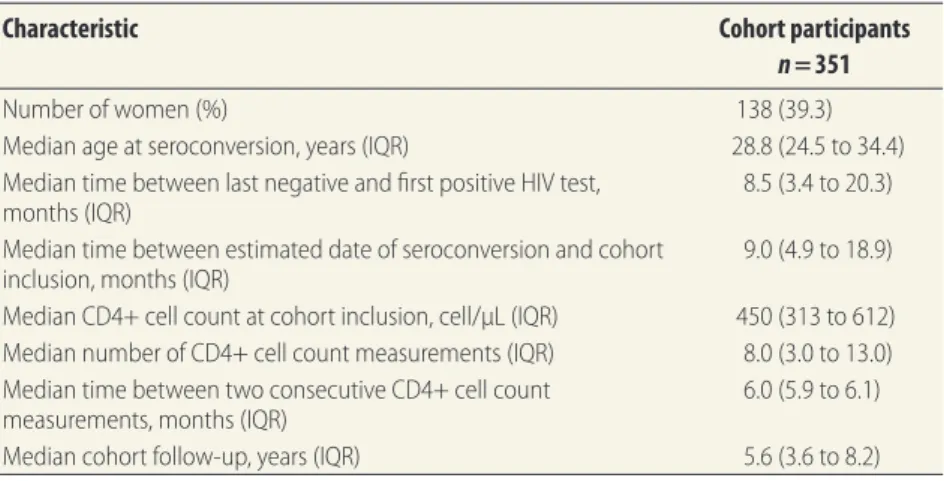
Table 2. Characteristics of ANRS 1220 Primo-CI cohort participants in Côte d’Ivoire
Characteristic Cohort participants
n = 351
Number of women (%) 138 (39.3)
Median age at seroconversion, years (IQR) 28.8 (24.5 to 34.4) Median time between last negative and first positive HIV test,
months (IQR) 8.5 (3.4 to 20.3)
Median time between estimated date of seroconversion and cohort
inclusion, months (IQR) 9.0 (4.9 to 18.9)
Median CD4+ cell count at cohort inclusion, cell/μL (IQR) 450 (313 to 612) Median number of CD4+ cell count measurements (IQR) 8.0 (3.0 to 13.0) Median time between two consecutive CD4+ cell count
measurements, months (IQR) 6.0 (5.9 to 6.1)
Median cohort follow-up, years (IQR) 5.6 (3.6 to 8.2) HIV: human immunodeficiency virus; IQR: interquartile range.
Both the CD4+ cell count at sero-conversion and the CD4+ slope may be influenced by covariates. xijk represents the kth covariate; αk and βk are
respec-tively the fixed-effect intercept and slope for the kth covariate; α0 and β0 are respectively the baseline intercept and slope; and bi0 and bi1 are respectively
the random intercept and slope for the ith individual.
εij, bi0 and bi1 were assumed to be normally distributed. The correlation between individual CD4+ cell counts at seroconversion and subsequent in-dividual slopes was handled through an unstructured covariance matrix of random effects.
From Equation (1), we derived the time from seroconversion to any given CD4+ cell count: CD E CD E x i i 4 40 1 −
(
)
( )
β (2)where CD4x is a given CD4+ cell count, E(√CD4i0) and E(βi1) are expected values of √CD4i0 (the square root of the CD4+
cell counts at seroconversion) and βi1, (rate of CD4+ cell count decline) ob-tained by fitting Equation (1) to data from seroconverters.
Second, we used Equation (2), to calculate, for each seroconverter, the time from seroconversion to specified CD4+ count thresholds. From these individual times we calculated the aver-age time from seroconversion to ART eligibility.
Third, we calculated the time from seroconversion to ART initiation, us-ing Equation (2), we need to know the CD4+ cell count at ART initiation, the CD4+ cell count at HIV seroconver-sion and the average rate of CD4+ cell count decline. Many HIV-infected individuals starting ART have only one available CD4+ cell count before ART initiation, because they are already eligible for ART when HIV infection is diagnosed. Thus, the CD4+ cell count at seroconversion and the rate of CD4+ cell count decline are both unknown. We generated the values of these two parameters for each HIV-infected individual starting ART by using data from seroconverters.11,12 Specifically, for
each individual included in the survey conducted in Cameroon, we simulated
200 sets of CD4+ cell count values at seroconversion and rates of CD4+ cell count decline, as follows. Square-root transformed values of the CD4+ cell count at HIV seroconversion and CD4+ cell count slopes in ANRS 1220 Primo-CI cohort participants were fitted with a joint bivariate normal distribution.15
This distribution was used to simulate the 200 sets of values for each surveyed individual. Using each set of values, along with CD4+ cell counts measured at ART initiation and Equation (2), we calculated, for each surveyed individual, 200 time intervals between seroconver-sion and ART initiation. We estimated the average time from seroconversion to ART initiation by averaging the results for each surveyed individual. Finally, we calculated the delay in ART initiation.
The eligibility for ART initiation in Cameroon was raised from 200 to 350 cells/μL in August 2010. We therefore calculated the average time from seroconversion to ART initiation and delay in ART initiation using the estimated average time from serocon-version to 200 cells/μL for individuals who initiated ART before August 2010. For individuals who initiated ART after August 2010, we used the estimated average time from seroconversion to 350 cells/μL.
To assess the robustness of our results, we performed sensitivity analy-ses which considered two scenarios of HIV virulence. First we assumed higher virulence leading to 5% lower CD4+ cell count at HIV seroconversion and 5% higher CD4+ cell count slope. Second we assumed lower virulence leading to 5% higher CD4+ count at HIV se-roconversion and 5% lower CD4+ cell count slope. These assumptions were motivated by findings that showed a 25% decrease in the CD4+ count at serocon-version over more than 20 years,16 while
our study only considered individuals who initiated ART between 2007 and 2010. We compared the results from the sensitivity analyses with the main estimates using the Z-test. All analyses were performed using Stata version 11.1 (StataCorp. LP, College Station, United States of America).
Results
Model fitting
By fitting the mixed model to the sero-converter data, we estimated that the
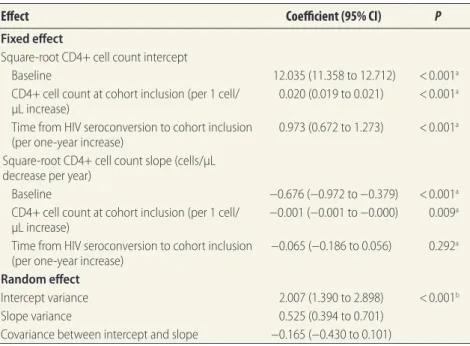
mean CD4+ cell count at seroconversion was 539 cells/μL (95% confidence inter-vals, CI: 516 to 562) and that the mean CD4+ cell decline in the first year after seroconversion was 53 cells/μL (95% CI: 51 to 56). Higher CD4+ cell counts at cohort inclusion and longer intervals from seroconversion to cohort inclusion were associated with higher CD4+ cell counts at seroconversion (P < 0.001;
Table 3). In addition, higher CD4+ cell counts at cohort inclusion were associ-ated with a more rapid CD4+ cell decline (P = 0.009; Table 3). None of the other covariates was significantly associated with the intercept or slope.
Time to ART eligibility
We replaced the parameters in Equa-tion (2) with their estimates from the previous step to calculate the time from HIV seroconversion to ART eligibility:
( )
(
)
( ) 1 1 1 4 12.035 0.973 0. 0.67 02 6 0.001 4 4 = / − − + − + i i x i i CD t CD t CD (3)where CD4x is the CD4+ cell count ART
eligibility threshold, ti1 is the estimated number of years from seroconversion to cohort inclusion, and CD4i1 is the CD4+ cell count at cohort inclusion.
The average times from seroconver-sion to CD4+ cell counts of less than 350 and 200 cells/μL were 4.0 and 7.0 years, respectively. The corresponding median times were 3.8 and 7.1 years (Table 4).
Cameroon indicators
Women had a higher CD4+ cell count at ART initiation than men (P < 0.001). The median CD4+ cell count at ART initiation increased significantly from 123 cells/μL in 2007–2009 to 147 cells/ μL in 2010 among men, and from 147 cells/μL in 2007–2009 to 170 cells/ μL in 2010 among women.
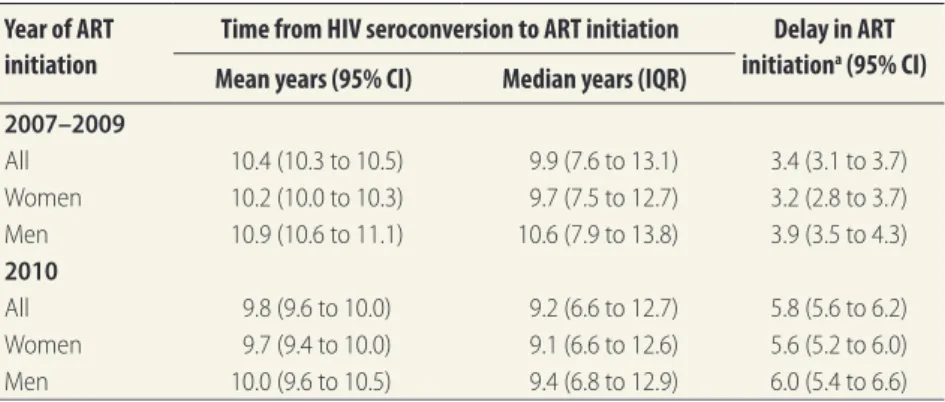
Time to ART initiation
The estimated average time from seroconversion to ART initiation fell from 10.4 years (95% CI: 10.3 to 10.5) in 2007–2009 to 9.8 years (95% CI: 9.6 to 10.0) in 2010 (Table 5); the corresponding median times were 9.9 and 9.2 years. The time was signifi-cantly shorter for women than men in 2007–2009 (10.2 versus 10.9 years, P < 0.01), while the difference was no
Research
Delay in starting antiretrovirals, Cameroon Jacques DA Ndawinz et al.
longer significant in 2010 (9.7 versus 10.0 years, P = 0.36).
Delay in ART initiation
The estimated delay in ART initiation is shown in Table 5. Overall, the delay increased from 3.4 years (95% CI: 3.1 to 3.7) in 2007–2009 to 5.8 years (95% CI: 5.6 to 6.2) in 2010. Women had shorter delays than men (3.2 versus 3.9 years in 2007–2009, and 5.6 versus 6.0 years in 2010).
Sensitivity analyses
The results from our sensitivity analy-sis are shown in Table 6. Assuming a
5% increase in HIV virulence led to a 1.1–1.3 year shorter average time from seroconversion to ART ini-tiation, corresponding to an 11–12% decrease (P < 0.0001). While assuming a 5% decrease in HIV virulence led to a 1.3–1.4 year longer average time, corresponding to an 11–14% increase (P < 0.0001). In contrast, the delay in ART initiation was not significantly changed under the two sensitivity analysis scenarios except for the over-all value in 2010 (P = 0.002) and the value among women in 2010 (P < 0.05), where we found a 9–10 % decrease when assuming a 5% increase in HIV
virulence and a 12–13% increase when assuming a 5% decrease in HIV virulence.
Discussion
Delays in starting ART are lost oppor-tunities for both the individual and the community. Therefore expanding ART programmes and accelerating ART initia-tion will be important to control the HIV epidemic. Here, we propose a method to estimate two new population-level indi-cators. Delay in ART initiation quantifies the loss of opportunity for people living with HIV. The time from HIV sero-conversion to ART initiation quantifies the number of years that HIV-infected individuals were able to transmit HIV.
Our approach requires two data sets. First, data on the natural history of the CD4+ cell count decline during HIV infection. Second, data on CD4+ cell counts at ART initiation among individuals who are representative of the population of interest. The first data set can be obtained from the cohort of seroconverters in a nearby country if not available in the country of interest. Such cohorts exist in low-, middle- and high-income countries.17,18 The second
data set is collected in most countries, as CD4+ cell count is an important pa-rameter for the decisions of ART initia-tion and clinical management,19 even in
countries implementing ART initiation regardless of CD4+ count levels. Thus, our approach can be used to estimate the delay in ART initiation in most settings. Our approach is based on two main assumptions. First, we converted CD4+ cell counts into time since HIV serocon-version. We assumed that individuals with low CD4+ cell counts had been infected with HIV longer than individu-als with high CD4+ cell counts. This is a reasonable assumption at the popula-tion level. Other studies have used a similar approach to estimate the time from seroconversion to ART eligibility at the population level.17,18 Second, we
assumed that all HIV-infected individu-als are eligible for ART only when the CD4+ threshold is reached. In reality, some individuals with symptomatic HIV disease are eligible for ART regardless of CD4+ cell count.3–5 Therefore, we may
have overestimated the average time from seroconversion to ART eligibility and thus underestimated the delay in ART initiation. We did not account for people that have not yet initiated ART
Table 3. Influence of selected characteristics of ANRS 1220 Primo-CI cohort participants
on the CD4+ cell count at seroconversion and its slope, as estimated from the linear mixed model
Effect Coefficient (95% CI) P
Fixed effect
Square-root CD4+ cell count intercept
Baseline 12.035 (11.358 to 12.712) < 0.001a
CD4+ cell count at cohort inclusion (per 1 cell/
μL increase) 0.020 (0.019 to 0.021) < 0.001
a
Time from HIV seroconversion to cohort inclusion
(per one-year increase) 0.973 (0.672 to 1.273) < 0.001
a
Square-root CD4+ cell count slope (cells/μL decrease per year)
Baseline −0.676 (−0.972 to −0.379) < 0.001a
CD4+ cell count at cohort inclusion (per 1 cell/
μL increase) −0.001 (−0.001 to −0.000) 0.009
a
Time from HIV seroconversion to cohort inclusion
(per one-year increase) −0.065 (−0.186 to 0.056) 0.292
a
Random effect
Intercept variance 2.007 (1.390 to 2.898) < 0.001b
Slope variance 0.525 (0.394 to 0.701)
Covariance between intercept and slope −0.165 (−0.430 to 0.101) CI: confidence interval; HIV: human immunodeficiency virus.
a Wald test.
b The likelihood ratio test rejected the null hypothesis that all coefficients were simultaneously equal to 0.
Note: The following variables: age at seroconversion, gender, CD4+ cell count at cohort inclusion and time from seroconversion to cohort inclusion, were initially included in the multivariable analysis. We used a backward stepwise selection procedure in the final model to retain only those covariates significantly associated (P < 0.05) with the intercept and slope.
Table 4. Estimated time from HIV seroconversion to ART eligibility HIV
sero-converters
2010 WHO ART eligibility thresholda 2006 WHO ART eligibility thresholdb
Mean years (95% CI) Median years (IQR) Mean years (95% CI) Median years (IQR) All 4.0 (3.7 to 4.3) 3.8 (2.0 to 5.7) 7.0 (6.8 to 7.3) 7.1 (5.2 to 8.8) Women 4.1 (3.6 to 4.5) 3.9 (2.2 to 5.9) 7.0 (6.6 to 7.4) 7.2 (5.3 to 8.7) Men 4.0 (3.6 to 4.3) 3.7 (1.9 to 5.7) 7.0 (6.7 to 7.4) 7.1 (5.2 to 8.9) ART: antiretroviral therapy; CI: confidence interval; HIV: human immunodeficiency virus; IQR: interquartile range; WHO: World Health Organization.
a The threshold is a CD4+ cell count less than 350 cells/μL. b The threshold is a CD4+ cell count less than 200 cells/μL.
or those who die before ART initiation. Furthermore, our approach does not account for what happens after ART initiation, such as treatment adherence.
In Cameroon, we found that the time between HIV seroconversion and ART initiation fell between 2007–2009 and 2010. However, the delay in ART
initiation increased during the same pe-riod because the ART eligibility thresh-old was lowered. We also found that women who started ART in 2007–2009 had shorter delays than men, whereas no significant sex difference was found in 2010. This reflects a small sex differ-ence in the CD4+ cell counts at ART initiation in 2010.
Limitations
As there was no available cohort of seroconverters in Cameroon, we used data from a cohort in Côte d’Ivoire. HIV type 1 (HIV-1) genetic diversity is high in Cameroon, while in Côte d’Ivoire, the HIV-1 CRF 02_AG variant predomi-nates.20,21 However, a study conducted
in Cameroon and Senegal showed no dif-ference in clinical progression between patients infected with CRF 02_AG and patients infected with other variants.22 In
addition, our estimates of the CD4+ cell count at seroconversion and the CD4+ cell count decline are similar to those ob-tained in other sub-Saharan countries,23
suggesting that any differences in disease progression at the population level would be small. Finally, it is conceivable that HIV has become more or less virulent over the course of the pandemic.16,24,25
Our sensitivity analyses showed that changes in HIV virulence affected the average time between HIV seroconver-sion and ART initiation, while the delay in ART initiation was less sensitive to assumptions about such changes.
The results from Cameroon show that some progress has been made in reducing late ART initiation. Changes in ART guidelines and decentralization of HIV care could have affected this decrease. In particular, as new guide-lines were introduced, patients in care with CD4+ cell counts above 200 cells/ μL could have become eligible for ART and thus received ART earlier. Likewise, decentralization of HIV care could have made ART available earlier at the rural level.10 However, the estimated time of
approximately 10 years to initiate ART and approximately 6 years for the delay in ART initiation indicate that the progress is insufficient and calls for interventions that accelerate ART initiation in Cameroon.
In conclusion, to optimize the con-trol of HIV infection both at individual and community level, ART initiation will need to accelerate to close the gap between the WHO-recommended and actual timing of ART initiation. The proposed indicators should help
moni-Table 5. Estimated time from HIV seroconversion to antiretroviral treatment initiation
and delay in antiretroviral treatment initiation, Cameroon, 2007–2010
Year of ART initiation
Time from HIV seroconversion to ART initiation Delay in ART initiationa (95% CI)
Mean years (95% CI) Median years (IQR)
2007–2009 All 10.4 (10.3 to 10.5) 9.9 (7.6 to 13.1) 3.4 (3.1 to 3.7) Women 10.2 (10.0 to 10.3) 9.7 (7.5 to 12.7) 3.2 (2.8 to 3.7) Men 10.9 (10.6 to 11.1) 10.6 (7.9 to 13.8) 3.9 (3.5 to 4.3) 2010 All 9.8 (9.6 to 10.0) 9.2 (6.6 to 12.7) 5.8 (5.6 to 6.2) Women 9.7 (9.4 to 10.0) 9.1 (6.6 to 12.6) 5.6 (5.2 to 6.0) Men 10.0 (9.6 to 10.5) 9.4 (6.8 to 12.9) 6.0 (5.4 to 6.6) ART: antiretroviral therapy; CI: confidence interval; HIV: human immunodeficiency virus; IQR: interquartile range.
a The delay in ART initiation was calculated by subtracting the average time from seroconversion to ART
eligibility from the average time between HIV seroconversion and ART initiation. Note: The ART eligibility threshold was 200 cells/μL in 2007–2009 and 350 cells/μL in 2010.
Table 6. Sensitivity analyses of estimated time from HIV seroconversion to
antiretroviral treatment initiation and delay in antiretroviral treatment initiation, Cameroon, 2007–2010
Year of ART initiation Time from HIV seroconversion to ART initiation
Delay in ART initiation (95% CI) Mean years (95% CI) Median years
(IQR) Scenario with increase in HIV virulencea 2007–2009 All 9.2 (9.0 to 9.3)*** 8.6 (6.5 to 11.6) 3.2 (3.0 to 3.4) Women 9.0 (8.8 to 9.1)*** 8.4 (6.5 to 11.3) 3.0 (2.8 to 3.2) Men 9.6 (9.4 to 9.8)*** 9.2 (6.8 to 12.3) 3.6 (3.4 to 3.8) 2010 All 8.6 (8.4 to 8.9)*** 7.9 (5.6 to 11.3) 5.2 (4.9 to 5.5)* Women 8.5 (8.2 to 8.7)*** 7.8 (5.5 to 11.2) 5.1 (4.8 to 5.4)* Men 8.9 (8.5 to 9.3)*** 8.3 (5.8 to 11.6) 5.5 (5.0 to 6.0) Scenario with decrease in HIV virulenceb 2007–2009 All 11.8 (11.6 to 11.9)*** 11.2 (8.7 to 14.8) 3.7 (3.5 to 3.9) Women 11.6 (11.4 to 11.7)*** 10.9 (8.6 to 14.4) 3.5 (3.3 to 3.7) Men 12.3 (12.0 to 12.6)*** 11.9 (9.0 to 15.6) 4.2 (3.9 to 4.5) 2010 All 11.1 (10.9 to 11.4)*** 10.4 (7.5 to 14.4) 6.5 (6.2 to 6.8)** Women 11.0 (10.7 to 11.3)*** 10.2 (7.4 to 14.3) 6.3 (5.9 to 6.7)* Men 11.4 (10.9 to 11.9)*** 10.8 (7.8 to 14.7) 6.8 (6.2 to 7.4) ART: antiretroviral treatment; CI: confidence interval; HIV: human immunodeficiency virus; IQR: interquartile range; *P < 0.05; **P < 0.02; ***P < 0.0001.
a We assumed 5% lower CD4+ count at HIV seroconversion and 5% higher CD4+ cell count slope. b We assumed 5% higher CD4+ count at HIV seroconversion and 5% lower CD4+ cell count slope.
Research
Delay in starting antiretrovirals, Cameroon Jacques DA Ndawinz et al.
tor whether public health interventions are successful in achieving these goals. ■ Acknowledgements
We thank the Agence nationale de recherche sur le sida et les hépatites virales (ANRS) 1220 Primo-CI Group, the trained interviewers and supervi-sors and the medical staff from the following HIV treatment facilities: Medical Unit (MU) Baptist Nkwen, MU Cameroon Baptist Church Mboppi Douala, MU St Luc Mbalmayo, MU Police Yaoundé, MU District Hospital Mbengwi, MU St Vincent Dschang, MU Baptist Muntengene, District Hospital (DH) Ambam, Accredited Treatment Centre (ATC) Bertoua, MU DH Poli, MU DH Ayos, MU DH Ny-lon, ATC General Hospital Yaoundé, MU Presbyterian Church Sakbayeme, MU DH Messamena, MU DH Ba-touri, ATC Gynaecology-Obstetrics-Pediatrics Hospital Yaoundé, MU St
Albert-Le-Grand Douala, MU Mary Health Fontem, MU DH Foumban, MU DH Yabassi, ATC Ngaoundéré, ATC Ebolowa, MU DH Tombel, ATC Foundation Chantal Biya Yaoundé, MU Foundation Chantal Biya Meyomes-sala, MU Catholic Tokombéré, MU DH Guider, MU DH Cité Palmiers Douala, MU DH Bangoua, MU Baptist Banso-Kumbo, ATC Bamenda, MU DH Kumba, MU DH Nkambe, MU DH Mfou, ATC Laquintinie Douala, MU DH New-Bell Douala, MU Pres-byterian Church Djoungolo Yaoundé, ATC Central Hospital Yaoundé, ATC Maroua, MU Ad Lucem Mbouda, MU DH Biyem-Assi Yaoundé, MU DH Ndi-kinimeki, ATC Limbe, ATC Garoua, ATC Bafoussam, ATC Jamot Yaoundé, MU DH Meiganga, MU DH Meyomes-sala, MU DH Kolofata, MU DH Bafut, MU DH Ebebda, MU Ad Lucem Efok, MU DH Bogo and MU Centre Médico-Social University Ngaoundéré.
Authors are also affiliated as follows: XA, Programme ARNS Coopération Côte d’Ivoire (PACCI), Abidjan, Côte d’Ivoire; ED, Department of Infec-tious and Tropical Diseases, University Hospital, F-34000, Montpellier, France; SKS, Infectious Disease Unit, Yaoundé Central Hospital, Yaoundé, Cameroon; DG, Programme PACCI, Abidjan, Côte d’Ivoire; AM Centre Médical de Suivi de Donneurs de Sang (CMSDS), Abidjan, Côte d’Ivoire.
Funding: This work was supported by Si-daction (AI-20-3/01649 and postdoctoral fellowship to VS), ANRS (postdoctoral fellowship to VS) and the French Minis-try of Education, Research and Technol-ogy (PhD fellowship to JDAN).
Competing interests: None declared.
صخلم
نويرماكلاب ةصالخا تاريدقتلا :ةيرقهقلا تاسويرفلا تاداضم مادختساب جلاعلا ءدب في رخأتلا لىع ةلاد ةديدج تاشرؤم
جلاع لىع لوصلحا ةبقارلم ةديدج تاشرؤ��م حار��قا ضرغلا
ةمواقلم )ART( ةيرقهقلا تاسويرفلا تاداضم مادختساب
ذنم ةينمزلا ةرفلا )1( ؛)HIV( يشربلا ةعانلما زوع سويرف
ءدب ىتح )هل ةداضم ماسجأ روهظ( HIV لصم ةيلعافت بلاقنا
،هيف ءدبلا ىتح ART �ل لهأتلا ذنم ةينمزلا ةرفلا )2(و ،ART
لصوتلا مت يتلا ميقلا مييقتو . ARTءدب في رخأتلاب هيلإ راشلماو
.نويرماكلا في تاشرؤلما هذه لضفب اهيلإ
جذومن لىإ لوصولل يطلخا فوحتلا بولسأ انمدختسا ةقيرطلا
CD4+ ةئف نم ةيئاتلا ةيفمللا ايلالخا دادعأ في يعيبطلا ضافخنلال
ةعانلما زوع ضرمب ينباصلما صاخشلأا في ) CD4+ ةئف ايلاخ(
لضفب ضرغلل اًبسانم جذومنلا ناكو .تقولا رورم عم يشربلا
صاخشلأا نم ةعوممج نم اهيلع لوصلحا مت تانايب مادختسا
اذه انمدختسا دقو .راوفيد توك في ا ًصخش 351 مهددع غلبي
نم ARTءدبو لصلما ةيلعافت بلاقنا ينب ةرفلا ريدقتل جذومنلا
كلذو ،ىرخأ ةيحان نم ART ءدب في رخأتلا ةرف ريدقتو ةيحان
في ARTاوأدب نمم اًباصم 4154 لمشت ضىرلما لثتم ةنيع في
.2010و 2007 ينب ةرفلا في نويرماكلا
CD4+ ةئف ايلالخا دادعتل ةميقلا طيسو نويرماكلا في داز جئاتنلا
66 :يعيبرلا ىدلما( رل وركيم/ةيلخ 140 نم ART ءدب دنع
رل وركيم/ةيلخ 163 لىإ 2009 – 2007 نم ةرفلا في )210 لىإ
طسوتم ضفخناو .2010 ماع في )260 لىإ 73 :يعيبرلا ىدلما(
نم ARTءدب ىتح لصلما ةيلعافت بلاقنا ذنم ةينمزلا ةرفلا
لىإ )10.5 لىإ 10.3 :95% اهرادقم ةيحجرأ ةبسنب( ماع 10.4
دازو .)10.0 لىإ 9.6 :95% اهرادقم ةيحجرأ ةبسنب( ماع 9.8
:95% اهرادقم ةيحجرأ ةبسنب( ماع 3.4 نم ART ءدب في رخأتلا
:95% اهرادقم ةيحجرأ ةبسنب( ما��ع 5.8 لىإ )3.7 لىإ 3.1
.)6.2 لىإ 5.6
رخأتللو ART ءدبل ةردقلما ةينمزلا ةرفلا يرشت جاتنتسلاا
يفي لا نويرماكلا في جلاعلا في مدقتلا نأ لىإ ART ءدب في
ةبقارم لىع تاشرؤلما هذه دعاست نأ ضرفلما نمو .تاجايتحلااب
ART ءدبب عاسرلإل ةماعلا ةحصلا لامج في تلاخدتلا تناك ام اذإ
.لعفلاب ةحجان
摘要
抗逆转录病毒治疗的开始时间延迟的新指标 : 喀麦隆境内的估计值 目的 为监控人类免疫缺陷病毒 (HIV) 的抗逆转录病毒 治疗 (ART) 情况而提出两个新指标 ;(i) 从 HIV 血清 转化到 ART 开始的时间,和 (ii) 从 ART 合格到开始 的时间,也称为 ART 开始时间延迟。 旨在评价喀麦 隆境内这些指标值。 方法 我们用线性回归法建立了 HIV 感染者体内的 CD4+ T 淋巴细胞(CD4+ 细胞)数在一段时间内呈自 然递减的模型。 该模型拟合从科特迪瓦境内 351 名 人员中采集的数据。 我们以在喀麦隆境内于 2007 年 至 2010 年期间接受 ART 的 4154 名 HIV 患者为代表性 样本,采用该模型来估计血清转化到 ART 开始的时间 以及 ART 开始时间的延迟。 结 果 在 喀 麦 隆 境 内,ART 开 始 时 的 CD4+ 细 胞 计 数中值从 2007 年至 2009 年的 cells/μl(四分位差 :IQR: 66 至 210)增加至 2010 年的 163cells/μl(IQR:
73 至 260)。从血清转化到 ART 开始的估计平均时间
从 10.4 年(95% 置 信 区 间,CI: 10.3 至 10.5) 下 降 至 9.8 年(95% CI: 9.6 至 10.0)。 ART 的开始时间延 迟从 3.4 年(95% CI: 3.1 至 3.7)增加至 5.8 年(95% CI:
结论 开始 ART 的预计时间和 ART 开始时间的延迟表
明喀麦隆境内并未取得足够的进步。 这些指标应有助 于监控公共卫生干预措施是否能够成功加快 始时间。 ART 的开
Résumé
Nouveaux indicateurs pour mesurer le retard dans l’accès au traitement antirétroviral: estimations pour le Cameroun
Objectif Proposer deux nouveaux indicateurs pour évaluer l’accès au
traitement antirétroviral (TAR) contre le virus de l’immunodéficience humaine (VIH): (i) le délai entre la séroconversion au VIH et le début du TAR, et (ii) le délai entre l’éligibilité au TAR et le début du TAR, appelé «délai écoulé avant le début du TAR». Estimer l’utilité de ces indicateurs au Cameroun.
Méthodes Nous avons utilisé une régression linéaire pour modéliser
le déclin naturel au fil du temps du nombre de lymphocytes T CD4+ (cellule CD4+) chez les individus infectés par le VIH. Le modèle a été conçu à l’aide de données provenant d’une cohorte de 351 individus de Côte d’Ivoire. Nous l’avons utilisé pour estimer le délai entre la séroconversion et le début du TAR ainsi que le retard dans l’accès au TAR sur un échantillon représentatif de 4154 individus infectés par le VIH ayant commencé un TAR au Cameroun entre 2007 et 2010.
Résultats Au Cameroun, le taux médian de CD4+ au début du TAR
est passé de 140 cellules 140 cellules/μl (intervalle interquartile, IQR: de 66 à 210) en 2007–2009 à 163 cellules/μl (IQR: de 73 à 260) en 2010. Le délai moyen estimé entre la séroconversion et le début du TAR est passé de 10,4 années (intervalle de confiance, IC, à 95%: de 10,3 à 10,5) à 9,8 années (IC à 95%: de 9,6 à 10,0). Le retard dans l’ accès au TAR est passé de 3,4 années (IC à 95%: de 3,1 à 3,7) à 5,8 années (IC à 95%: de 5,6 à 6,2).
Conclusion Les estimations du délai entre la séroconversion et le
début du TAR et du retard dans l’accès au TAR indiquent que les progrès accomplis au Cameroun sont insuffisants. Ces indicateurs devraient aider à évaluer l’efficacité des interventions de santé publique visant à accélérer l’accès au TAR .
Резюме
Новые показатели задержки начала антиретровирусной терапии: оценка для Камеруна
Цель Предложить два новых показателя для контроля доступности антиретровирусной терапии (АРВТ), предназначенной для лечения вируса иммунодефицита человека (ВИЧ): (i) время от сероконверсии ВИЧ до начала АРВТ и (ii) время с момента определения соответствия пациента критериям назначения АРВТ до начала терапии, называемое задержкой начала АРВТ. Оценить значения данных показателей в Камеруне. Методы Было смоделировано естественное снижение с течением времени числа T-лимфоцитов CD4+ (клеток CD4+) у инфицированных ВИЧ при помощи линейной регрессионной модели. Модель корректировалась с использованием данных когорты из 351 человека в Кот-д’Ивуаре. Модель применялась для оценки временного отрезка между сероконверсией и началом АРВТ, а также задержки начала АРВТ в репрезентативной выборке из 4154 ВИЧ-инфицированных, начавших АРВТ в Камеруне в период между 2007 и 2010 гг. Результаты В Камеруне медианное число клеток CD4+ в начале АРВТ увеличилось с 140 клеток/μл (межквартильный размах, МКР: 66–210) в 2007–2009 гг. до 163 клеток/μл (МКР: 73–260) в 2010 г. Выявленное среднее время от сероконверсии до начала АРВТ сократилось с 10,4 года (95% доверительный интервал, ДИ: 10,3–10,5) до 9,8 года (95% ДИ: 9,6–10,0). Задержка начала АРВТ увеличилась с 3,4 года (95% ДИ: 3,1–3,7) до 5,8 года (95% ДИ: 5,6–6,2). Вывод Полученные значения времени начала АРВТ и задержки начала АРВТ указывают на недостаточный прогресс в Камеруне. Эти показатели должны помочь в оценке успешности мероприятий в области здравоохранения, направленных на ускорение начала АРВТ.Resumen
Nuevos indicadores de retraso en el inicio del tratamiento antirretroviral: estimaciones para Camerún
Objetivo Proponer dos nuevos indicadores para monitorear el acceso
al tratamiento antirretroviral (TAR) para el virus de la inmunodeficiencia humana (VIH); (i) el tiempo desde la seroconversión del VIH al inicio del TAR, y (ii) el tiempo desde la elegibilidad del TAR al inicio del mismo, referido como retraso en el inicio del TAR. Estimar los valores de estos indicadores en Camerún.
Métodos Se utilizó la regresión lineal para modelizar la disminución
natural de la cantidad de linfocitos T CD4+ (célula CD4+) en los individuos infectados por el VIH con el tiempo. El modelo se adaptó utilizando datos de una cohorte de 351 individuos en Côte d’Ivoire. Se utilizó el modelo para estimar el tiempo entre la seroconversión y el inicio del TAR y el retraso en el inicio del TAR en una muestra representativa de 4.154 individuos infectados por el VIH que iniciaron el TAR en Camerún entre 2007 y 2010.
Resultados En Camerún, la media del recuento de células CD4+ en
el inicio del TAR creció de 140 células/μl (rango intercuartílico, RIC: de 66 a 210) en 2007-2009 a 163 células/μl (RIC: de 73 a 260) en 2010. El tiempo medio estimado desde la seroconversión hasta el inicio del TAR descendió de 10,4 años (intervalo de confianza, IC, del 95%: de 10,3 a 10,5) a 9,8 años (IC del 95%: de 9,6 a 10,0). El retraso en el inicio del TAR aumentó de 3,4 años (IC del 95%: de 3,1 a 3,7) a 5,8 años (IC del 95%: de 5,6 a 6,2).
Conclusión El tiempo estimado para iniciar el TAR y el retraso en el
inicio del TAR indican que el progreso en Camerún es insuficiente. Estos indicadores deberían ayudar a monitorizar si las intervenciones de salud pública para acelerar el inicio del TAR son eficaces.
Research
Delay in starting antiretrovirals, Cameroon Jacques DA Ndawinz et al.
References
1. Cohen MS, Chen YQ, McCauley M, Gamble T, Hosseinipour MC, Kumarasamy N, et al.; HPTN 052 Study Team. Prevention of HIV-1 infection with early antiretroviral therapy. N Engl J Med. 2011 Aug 11;365(6):493–505. doi: http://dx.doi.org/10.1056/NEJMoa1105243 PMID: 21767103 2. Severe P, Juste MA, Ambroise A, Eliacin L, Marchand C, Apollon S, et al.
Early versus standard antiretroviral therapy for HIV-infected adults in Haiti. N Engl J Med. 2010 Jul 15;363(3):257–65. doi: http://dx.doi.org/10.1056/ NEJMoa0910370 PMID: 20647201
3. Antiretroviral therapy for HIV infection in adults and adolescents: recommendations for a public health approach, 2006 revision. Geneva: World Health Organization; 2006. Available from: http://www.who.int/hiv/ pub/guidelines/artadultguidelines.pdf [cited 2015 March 22].
4. Antiretroviral therapy for HIV infection in adults and adolescents: recommendations for a public health approach, 2010 revision. Geneva: World Health Organization; 2010. Available from: http://www.who.int/hiv/ pub/arv/adult2010/en/ [cited 2015 March 22].
5. Consolidated guidelines on the use of antiretroviral drugs for treating and preventing HIV infection: recommendations for a public health approach. Geneva: World Health Organization; 2013. Available from: http://apps.who. int/iris/bitstream/10665/85321/1/9789241505727_eng.pdf [cited 2015 March 22].
6. The GAP report. Geneva: UNAIDS; 2014. Available from: http://www.unaids. org/en/resources/campaigns/2014/2014gapreport/gapreport/ [cited 2015 March 22].
7. Lahuerta M, Ue F, Hoffman S, Elul B, Kulkarni SG, Wu Y, et al. The problem of late ART initiation in Sub-Saharan Africa: a transient aspect of scale-up or a long-term phenomenon? J Health Care Poor Underserved. 2013 Feb;24(1):359–83. doi: http://dx.doi.org/10.1353/hpu.2013.0014 PMID: 23377739
8. Lahuerta M, Wu Y, Hoffman S, Elul B, Kulkarni SG, Remien RH, et al.; Multi-level determinants of late ART initiation in sub-Saharan Africa Team and; Identifying Optimal Models of HIV Care in sub-Saharan Africa Collaboration. Advanced HIV disease at entry into HIV care and initiation of antiretroviral therapy during 2006–2011: findings from four sub-saharan African countries. Clin Infect Dis. 2014 Feb;58(3):432–41. doi: http://dx.doi. org/10.1093/cid/cit724 PMID: 24198226
9. Johnson LF, Boulle A. How should access to antiretroviral treatment be measured? Bull World Health Organ. 2011 Feb 1;89(2):157–60. doi: http:// dx.doi.org/10.2471/BLT.10.080911 PMID: 21346928
10. Ndawinz JD, Chaix B, Koulla-Shiro S, Delaporte E, Okouda B, Abanda A, et al. Factors associated with late antiretroviral therapy initiation in Cameroon: a representative multilevel analysis. J Antimicrob Chemother. 2013 Jun;68(6):1388–99. doi: http://dx.doi.org/10.1093/jac/dkt011 PMID: 23391713
11. Minga A, Danel C, Abo Y, Dohoun L, Bonard D, Coulibaly A, et al. ANRS 1220 Study Group. Progression to WHO criteria for antiretroviral therapy in a 7-year cohort of adult HIV-1 seroconverters in Abidjan, Côte d’Ivoire. Bull World Health Organ. 2007 Feb;85(2):116–23. doi: http://dx.doi.org/10.2471/ BLT.06.032292 PMID: 17308732
12. Minga AK, Lewden C, Gabillard D, Bomisso GI, Toni TD, Emième AA, et al.; Agence Nationale de Recherches sur le Sida (ANRS) 1220 Primo-CI Study Group. CD4 cell eligibility thresholds: an analysis of the time to antiretroviral treatment in HIV-1 seroconverters. AIDS. 2011 Mar 27;25(6):819–23. doi: http://dx.doi.org/10.1097/QAD.0b013e32834625d3 PMID: 21412060 13. Laird NM, Ware JH. Random-effects models for longitudinal data.
Biometrics. 1982 Dec;38(4):963–74. doi: http://dx.doi.org/10.2307/2529876 PMID: 7168798
14. Taylor JM, Law N. Does the covariance structure matter in longitudinal modelling for the prediction of future CD4 counts? Stat Med. 1998 Oct 30;17(20):2381–94. doi: http://dx.doi.org/10.1002/(SICI)1097-0258(19981030)17:20<2381::AID-SIM926>3.0.CO;2-S PMID: 9819834 15. Balakrishna N, Lai C. Chapter 11: Bivariate normal distribution. In:
Balakrishna N, Lai C, editors. Continuous bivariate distributions. 2nd ed. New York: Springer; 2009. pp. 478–561.
16. Pantazis N, Porter K, Costagliola D, De Luca A, Ghosn J, Guiguet M, et al. Temporal trends in prognostic markers of HIV-1 virulence and transmissibility: an observational cohort study. Lancet HIV. 2014;1(3):e119– 26. doi: http://dx.doi.org/10.1016/S2352-3018(14)00002-2
17. Lodi S, Phillips A, Touloumi G, Geskus R, Meyer L, Thiébaut R, et al.; CASCADE Collaboration in EuroCoord. Time from human immunodeficiency virus seroconversion to reaching CD4+ cell count thresholds <200, <350, and <500 Cells/mm3: assessment of need following changes in treatment guidelines. Clin Infect Dis. 2011 Oct;53(8):817–25. doi: http://dx.doi. org/10.1093/cid/cir494 PMID: 21921225
18. Wandel S, Egger M, Rangsin R, Nelson KE, Costello C, Lewden C, et al.; Eligibility for ART in lower income countries (eART-linc) collaboration. Duration from seroconversion to eligibility for antiretroviral therapy and from ART eligibility to death in adult HIV-infected patients from low and middle-income countries: collaborative analysis of prospective studies. Sex Transm Infect. 2008 Aug;84 Suppl 1:i31–6. doi: http://dx.doi.org/10.1136/ sti.2008.029793 PMID: 18647863
19. Ford N, Meintjes G, Pozniak A, Bygrave H, Hill A, Peter T, et al. The future role of CD4 cell count for monitoring antiretroviral therapy. Lancet Infect Dis. 2015 Feb;15(2):241–7. doi: http://dx.doi.org/10.1016/S1473-3099(14)70896-5 PMID: 25467647
20. Hemelaar J, Gouws E, Ghys PD, Osmanov S; WHO-UNAIDS Network for HIV Isolation and Characterisation. Global trends in molecular epidemiology of HIV-1 during 2000–2007. AIDS. 2011 Mar 13;25(5):679–89. doi: http:// dx.doi.org/10.1097/QAD.0b013e328342ff93 PMID: 21297424
21. Lihana RW, Ssemwanga D, Abimiku A, Ndembi N. Update on HIV-1 diversity in Africa: a decade in review. AIDS Rev. 2012 Apr-Jun;14(2):83–100. PMID: 22627605
22. Laurent C, Bourgeois A, Faye MA, Mougnutou R, Seydi M, Gueye M, et al. No difference in clinical progression between patients infected with the predominant human immunodeficiency virus type 1 circulating recombinant form (CRF) 02_AG strain and patients not infected with CRF02_AG, in Western and West-Central Africa: a four-year prospective multicenter study. J Infect Dis. 2002 Aug 15;186(4):486–92. doi: http:// dx.doi.org/10.1086/341833 PMID: 12195375
23. Pantazis N, Morrison C, Amornkul PN, Lewden C, Salata RA, Minga A, et al.; CASCADE Collaboration in EuroCoord and ANRS 1220 Primo-CI Study Group. Differences in HIV natural history among African and non-African seroconverters in Europe and seroconverters in sub-Saharan Africa. PLoS ONE. 2012;7(3):e32369. doi: http://dx.doi.org/10.1371/journal. pone.0032369 PMID: 22412867
24. Herbeck JT, Müller V, Maust BS, Ledergerber B, Torti C, Di Giambenedetto S, et al. Is the virulence of HIV changing? A meta-analysis of trends in prognostic markers of HIV disease progression and transmission. AIDS. 2012 Jan 14;26(2):193–205. doi: http://dx.doi.org/10.1097/ QAD.0b013e32834db418 PMID: 22089381
25. Payne R, Muenchhoff M, Mann J, Roberts HE, Matthews P, Adland E, et al. Impact of HLA-driven HIV adaptation on virulence in populations of high HIV seroprevalence. Proc Natl Acad Sci USA. 2014 Dec 16;111(50):E5393– 400. doi: http://dx.doi.org/10.1073/pnas.1413339111 PMID: 25453107