HAL Id: hal-01314815
https://hal.archives-ouvertes.fr/hal-01314815
Submitted on 29 May 2020
HAL is a multi-disciplinary open access archive for the deposit and dissemination of sci-entific research documents, whether they are pub-lished or not. The documents may come from teaching and research institutions in France or abroad, or from public or private research centers.
L’archive ouverte pluridisciplinaire HAL, est destinée au dépôt et à la diffusion de documents scientifiques de niveau recherche, publiés ou non, émanant des établissements d’enseignement et de recherche français ou étrangers, des laboratoires publics ou privés.
Mediterranean heat waves
A Bérard, T Bouchet, G Sévenier, A. Pablo, R Gros
To cite this version:
A Bérard, T Bouchet, G Sévenier, A. Pablo, R Gros. Resilience of soil microbial communities impacted by severe drought and high temperature in the context of Mediterranean heat waves. European Journal of Soil Biology, Elsevier, 2011, 7 (6), pp.333-342. �10.1016/j.ejsobi.2011.08.004�. �hal-01314815�
Version postprint
nuscript Manuscrit d’auteur
/ Author manuscript Manuscrit
d’auteur / Author manuscript
Resilience of soil microbial communities impacted by severe drought and high
1
temperature in the context of Mediterranean heat-waves
2
Bérard A.1*, Bouchet T.1, Sévenier G.1, Pablo A.L.2, Gros R.3
3
1 UMR INRA/UAPV 1114 Emmah (Environnement Méditerranéen et Modélisation des
Agro-4
Hydrosystèmes) Site Agroparc 84914 Avignon Cédex 9, France 5
2 UMR Eco&Sols (Ecologie Fontionnelle & Biogéochimie des Sols) Place Viala (Bt. 12),
6
34060, Montpellier cedex 1, France 7
3 UMR CNRS 6116 IRD, IMEP (Institut Méditerranéen d’Ecologie et de Paléoécologie)
8
Service 452, Faculté des Sciences et Techniques de Saint-Jérôme, Université Paul Cézanne 9
Aix-Marseille 3, 13397, Marseille cedex 20, France 10 * Corresponding author 11 mail : annette.berard@paca.inra.fr 12 phone : +33 (0)4 32 72 22 28 13 fax : +33 (0)4 32 72 22 12 14 Abstract 15
In the context of Climate Change, the increasing of frequency and intensity of droughts and 16
heat-waves constitutes a serious threat for agroecosystems in the Mediterranean region. Soils 17
and their functions may be impacted by these extreme events through changes in the biomass, 18
composition and activities of edaphic microbial communities. We designed an experiment to 19
investigate changes over time in the microbial biomass, composition (EL FAME profiles) and 20
functions (catabolic responses) after severe drought and high temperature disturbances. 21
Impacts were assessed using indoor soil microcosms under controlled drought and high 22
temperatures, mimicking various stress scenarios and durations in conditions of severe 23
Version postprint
nuscript Manuscrit d’auteur
/ Author manuscript Manuscrit
d’auteur / Author manuscript
drought and heat wave. Drought and heat wave restructured the soil microbial communities 24
over the course of the experiment. This may be a consequence of inhibition and/or killing of 25
sensitive species and selection of tolerant species by the disturbances applied, but also of the 26
proliferation of fast growing species after environmental soil conditions had been restored. 27
Heating dry soil at 50°C had a stronger effect than only drying. Moreover, above a critical 28
threshold of heat wave duration, soil microbial communities may have undergone a drastic 29
biomass killing and restructuring associated with a shift in physiological traits. In this 30
experimental context, resilience of microbial catabolic functions was not observed and in 31
consequence ecosystem processes such as carbon mineralization and sequestration in soil may 32
be affected. 33
Key words: microbial community structure, soil, drought, heat-wave, substrate-induced
34
respiration, resilience 35
1. Introduction
36
Global warming circulation models predict changes in spatial and temporal patterns of 37
precipitation, including shifts in the frequency and intensity of droughts and heat-waves [1,2]. 38
This is especially true in the Mediterranean region [3]. In August 2003, a large part of 39
Western Europe, including France, was affected by a heat wave of exceptional duration, 40
intensity and geographical extent. Its impacts were drastic, including the death of thousands 41
of people, and considerable effects on ecosystems and agricultural production [4]. Extreme 42
climatic events may be more important drivers of ecosystem functionning than mean 43
conditions [5,4]. Soils and their functions may be impacted by these events through changes 44
in soil temperature, water content and nutrient dynamics [6]. 45
Soil microbial communities are highly diverse in their composition and play an essential role 46
Version postprint
nuscript Manuscrit d’auteur
/ Author manuscript Manuscrit
d’auteur / Author manuscript
nutrient mobilization [7]. Recent studies suggested the importance of microbial diversity for 48
soil functioning, and if the processes that determine the rate, at which microbial services are 49
ensured, are starting to be identified, changes in microbial communities due to environmental 50
factors (i.e. temporal shifts in temperature and soil moisture), and their link with soil 51
metabolic functioning should be more investigated [8]. In particular, the impact of stresses or 52
disturbances on soil resilience (i.e. recovery over time after a stress in comparison to control) 53
are of particular importance, in order to understand how compositional shifts changes may 54
affect soil processes and thus ecosystem services [9]. 55
Several studies have shown the separate impacts of soil moisture and climate warming on 56
biogeochemical cycles, and on the composition and activities of microbial communities 57
[10,11,12]. However, the combined effects of changes in temperature and moisture have been 58
less investigated [13], in particular, to evidence the impact of extreme events such as severe 59
droughts and heat waves in temperate soil ecosystems [14], in relation with their intensity and 60
duration. If these disturbances exceed a critical threshold the community may exhibit a 61
dramatic change in composition that would prevent activities from fully recovering [15]. In 62
consequence, soil processes such as organic matter decomposition and nutrient cycling may 63
be durably affected resulting in a loss of ecosystem functions and services [4]. 64
There is a need to investigate more systematically the long-term impact of severe drought and 65
heat wave on the soil microbial community, particularly in Mediterranean soils as they may 66
be more affected. The aims of this study were to assess both short-term responses and 67
changes over time of soil microbial biomass, composition and catabolic functions to various 68
disturbances. These disturbances were studied using soil microcosms under controlled 69
drought and high temperatures, mimicking various scenarios and durations in conditions of 70
severe drought and heat wave. We hypothesised (1) that the effects of drying-heating on soil 71
microbial communities may be greater than the effects of drying alone, and (2) that the 72
Version postprint
nuscript Manuscrit d’auteur
/ Author manuscript Manuscrit
d’auteur / Author manuscript
disturbance duration may increase shifts in microbial taxonomic structure decreasing recovery 73
of catabolic functions and carbon allocation. 74
2. Materials and methods
75
2.1. Soil
76
The soil selected for this study was a Mediterranean agricultural cambisol. The soil-sampling 77
site was a conventionally farmed pea field (INRA-Avignon, South Eastern France, 43° 54' 57'' 78
N and 4° 52' 58'' E) and had received no chemical treatment in the month preceding soil 79
sampling. Soil was sampled (25/03/08) from the 0-20 cm depth, with 20 soil cores (5 cm 80
diameter) taken at random around the field and pooled (14.9% gravimetric water content). 81
Following collection, visible soil organisms, roots and plant debris were removed and soil 82
sample was air-dried. After drying (duration less than 24 hours), the soil was sieved to obtain 83
homogenized 2-3 mm-sized aggregates (6.6% gravimetric water content). 84
The soil is a fine calcareous silty clay loam with a texture of 326 g kg-1 clay, 270 g kg-1 silt 85
and 33 g kg-1 sand. The soil aggregates contained 11.6 g organic C kg-1 soil, 1.42 g total N kg -86
1 soil and 365 g CaCO3kg-1 soil, and had a pH (water) value of 8.37. Water holding capacity
87
(WHC = 31.4%) of the soil aggregates was measured as the gravimetric water content of 10 g 88
of soil fully saturated with water and then left to stand for half an hour in a filter funnel filled 89
with glass wool. 90
2.2. Experimental design
91
Before the experiment, soil aggregates were slowly capillary-wetted and maintained at -0.01 92
MPa (21.4 % water content) on a suction table for 2 weeks at ambient temperature (25°C +/- 93
2) and in the dark, to ensure uniform initial conditions. 94
The soil was divided (50 g of aggregates) between 62 Petri boxes (9 cm diameter 95
microcosms, partitioned in 14 controls and 8 microcosms per treatment). The following 96
Version postprint
nuscript Manuscrit d’auteur
/ Author manuscript Manuscrit
d’auteur / Author manuscript
treatments were then performed: (1) Control (C) soil incubated at constant conditions (-0.01 97
MPa, 25°C), (2) soil subjected to drying disturbance (D) (-10 MPa, 4.5 % water content) and 98
incubated at 25°C (mimicking a severe drought alone), (3) soil subjected to drying-heating 99
disturbance (D-H) (-10 MPa, 4.5 % water content) and incubated at 50°C (mimicking a severe 100
drought combined to an heat wave). All treatments were conducted in darkness and at a 101
constant temperature, with each microcosm placed in a dessicator inside an incubator. The 102
dessicators were opened every 3 days to ensure aerobic conditions and soil water contents in 103
the microcosms were regularly checked by gravimetric measurements (if necessary, water 104
content was adjusted by gently spraying water into microcosms). 105
The total duration of the experiment from application of the stress was 84 days. 106
The experimental conditions were applied as follows (Fig. 1): 107
Microcosms of control soils (C) previously equilibrated to -0.01 MPa water potential were 108
kept at 25°C +/-1 in a control-dessicator with a beaker containing free water to maintain high 109
air humidity, throughout the course of the experiment (84 days). For the drying and drying-110
heating treatments, the soils in the microcosms were rapidly adjusted to water content close to 111
the target water potential of -10 MPa. This was done by increasing airflow over a silica 112
desiccant, at a temperature of 25°C. The microcosms were then divided between two drought-113
dessicators. The bottom of each drought-dessicator contained a saturated aqueous solution of 114
potassium nitrate salt that controlled the air humidity, a water potential of -10 MPa was 115
maintain in the soil microcosms [16]. One drought-dessicator was then placed in an incubator 116
at 25°C +/-1 (treatment D) and the other in an incubator at 50°C +/-1 (treatment D-H). Three 117
durations of treatment were then chosen: (1) Two days, which is the time scale of most 118
drying-rewetting experiments (e.g. [17]), (2) 7 days, which corresponds to a “heat wave” for 119
climatologists, (3) 21 days, which was the actual duration of the 2003 heat wave in the area of 120
the sampled field (Avignon, France). After each treatment duration, treated soils were 121
Version postprint
nuscript Manuscrit d’auteur
/ Author manuscript Manuscrit
d’auteur / Author manuscript
rewetted and placed under the same conditions as those of the controls (-0.01 MPa, 25°C) 122
until the end of the experiment. 123
The short-term impacts (resistance) and long term ones (resilience) after restoration of the 124
microbial parameters in the treated soils were compared to the controls [9]. Resistance of 125
microbial communities was evaluated 2 days after the end of disturbance. Several studies 126
showed that resilience varies according to the type and duration of stress applied (e.g. 127
[18,19]), and in the case of drying and rewetting stress, Fierer and Schimel [20] observed no 128
functional resilience 6 weeks after the end of stress. We then have chosen experiment 129
duration of 84 days (corresponding to 63 days after the end of the longest disturbance 130
applied). Resilience of microbial communities was finally evaluated on the day corresponding 131
to 3 times the disturbance duration after end of disturbance (i.e. 6-day resilience for 2-day 132
treatments, which means sampling at day 8 of experiment; 21-day resilience for 7-day 133
treatments, sampling at day 28 of experiment; and 63-day resilience for 21-days treatments, 134
sampling at day 84 of experiment). Soils were sampled and analyzed just before and after 135
restoration of control conditions, and at different dates until the end of the experiment: 6 to 8 136
g of moist soil were collected in four randomly selected microcosms from each treatment 137
scenario (the remaining soil of the microcosm was further incubated, after weighting). 138
Dissolved organic carbon (DOC) analysis and substrate-induced respiration (SIR) giving 139
community-level physiological profiling (CLPP) were performed immediately after sampling; 140
fatty acid (EL-FAME) extractions and analysis were performed subsequently on deep-frozen 141
soils (-25°C). 142
To confirm the results obtained from our experiment, it was repeated on the same soil with 143
the higher disturbance D-H-21, compared to control. DOC and CLPP measurements were 144
then performed at two sampling dates (23 and 84 days from start of stress) for this repeat 145
experiment. 146
Version postprint
nuscript Manuscrit d’auteur
/ Author manuscript Manuscrit
d’auteur / Author manuscript
2.3. Soil chemical and microbial properties
147
2.3.1. Total dissolved organic C (DOC) 148
Two g of the fresh soil were extracted with 10mL of 0.5M K2SO4 for one hour on a shaker.
149
K2SO4 extracts were filtered through 0.45 mm filters and analyzed for extractable C
150
(Shimadzu TOC-5050A total organic C analyzer). 151
2.3.2 Soil respiration and Community Level Physiological Profiles (CLPP) on substrate-152
induced respiration 153
Basal (BR) and substrate-induced soil respiration (SIR) were assessed using the MicroRespTM 154
system of Campbell et al. [21], consisting of a 96-deep-well microplate (Nunc 278012 1.2mL 155
volume) filled with soil and addition of water only (BR) or aqueous carbon substrates (SIR), 156
sealed individually to a colorimetric CO2-trap microplate. Mineralization of 11 carbon
157
substrates was tested for CLPP: four carbohydrates (glucose, sucrose, trehalose and 158
cellulose); 3 amino acids (glycine, alanine and arginine); 3 carboxylic acids (malic acid, and 2 159
phenolic acids: caffeic acid and ellagic acid) and a phenol (catechol). The carbon substrates 160
were selected for ecological relevance: Relevant to soil agro-ecosystems (i.e. plant residues, 161
root exudates etc.), involved in desiccation tolerance (osmolytes like sucrose, trehalose and 162
glycine [14]), and differentially mineralized. The carbon substrates were prepared in order to 163
add 30 mg of C per mLof soil water into each deep well. Substrates that did not readily 164
dissolve in water (caffeic acid and ellagic acid) were supplied at a concentration of 15 mg C 165
mL_1 soil water. Stock solutions of the carbon substrates were adjusted to soil pH (pH 8.4)
166
using NaOH or HCl to avoid any substrate-pH effects on microbial communities and to 167
minimize chemical artefacts due to carbonate-derived CO2. The concentration of the reactants
168
in the Cresol Red gel detector CO2-trap microplate was the same as described by Campbell et
169
al. [21]. Each deep-well microplate was sealed to the CO2-trap microplate with a silicone joint
170
(MicroRespTM, UK) and incubated in the dark at 25°C. CO
2-trap absorbance was measured at
Version postprint
nuscript Manuscrit d’auteur
/ Author manuscript Manuscrit
d’auteur / Author manuscript
590 nm with a spectrophotometer (HTS 7000 de Perkin Elmer) immediately before to sealing 172
to the microplates, and after 6 h incubation. A calibration curve of absorbance versus 173
headspace equilibrium CO2 concentration (measured by gas chromatography) was fitted to a
174
regression model. 175
The metabolic quotient qCO2 is the ratio of basal respiration (BR) to microbial biomass, and
176
is a sensitive ecophysiological indicator of soil stress induced by environmental conditions 177
[22]. Microbial biomass was determined by glucose-induced respiration (GIR) [23] with 178
MicroRespTM. We divided BR by GIR to obtain an index directly correlated to qCO2 but
unit-179
less. 180
2.3.3. Microbial community structure (EL-FAMEs) 181
We used microbial fatty acids to determine microbial structure. Fatty acid profiling provides 182
information on soil microbial biomass and community structure because phospholipids 183
(constituents of the cell membranes) are rapidly degraded after cell death and their relative 184
abundance differs between specific groups of microorganisms [24]. We performed the ester-185
linked fatty acid methyl esters (EL-FAMEs) method modified from [25] Schutter and Dick 186
2000. Three g of soil (three replicates) were extracted with 15 ml of 0.2 M KOH in methanol 187
(37°C, agitation, one hour). The pH of this buffer was neutralized with 2.65 ml of 1.0 M 188
acetic acid. The EL-FAMEs were extracted by adding 10 ml hexane, which was removed (5 189
ml) from the aqueous phase after centrifugation at 800xg for 20 min. The hexane was 190
evaporated under a stream of N2. EL-FAMEs were resuspended in 170 µl hexane with an 30
191
µl internal standard (methyl stearate 0.01 M, 18:0) and analyzed by gas chromatography (GC) 192
with an (GC Agilent 7890, USA). The GC capillary column was a medium polar cyanopropyl 193
column (DB 23) 60 m long, with an internal diameter of 0.25mm and film thickness of 194
0.15µm. Flame ionization detection (FID) was performed at a temperature of 280°C using 195
helium as a carrier gas at a flow rate of 30 ml min-1. Identification of the FAMEs was
Version postprint
nuscript Manuscrit d’auteur
/ Author manuscript Manuscrit
d’auteur / Author manuscript
performed automatically using the Agilent Chemstation software (Agilent, Inc., Palo Alto, 197
CA) in combination with the Agilent Retention Time Locking (RTL) library for FAMEs. The 198
FAME database was extended with a mixture of 24 microbial FAMEs (Bacterial Acid Methyl 199
Esters Mix 47080-U; Supelco, Inc.) and 10-Me16:0 (Matreya). Biomarkers of specific 200
functional groups were assigned according to classification of Frostegård et al. [25]. Iso- and 201
anteiso-fatty acids were taken as Gram-positive (G+) bacterial biomarkers (i15:0, a15:0, 202
i16:0, i17:0), and mono-unsaturated and cyclopropyl fatty acids (16:1ω7c, 17:0 cy, 18:1ω7c, 203
19:0 cy) as Gram negative (G-) bacterial biomarkers [26]. The FAMEs 18:2ω6c and 204
10Me16:0 were used as indicators for the fungi (FUNG) and actinobacteria (ACT) 205
populations respectively [26,24]. The sum of all FAMEs (nmol g-1dry soil) was used as an
206
estimate of microbial biomass. The ratio of saturated to unsaturated fatty acids 207
(SAT/UNSAT) was used as a stress indicator [27]. FAMEs that occurred as less than 5% of 208
all samples were excluded from the data set. 209
2.4. Data analysis
210
The values of the microbial parameters (BR, GIR, qCO2, EL-FAME biomarkers) and DOC 211
for the different treated soils were normalized to the control values % change from control 212
[28]. To compare treatments and disturbance duration impacts on microbial parameters and 213
DOC we applied non-parametric statistical procedures ([29]. Mann-Whitney tests were 214
performed on raw data to assess the difference between the control and treated microcosms; 215
Kruskal-Wallis tests and post hoc paired comparisons tests (Bonferroni) were performed on 216
% change from control to assess the difference between disturbance durations (n = 4 for SIR 217
measurements, BR and qCO2, n = 3 for DOC and EL-FAMEs measurements, the significance
218
level was set to 5%). Non-parametric redundancy discriminant analysis (RDA), followed by 219
a Monte Carlo permutation test (5000 random permutations; CANOCO 4.5 software; [30]) 220
were used to test the statistical significance of the explanatory variables (factors): disturbance 221
Version postprint
nuscript Manuscrit d’auteur
/ Author manuscript Manuscrit
d’auteur / Author manuscript
treatment-type, disturbance duration and recovery time (i.e. time elapsed between end of 222
disturbance and time of measurement), and the interactions between these factors on CLPPs 223
and EL-FAME data. The EL-FAMEs structural differences and CLPP functional community 224
differences between treated and control soils were described using the Bray-Curtis 225
dissimilarity index (BCI, [31]). 226
3. Results
227
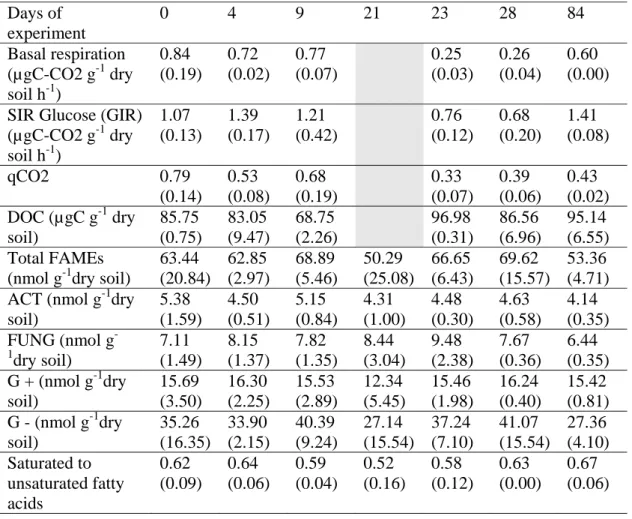
Mean values of biotic parameters and DOC of control soil are listed in the Table 1. 228
3.1. Soil respiration, metabolic qCO2 and DOC
229
Soil-microcosms subjected to disturbance lasting 21 days, whether drying (D) or drying-230
heating disturbance (D-H), showed changes in basal respiration (BR). Increased respiration 231
was detected 2 days after the end of the disturbance (Tab.2), with a maximum value of 0.88 232
µg CO2-C dw.g-1 h-1 for the D-H-21 disturbance treatment (compared to 0.25 µg CO2-C dw.g
-233
1 h-1 for the control at day 23, Tab.1). Basal respiration recovered to control values at
234
resilience-dates (0.60 µg CO2-C dwg-1 h-1 at day 84, Tab.1) for soil-microcosms subjected to
235
drying. For soil-microcosms subjected to a drying-heating disturbance no resilience was 236
apparent at the end of experiment and D-H soil-microcosms showed a decrease in BR 237
compared to the control (Mann-Whitney tests; p≤0.05, n=4) (Tab.2). 238
Except for the 7 days disturbance duration, disturbed soil showed a significant increase in 239
metabolic qCO2 two days after the end of the disturbance (Mann-Whitney test; p≤0.05; n=4)
240
(Fig. 2. A-B), especially for the 21 days drying-heating disturbance (D-H-21). After that, 241
metabolic qCO2 decreased to control values over the course of the experiment, but remained
242
significantly higher for soil subjected to D-H-21 disturbance treatment (Mann-Whitney tests; 243
p≤0.05; n=4). DOC presented high concentrations in soil two days after the end of 244
Version postprint
nuscript Manuscrit d’auteur
/ Author manuscript Manuscrit
d’auteur / Author manuscript
disturbance (with a maximum of 136.7 µg C dw.g-1) and no recovery for D-H-21 disturbance 245
treatment (Mann-Whitney tests; p≤0.05; n=3) (Fig. 2. C-D). 246
Except for the resilience in qCO2 and DOC parameters of drying-disturbed soils, disturbance
247
durations (2, 7 and 21 days) have significant effects on % change relative to control of BR, 248
qCO2 (Kruskal-Wallis tests; p≤0.05; n=4) and DOC (Kruskal-Wallis tests; p≤0.05; n=3) in 249
term of both resistance and resilience (Tab.2, Fig.2). Generally, the longer the disturbance 250
duration, the greater the impact (especially with high-temperature disturbance on Basal 251
Respiration, Post hoc paired comparisons test p≤0.05). However, this pattern was not 252
straightforward. In some cases, 2-day disturbances had a stronger impact than 7-day 253
disturbances (i.e. qCO2 of drying-heating-disturbed soils, Post hoc paired comparisons test
254
p≤0.05) (Fig.2). 255
3.2. Community Level Physiological Profiles (CLPPs)
256
The redundancy analyses (RDA) performed on the MicroRespTM profiles (CLPPs) showed 257
that disturbance treatments (D and D-H), disturbance durations (2, 7 and 21 days) and post-258
disturbance recovery time, all had significant effects on the catabolic functions of the soil 259
microbial communities (Fig. 3). Moreover, Figure 3-A shows that disturbance duration 260
interacts significantly with the type of disturbance treatment: the longer the disturbance 261
duration the greater the changes in CLPPs, especially for dried-heated soils (D-H). Figure 3-B 262
shows that the differences between CLPPs in disturbed soils increase with post-disturbance 263
recovery time: Controls (C) differ sharply from the dried-heated soils (D-H), with the dried 264
soils (D) occupying an intermediate position on the factorial map. In terms of resistance and 265
resilience, the Bray and Curtis dissimilarity indices (BCI) confirm the RDA analyses. The 266
effects of disturbance duration on CLPP using BCI index were significant (Kruskal-Wallis 267
tests, p≤0.05, n=4), and the effects of disturbance treatment type were also significant for the 268
7-day and 21-day disturbances (Tab.2, Mann-Whitney tests, p≤0.05, n=4). 269
Version postprint
nuscript Manuscrit d’auteur
/ Author manuscript Manuscrit
d’auteur / Author manuscript
Soil respiration on osmolyte substrates (such as sucrose, trehalose and glycine) were not 270
differentially affected by the disturbances, compared to other substrate-induced respirations 271
(data not shown). 272
3.3. Microbial community structure (ELFAMEs)
273
The redundancy analysis (RDA) performed on the EL-FAMEs shows that disturbance 274
treatment interacts significantly with disturbance duration (7 and 21 days) (Fig 4-A): the 275
disturbance duration effect was particularly strong with the soils subjected to D-H 276
disturbance. Figure 4-B- shows that disturbance treatment also interacts significantly with 277
post-disturbance recovery time. And this was confirmed by the BCI performed on EL-278
FAMEs: the effects of the disturbance treatments on EL-FAMEs using BCI index were only 279
significant for the 21-day disturbances (Tab. 2, Mann-Whitney tests, p≤0.05, n=3). 280
The effects of D disturbances on the EL-FAME biomarkers differed from the effects of D-H 281
disturbances. The difference was particularly marked for the longest disturbance duration (21 282
days, Fig. 5). More precisely, the D-21 disturbance, just before rewetting the soil, had no 283
significant effect on the EL-FAME biomarkers (Fig. 5-A) except for G+ indicators, which 284
increased compared to the control (18.1% +/- 3.9). The short-term impact of drying/rewetting 285
(two days after rewetting at end of disturbance) was a decrease in EL-FAME biomarkers (Fig. 286
6-A), except for G+ indicators. Almost all EL-FAME biomarkers of D-21 soil had returned to 287
the level of the control soil by day 22 after the end of the drying disturbance and remained at 288
that level until the end of the experiment. The one exception was ACT, which decreased (-289
20.0% of control +/- 4.7, day 84). The D-H-21 disturbance, just before rewetting of the soil, 290
had various effects on the different EL-FAME biomarkers (Fig. 5-B). At this stage, there was 291
a strong decrease for FUNG (-72.8% +/- 26.5) and an increase for G+ indicators (17.3% +/- 292
2.9) compared to the control. Two days after rewetting and lowering the temperature, the 293
short-term impact of the D-H disturbance was a stronger decrease of G+ indicators and ACT, 294
Version postprint
nuscript Manuscrit d’auteur
/ Author manuscript Manuscrit
d’auteur / Author manuscript
and a weaker one for G- indicators and FUNG. All EL-FAME biomarkers in the D-H-21 soil 295
were lower than the control values. Over the course of the experiment some inhibited 296
microbial groups were stable (G- and FUNG) while others showed increased inhibition (G+ 297
and ACT). At day 84, ACT had completely disappeared (n = 3). No EL-FAME biomarkers in 298
the D-H-21 soil remained at the same level as in the control soil. 299
The saturated/unsaturated fatty acids ratio was raised by drought and heat wave disturbances 300
(Table 2), especially for the 21-day disturbances (at day 63 the SAT/UNSAT ratio of the D-301
H-21 soils was still high: 20.42). At the end of experiment the collapse (with a high 302
variability) of the SAT/UNSAT ratio of the D-H-21 soil was due to the collapse of all the 303
microbial biomass at this date (confirmed by total EL-FAMEs and SIR, Tab. 2). 304
4. Discussion
305
4.1. Consequences of severe drought and high temperature on both short and long-term
306
responses of soil microbial communities
307
The stimulation of the basal respiration two days after end of disturbance suggests an increase 308
in C substrate availability, which is often a limiting factor for both microbial growth and 309
activities, regardless the disturbance regime. The concomitant increase in DOC amounts 310
confirms this hypothesis. This process called “Birch-effect” [32] can be attributed to two 311
mechanisms [33]. One is the “substrate supply” mechanism; a physical disruption of soil 312
aggregates due to drying-rewetting cycle (and probably also heat; [34]), which releases soil 313
organic matter making it available to microorganisms [35,17]. The other is the “microbial 314
stress” mechanism; releases of two sources of microbial carbon after disturbance: (i) from 315
dead and lysed microbes due to drought, heat and rewetting [28], and (ii) from osmolyte 316
intracellular compounds synthesized during drying stress [17]. DOC from lysed microbes is 317
confirmed by an important decrease in microbial biomass (SIR Glucose and total EL-FAMEs) 318
Version postprint
nuscript Manuscrit d’auteur
/ Author manuscript Manuscrit
d’auteur / Author manuscript
for most of disturbance regimes. We were not able to show via our MicroRespTM 319
measurements on specific C substrates, if some drought-disturbed microbial communities 320
would be specifically adapted to mineralizing osmolyte substrates. Therefore in our case, the 321
microbial DOC mineralized after the disturbance may result mainly from cell death instead of 322
osmolyte release [32]. For the 2 and 7 days disturbance durations, the “Birch-effect” showed 323
two days after rewetting was slight, probably because of a beginning of resilience of the 324
pulses of CO2 and DOC after rewetting [17] in this Mediterranean soil adapted to frequent
325
wet/dry cycles. 326
At long term, a 21 days duration heat wave, in contrast to drought, dramatically impacted 327
microbial biomass (total EL-FAMEs amounts and SIR) suggesting a lasting overall impact 328
[36]. As we have seen, metabolic qCO2 recovered to control values after the disturbance in
329
drought soils but remained high until the end of the experiment in drought-heated soils. At 330
short-term, the high values of this BR to biomass ratio are a consequence of direct killing 331
biomass induced by both disturbance regimes. The qCO2 is also known to increase when
332
microbial communities divert a higher proportion of carbon source to maintenance-energy 333
requirements than to biosynthesis as a result of an exogenous disturbance [22]. The 334
physiological costs imposed on soil microorganisms [17], as well as direct killing of 335
microbial biomass especially by heat wave disturbances, may be great enough to cause at long 336
term shifts in the allocation and fate of carbon in the entire microbial community. 337
EL-FAME community structure measurements differentiated between the impacts of drought 338
and heat wave on the composition of the microbial community, with an intermediate effect 339
and resilience for soils subjected to drought, in contrast to soils subjected to heat wave, which 340
did not present resilience. Moreover, changes in CLPP also suggest differences of impact in 341
functional structure, concomitant to taxonomic shifts. 342
The decrease in the concentration of microbial EL-FAME biomarkers in treated D-21 soil two 343
Version postprint
nuscript Manuscrit d’auteur
/ Author manuscript Manuscrit
d’auteur / Author manuscript
days after restoration reveals the impact of an osmotic shock of re-wetting induced by 344
rewetting rather than a direct drying disturbance impact [12]. The exception of G+ organisms, 345
which were not inhibited by drying or by rewetting, may be explained by their thicker cell 346
walls, giving capacities of adaptation to changes in water potential [37]. Fungi, as well as 347
Actinobacteria, are known to be tolerant to drying [37], but in our study they were affected by 348
drying-rewetting because of their sensitivity to osmotic shock of rewetting [38,12]. 349
In the context of heat wave disturbance the restoration of environmental soil conditions 350
(rewetting and lowering temperature) also impacted drastically on microbial community 351
composition. G+ biomarkers were not impacted by the combination of high temperature and 352
drought (as shown at day 21). G+ i17 :0, which was the major EL-FAME biomarker of the 353
G+ group, indicates a bacterial group known to be thermophilic [27]. However, in contrast to 354
their behaviour in the dried-rewetted microcosms, in D-H microcosms the G+ group 355
presented sensitivity to rewetting and lowering temperature (from day 21 to day 23). 356
Actinobacteria (known to be sensitive to high temperatures; [27]) were dramatically impacted 357
by heat wave. The 50°C temperature disturbance combined with the osmotic shock of re-358
wetting probably impacted irreversibly on the biomass of this known K-strategist group. 359
Fungi (also known to be sensitive to high temperatures; [27]) were strongly impacted by heat 360
wave disturbance; if the restoration of environmental soil conditions did not induce further 361
inhibition of this microbial eukaryote group, we did not measure any resilience. In a recent 362
study on recovery of soil microbial community subjected to high temperatures, Barcela-363
Moreno and Bååth [39] showed that heating of soil shifted the recolonizing microbial 364
community from fungi towards bacteria. The G- EL-FAME biomarkers were impacted by 365
heat wave disturbance but stayed at the same concentration levels throughout the experiment 366
after restoration; they were thus the least inhibited group at the end of the experiment. Gram-367
negative bacteria like Proteobacteria are r-strategists (or copiotrophic, [40]) and their ability 368
Version postprint
nuscript Manuscrit d’auteur
/ Author manuscript Manuscrit
d’auteur / Author manuscript
to grow fast may have favoured their biomass stability, or even growth, as shown in the D-21-369
treated soil at the end of experiment. Similarly, Thompson et al. [41] observed high CO2-C
370
efflux correlated with the development of Proteobacteria in soils previously dried and 371
rewetted. 372
The increases in ratio of saturated to unsaturated fatty acids we measured in disturbed soils 373
may be attributed to rapid physiological adjustments by certain microorganisms and 374
especially to higher survival rates in drought and high temperature tolerant species compared 375
to others [27]. 376
However, one must bear in mind that the EL-FAME extraction method presents some 377
limitations for characterizing microbial communities in environmental samples 378
(contaminations with no microbial FAMEs, [24]). And because of possible conservation of 379
FAMEs on dead microbial cells in dry environmental conditions, this may have led us to 380
underestimate the impact of desiccation on the microorganisms [28]. 381
To sum up, the restructuring of microbial communities during the course of the experiment 382
after the end of heat wave disturbance may be a consequence of drastic impact on K strategic 383
sensitive species (i.e. Fungi and Actinobacteria), selection of tolerant species (i.e. G + 384
bacteria), and the development of fast-growing copiotrophic species (i.e. G - bacteria) after 385
the restoration of environmental soil conditions, stimulated by soil organic matter that had 386
become available from killing biomass and lack of competition. 387
Figure 6 presents a schematic representation of the soil microbial taxonomic and functional 388
responses to the heat wave (Fig. 6A) and drought (Fig. 6B) 21-day disturbances in the context 389
of our experiment. Drought and rewetting is characterized by a “Birch effect” and resilience 390
occurring about 30 days after the end of disturbance. This recovery suggests the low impact 391
of a severe drought on the physiological traits of this Mediterranean soil, which in situ was 392
frequently exposed to moisture stress. Moreover we have to take into account the soil air-393
Version postprint
nuscript Manuscrit d’auteur
/ Author manuscript Manuscrit
d’auteur / Author manuscript
drying and rewetting pre-treatment that may have induced microbial community selection 394
[42] and a previous “Birch effect” [17]. By contrast, heat-drought disturbance combined with 395
shock of rewetting during restoration conditions induced a drastic initial biomass death and 396
increased shifts in taxonomic and catabolic structure and carbon allocation until the end of 397
our experiment with no resilience. 398
4.2. Consequences of the different disturbance durations for microbial communities
399
Increasing disturbance duration have induced an increased release of available organic matter 400
(as measured in DOC after the end of disturbance) and favoured C mineralization, as we 401
observed increase in basal respiration two days after the end of the disturbance. 402
Resilience of microbial parameters was inversely related to duration of disturbance. This was 403
particularly true for heat wave disturbances because, as we described, no resilience was 404
observed in D-H-21 disturbed soils. Indeed in these soils a drastic restructuring of microbial 405
communities and a collapse of microbial biomass were observed during the course of the 406
experiment, whereas microbial resilience was observed in the D-H-7 disturbed soils. This 407
study suggests that drought and heat wave induced gradients of reduction in microbial 408
biomass and selection pressure related to the duration of disturbance (Fig. 6C). Banning and 409
Murphy [43] similarly observed that resilience of soil SIR to heat disturbance was positively 410
related to the size of the initial microbial biomass. Our results further suggest that there was a 411
critical threshold of heat wave duration (somewhere between 7 and 21 days) above which no 412
resilience of microbial parameters was observed. 413
In some cases the 2-day disturbed soils presented stronger reactions in their microbial 414
communities than the 7-day disturbed soils. This may be because less than two days of 415
desiccation directly followed by watering was not sufficient to increase the proportion of 416
inactivated or tolerant microorganisms (dormant state or spores) by starvation [35] and/or to 417
induce an adaptation of microorganisms at the colony scale (e.g. biosynthesis of protective 418
Version postprint
nuscript Manuscrit d’auteur
/ Author manuscript Manuscrit
d’auteur / Author manuscript
EPS by microcolonies, [44]). Such inactive, tolerant and adapted microorganisms may be less 419
susceptible to the effects of rewetting disturbance [12]. 420
Disturbance treatments and their duration were better differentiated during the course of the 421
experiment and at the end (resilience) than just after the end of the disturbance. Kuan et al. 422
[19] and Philippot et al. [45] observed, in studies respectively addressing the carbon and 423
nitrogen cycles, that resilience of microbial parameters could be an indicator of pre-exposure 424
to disturbance, but resistance was less. In some cases (especially the 21-day heat wave 425
treatments) we observed no resilience 63 days after restoration of environmental conditions. 426
Moreover, the disturbance seemed to have a lasting effect on some microbial parameters that 427
were dramatically altered by the end of experiment. Soil microbial communities may have 428
then undergone a drastic biomass killing inducing a shift in composition and a shift in 429
physiological traits (e.g. allocation of carbon demand for energy requirements versus growth) 430
as revealed by total EL-FAMEs, SIR and qCO2 measurements (Fig. 6). As a result, no
431
resilience seems to be possible [15]. 432
In conclusion, these results represent a contribution to the understanding of soil microbial 433
community dynamics in the context of Mediterranean heat-wave disturbance in terms of loss 434
of microbial biomass, shifts in community structure and carbon allocation [4]. However, our 435
study is limited to one soil (although representative of Mediterranean agricultural soils) and 436
our experimental conditions do not allow us to draw conclusions about the long-term 437
dynamics of changes in soil microbial communities beyond 63 days after the end of the 438
longest disturbance. We must take into account that our microcosm experiments probably 439
induced a confinement effect and no possibility of microbial re-colonization from unperturbed 440
soil [46], interaction with plant growth and recovery of soil carbon supply [47], which could 441
contribute to some recovery of microbial biomass and functions of our high-disturbed soils. A 442
Version postprint
nuscript Manuscrit d’auteur
/ Author manuscript Manuscrit
d’auteur / Author manuscript
next step for studying heat wave impacts on soil microbial communities will be to introduce 443
experimentally the possibility of re-colonization from the unperturbed soil. Moreover to 444
conclude forward about the specific effect of high temperature into a drought combined to 445
heat disturbance, further experiments should assess the effects of high temperature with and 446
without drought on soil microbial communities. 447
We also need further detailed analyses in terms of community diversity (e.g. complementary 448
FAMEs biomarkers as mycorrhizal indicators, biomolecular analysis as qPCR targeting 449
microbial groups) and functionality (e.g. bacterial and fungal contributions in carbon 450
allocation, [39]; soil enzyme activities targeting the C and N cycles, [11]). Incorporating this 451
knowledge into models would enhance our ability to predict soil ecosystem responses to 452
global climate change [15,13]. 453
5. Acknowledgements
454
This study benefited from the support of the “Soil – Aquifer Flux Experimental Facility” at 455
INRA-Avignon. The authors wish to thank the UE-EA (INRA-Avignon) for technical 456
assistance in the agricultural management of the crop field, and D. Renard and B. Bes for 457
their support with field sampling and their help with suction table manipulations. We would 458
like to thank P. Renault and C. Doussan for their encouragement and scientific advice. The 459
project received funding from the scientific department of Environment and Agronomy of 460
INRA (Projets Innovants). Harriet Coleman edited the English text. 461
6. References
462
[1] S. Solomon, D. Qin, M. Manning, Z. Chen, M. Marquis, K.B. Averyt, M. Tignor, H.L. 463
Miller (Eds.), Contribution of Working Group I to the Fourth Assessment Report of the 464
Intergovernmental Panel on Climate Change. Cambridge University Press, Cambridge, 465
United Kingdom and New York, NY, USA, 2007. 466
Version postprint
nuscript Manuscrit d’auteur
/ Author manuscript Manuscrit
d’auteur / Author manuscript
[2] S. Planton, M. Déqué, F. Chauvin, L. Terray, Expected impacts of climate change on 467
extreme climate events, C. R. Acad. Sci. Geoscience 340 (2008) 564-574. 468
[3] A. L. Gibelin, M. Déqué, Anthropogenic climate change over the Mediterranean region 469
simulated by a global variable resolution model, Clim. Dynam. 20 (2003) 327-339. 470
[4] M.L. Parry, O.F. Canziani, J.P. Palutikof, P.J. van der Linden and C.E. Hanson (Eds.), 471
Contribution of Working Group II to the Fourth Assessment Report of the 472
Intergovernmental Panel on Climate Change Cambridge University Press, Cambridge, 473
UK, 2007. 474
[5] J. L. Heisler, J.F. Weltzin, Variability matters: towards a perspective on the influence of 475
precipitation on terrestrial ecosystems, New Phytol. 172 (2006) 189-192. 476
[6] A.R. Mosier, Soil processes and global change. Biol. Fertil. Soils 27 (1998) 221-229. 477
[7] H.L. Reynolds, A. Packer, J.D. Bever, K. Clay, Grassroots ecology: Plant-microbe-soil 478
interactions as drivers of plant community structure and dynamics, Ecology 84 (2003) 479
2281-2291. 480
[8] C.W. Bell, V. Acosta-Martinez, N.E. McIntyre, S. Cox, D.T. Tissue, J.C. Zak, Linking 481
microbial community structure and function to seasonal differences in soil moisture and 482
temperature in a Chihuahuan desert grassland, Microb. Ecol. 58 (2009) 827-842. 483
[9] S.D. Allison, J. B. H. Martiny, Resistance, resilience, and redundancy in microbial 484
communities, PNAS 105 (2008) 11512-11519. 485
[10] B. Emmett, C. Beier, M. Estiarte, A. Tietema, H.L. Kristensen, D. Williams, J. Penuelas, 486
I. Schmidt, A. Sowerby, The response of soil processes to climate change: results from 487
manipulation studies of shrublands across an environmental gradient, Ecosystems 7 488
(2004) 625-637. 489
Version postprint
nuscript Manuscrit d’auteur
/ Author manuscript Manuscrit
d’auteur / Author manuscript
[11] J. Sardans, J. Peñuelas, M. Estiarte, Changes in soil enzymes related to C and N cycle 490
and in soil C and N content under prolonged warming and drought in a Mediterranean 491
shrubland, Appl. Soil Ecol. 39 (2008) 223-235. 492
[12] MA. Williams, Response of microbial communities to water stress in irrigated and 493
drought-prone tallgrass prairie soils, Soil Biol. Biochem. 39 (2007) 2750-2757. 494
[13] J.C. Yuste, D.D. Baldocchi, A. Gershenson, A. Goldstein, L. Misson, S. Wong, 495
Microbial soil respiration and its dependency on carbon inputs, soil temperature and 496
moisture, Glob. Change Biol. 13 (2007) 2018-2035. 497
[14] J. Schimel, T.C. Balser, M. Wallenstein, Microbial stress-response physiology and its 498
implications for ecosystem function, Ecology 88 (2007) 1386-1394. 499
[15] M. Scheffer, S. Carpenter, J.A. Foley, C. Folke, B. Walker, Catastrophic shifts in 500
ecosystems, Nature 413 (2001) 591-596. 501
[16] A. Schneider, Influence du pelliculage sur l’inhibition de semences de maïs, 502
Expérimentation et modélisation, Ph.D. thesis, Institut National Agronomique, Paris 503
(France), 1996. 504
[17] N. Fierer, J.P. Schimel, A proposed mechanism for the pulse in carbon dioxide 505
production commonly observed following the rapid rewetting of a dry soil, Soil Sc. Soc. 506
Am. J. 67 (2003) 798-805. 507
[18] A. Tlili, B. Montuelle, A. Bérard, A. Bouchez, Impact of chronic and acute pesticide 508
exposures on periphyton communities, Sci. Tot. Environ. 409 (2011) 2102-2113. 509
[19] H.L. Kuan, C. Fenwickb, L.A. Glover, B.S. Griffiths, K. Ritz, Functional resilience of 510
microbial communities from perturbed upland grassland soils to further persistent or 511
transient stresses, Soil Biol. Biochem. 38 (2006) 2300-2306. 512
[20] N. Fierer, J.P. Schimel, Effects of drying-rewetting frequency on soil carbon and 513
nitrogen transformations, Soil Biol. Biochem. 34 (2002) 777-787. 514
Version postprint
nuscript Manuscrit d’auteur
/ Author manuscript Manuscrit
d’auteur / Author manuscript
[21] C.D. Campbell, S.J. Chapman, C.M. Cameron, M.S. Davidson, J.M. Potts, A rapid 515
microtiter plate method to measure carbon dioxide evolved from carbon substrate 516
amendments so as to determine the physiological profiles of soil microbial communities 517
by using whole soil, Appl. Environ. Microbiol. 69 (2003) 3593-3599. 518
[22] T-H. Anderson, Microbial eco-physiological indicators to assess soil quality, Agr. 519
Ecosyst. Environ. 98 (2003) 285-293. 520
[23] J. P. E. Anderson, K. H. Domsch, A physiological method for the quantitative 521
measurement of microbial biomass in soil, Soil Biol. Biochem.10 (1978) 215-221. 522
[24] L. Zelles, Fatty acid patterns of phospholipids and lipopolysaccharides in the 523
characterisation of microbial communities in soil: A review, Biol. Fert. Soils 29 (1999) 524
111-129. 525
[25] M.E. Schutter, R.P. Dick, Comparison of fatty acid methyl ester (FAME) methods for 526
characterizing microbial communities, Soil Sci. Soc. Am. J. 64 (2000) 1659-1668. 527
[26] A. Frostegard, , E. Bååth, A. Tunlid, Shifts in the structure of soil microbial communities 528
in limed forests as revealed by phospholipid fatty-acid analysis, Soil Biol. Biochem. 25 529
(1993) 723-730. 530
[27] M. Klamer, E. Bååth, Microbial community dynamics during composting of straw material 531
studied using phospholipid fatty acid analysis, FEMS Microbiol. Ecol. 27 (1998) 9-20. 532
[28] G. Chaer, M. Fernandes, D. Myrold, P. Bottomley, Comparative resistance and resilience 533
of soil microbial communities and enzyme activities in adjacent native forest and 534
agricultural soils, Microb. Ecol. 58 (2009) 414-424. 535
[29] U. Dorigo, A. Bérard, F.Rimet, A. Bouchez, B. Montuelle, In situ assessment of 536
periphyton recovery in a river contaminated by pesticides, Aquat. Toxicol. 98 (2010) 537
396-406. 538
Version postprint
nuscript Manuscrit d’auteur
/ Author manuscript Manuscrit
d’auteur / Author manuscript
[30] C.J.F. ter Braak, P. Smilauer, CANOCO reference manual and user’s guide to CANOCO 539
for Windows®: software for canonical community ordination, Version 4.0.n 540
Microcomputer Power, Ithaca, New York, 1998. 541
[31] J. R. Bray, J.T. Curtis, An ordination of the upland forest communities of southern 542
Wisconsin, Ecol. Monog. 27 (1957) 325-349. 543
[32] W. Borken, E. Matzner, Reappraisal of drying and wetting effects on C and N 544
mineralization and fluxes in soils. Glob. Change Biol. 15 (2009) 808-824 545
[33] S-R. Xiang, A. Doyle, P. A. Holden, J. P. Schimel, Drying and rewetting effects on C 546
and N mineralization and microbial activity in surface and subsurface California 547
grassland soils, Soil Biol. Biochem. 40 (2008) 2281-2289. 548
[34] A. Prieto-Fernandez, M.J. Acea, T. Carballas, Soil microbial and extractable C and N 549
after wildfire, Biol. Fertil. Soils 27 (1998) 132-142. 550
[35] E.J. Lundquist, L.E. Jackson, K.M. Scow, Wet-dry cycles affect dissolved organic 551
carbon in two California agricultural soils, Soil Biol. Biochem. 31 (1999) 1031-1038. 552
[36] B.P. Degens, J. A. Harris, Development of a physiological approach to measuring the 553
catabolic diversity of soil microbial communities, Soil Biol. Biochem. 29 (1997) 1309-554
1320. 555
[37] E. Uhlirova, J. Elhottova, J. Triska, H. Santruckova, Physiology and microbial 556
community structure in soil at extreme water content, Folia Microbiol. 50 (2005) 161-557
166. 558
[38] H. Gordon, P.M. Haygart, R.D. Bardget, Drying and rewetting effects on soil microbial 559
community composition and nutrient leaching, Soil Biol. Biochem. 40 (2008) 302-311. 560
[39] G. Barcela-Moreno, E. Bååth, Bacterial and fungal growth in soil heated at different 561
temperatures to simulate a range of fire intensities, Soil Biol. Biochem. 41 (2009) 2517– 562
2526. 563
Version postprint
nuscript Manuscrit d’auteur
/ Author manuscript Manuscrit
d’auteur / Author manuscript
[40] N. Fierer, M. A. Bradford, R.B. Jackson, Toward an ecological classification of soil 564
bacteria, Ecology 88 (2007) 1354-1364. 565
[41] B.C. Thompson, N.J. Ostle, N.P. McNamara, A.S. Whiteley, R.I. Griffiths, Effects of 566
sieving, drying and rewetting upon soil bacterial community structure and respiration 567
rates, J. Microbiol. Meth. 83 (2010) 69-73 568
[42] N. Fierer, J.P. Schimel, P.A. Holden, Influence of drying-rewetting frequency on soil 569
bacterial community structure, Microb. Ecol. 45 (2003) 63-71. 570
[43] N. Banning, D.V. Murphy, Effect of heat-induced disturbance on microbial biomass and 571
activity in forest soil and the relationship between disturbance effects and microbial 572
community structure, Appl. Soil Ecol. 40 (2008) 109-119. 573
[44] D. Or, B.F. Smets, J.M. Wraith, A. Deschesne, S.P. Friedman, Physical constraints 574
affecting bacterial habitats and activity in unsaturated porous media – a review, Adv. 575
Water Res. 30 (2007) 1505-1527. 576
[45] L. Philippot, M. Cregut, D. Cheneby, M. Bressan, Dequiet, F. Martin-Laurent, L. 577
Ranjard, P. Lemanceau, Effect of primary mild stresses on resilience and resistance of 578
the nitrate reducer community to a subsequent severe stress, FEMS Microbiol. Let. 285 579
(2008) 51-57. 580
[46] S. Wertz, S. Czarnes, F. Bartoli, P. Renault, C. Commeaux, N. Guillaumaud, A. Clays-581
Josserand, Early-stage bacterial colonization between a sterilized remoulded soil clod 582
and natural soil aggregates of the same soil, Soil Biol. Biochem. 39 (2007) 3127-3137. 583
[47] R. Gros, L. Jocteur Monrozier, F. Bartoli, J.L. Chotte, P. Faivre, Relationships between 584
soil physicochemical properties and microbial activity along a chronosequence of 585
restored ski runs, Appl. Soil Ecol. 27 (2004) 7-22. 586
Version postprint
nuscript Manuscrit d’auteur
/ Author manuscript Manuscrit
d’auteur / Author manuscript
Figure 1: A schematic diagram (not to scale), illustrating the time course of drying 1
stressdisturbance and drying-heating stressdisturbance (simulating drought and heat wave events 2
respectively) and the soil water potentials during the experiment.: At day 0 of the experiment, the 3
stressdisturbance is applied. Diamonds represent sampling dates, triangles represent dates chosen 4
to represent short-term impacts resistance and scoares dates chosen to represent resilience. 5
6
Figure 2: Percentage change relative to control soils for qCO2 (Fig. 2A, Fig. 2B) and for DOC 7
(Fig. 2C, Fig. 2D), during the course of experiment (crosses indicate values from repeated 8
experiment;, day 23 DOC analyseis were lost). Vertical bars indicate the standard deviation (n=4 9
for qCO2 and n=3 for DOC values). 10
Stars (*) indicate significant difference between the control and treated microcosms (Mann-11
Whitney tests performed on the parameter raw data, p≤0.05). 12
13
Figure 3: Factorial maps and factors effects (F values and probability, * for p <0.05 and ** for 14
p<0.01) from redundancy analyses performed on CLPPs., Fig. 3A and considering as source of 15
variation as stressdisturbance treatment (C=control; D-25= Drying stressdisturbance; D-50H= 16
Drying- heating stressdisturbance) and disturbance duration (2; 7; and 21 days). Fig. 3B 17
considering source of variation as disturbance treatment and recovery time considered after the 18
disturbance (days 0 to 84 after the start of the disturbances). Each triangle and circle is the 19
barycentre coordinate from replicates of each perturbation treatment, perturbation duration or 20
recovery time.(Fig. 3A and Fig. 3B, representss the correlation plot between the RDA axes and 21
the carbon sources selected for SIR) or stress treatment and the recovery time considered after the 22
stress (Fig. 3C and Fig. 3D, represents the correlation plot between the RDA axes and the carbon
23
sources selected for SIR). [Pas très clair. Diviser en deux ou trios phrases?] 24
Mis en forme : Couleur de police :
Automatique
Mis en forme : Non Surlignage Mis en forme : Non Surlignage
Version postprint
nuscript Manuscrit d’auteur
/ Author manuscript Manuscrit
d’auteur / Author manuscript
25
Figure 4: Percentage change relative to control soils for respiration induced by substrate chemical 26
groups induced respiration. Treatments: 21-day dDrying 21 days duration stress treatment (D-27
25-21, Fig. 4A), drying-heating 21- day drying-heating s duration stress treatment (D-50-21, Fig. 28
4B). Open White symbols indicate values of the repeated experiment (Fig. 4B). Vertical bars 29
indicate the standard deviation (n=4). 30
31
Figure 54: Factorial maps and factor effects (F values and probability, * for p <0.05 and ** for 32
p<0.01) from redundancy analyses performed on EL-FAMEs. Fig. 4A considering source of 33
variation as disturbance treatment (C=control; D= Drying disturbance; D-H= Drying-heating 34
disturbance) and disturbance duration (7; and 21 days). Fig. 5B considering source of variation as 35
disturbance treatment and recovery time considered after the disturbance (days 0 to 84 after the 36
start of the disturbances). Each triangle and circle is the barycentre coordinate from replicates of 37
each perturbation treatment, perturbation duration or recovery time. 38
Factorial maps and factors effects (F values and probability, * for p <0.05 and ** for p<0.01) 39
from redundancy analyses performed on FAMEs, and considering as source of variation as stress 40
treatment and duration (Fig. 5A and Fig. 5B, represents the correlation plot between the RDA 41
axes and the FAMEs identified for more than 5%) or stress treatment and the evolution time
42
considered after the stress (Fig. 5C and Fig. 5D, represents the correlation plot between the RDA 43
axes and the FAMEs identified for more than 5%)). C=control; D-25= Drying stress; D-50=
44
Drying heating stress (7 and 21 days duration treatments). [En faire plusieurs phrases?] 45
46 47
Mis en forme : Non Surlignage Mis en forme : Non Surlignage
Version postprint
nuscript Manuscrit d’auteur
/ Author manuscript Manuscrit
d’auteur / Author manuscript
Figure 65: Percentage change relative to control soils microbial EL-FAME biomarkers.
48
Treatments: Drying 21-day drying days duration stressdisturbance treatment (D-25-21, Fig. 49
6A5A), drying-heating 21-day drying-heating days duration stressdisturbance treatment (D-50H-50
21, Fig. 56B). Vertical bars indicate the the standard deviation (n=3). 51
52
Figure 76: Schematic representation of the soil microbial community response to 21-day the heat
53
-wave stressdisturbance (Fig. 7A6A) and drought stressdisturbance (Fig. 7B6B) 21 days stresses. 54
Illustration of the impacts (measured at “resilience dates”) of stressdisturbance duration on soil 55
samples subjected mitted to heat wave (Fig. 7C6C). Resilience dates: day 8 for the 2 day-56
disturbance; day 28 for the 7 day-disturbance; day 84 for the 21 day-disturbance. 57
Version postprint 14 microcosms 25°C Control (C) 8 microcosms 25°C drying perturbation (D-2) drying perturbation (D 7) 8 microcosms 50°C drying-heating perturbation (D-H-2) 8 microcosms 25°C 8 microcosms 50°C drying perturbation (D-7) drying-heating perturbation (D-H-7) 8 microcosms 25°C drying perturbation (D-21) 8 microcosms 50°C drying-heating perturbation (D-H-21)
Version postprint
nuscript Manuscrit d’auteur
/ Author manuscript Manuscrit
d’auteur / Author manuscript
Table 1: Mean values of biotic parameters and DOC of control soil, measured during the experiment (standard deviation in brackets; n=3 for ELFAMEs and DOC, n=4 for respiration, SIR measurements and qCO2). FAMEs biomarkers of specific functional groups: Actinobacteria (ACT); Fungi (FUNG); Gram-positive bacteria (G+), Gram negative bacteria (G-).
Days of experiment 0 4 9 21 23 28 84 Basal respiration (µgC-CO2 g-1 dry soil h-1) 0.84 (0.19) 0.72 (0.02) 0.77 (0.07) 0.25 (0.03) 0.26 (0.04) 0.60 (0.00) SIR Glucose (GIR)
(µgC-CO2 g-1 dry soil h-1) 1.07 (0.13) 1.39 (0.17) 1.21 (0.42) 0.76 (0.12) 0.68 (0.20) 1.41 (0.08) qCO2 0.79 (0.14) 0.53 (0.08) 0.68 (0.19) 0.33 (0.07) 0.39 (0.06) 0.43 (0.02) DOC (µgC g-1 dry soil) 85.75 (0.75) 83.05 (9.47) 68.75 (2.26) 96.98 (0.31) 86.56 (6.96) 95.14 (6.55) Total FAMEs
(nmol g-1dry soil)
63.44 (20.84) 62.85 (2.97) 68.89 (5.46) 50.29 (25.08) 66.65 (6.43) 69.62 (15.57) 53.36 (4.71) ACT (nmol g-1dry
soil) 5.38 (1.59) 4.50 (0.51) 5.15 (0.84) 4.31 (1.00) 4.48 (0.30) 4.63 (0.58) 4.14 (0.35) FUNG (nmol g -1 dry soil) 7.11 (1.49) 8.15 (1.37) 7.82 (1.35) 8.44 (3.04) 9.48 (2.38) 7.67 (0.36) 6.44 (0.35) G + (nmol g-1dry soil) 15.69 (3.50) 16.30 (2.25) 15.53 (2.89) 12.34 (5.45) 15.46 (1.98) 16.24 (0.40) 15.42 (0.81) G - (nmol g-1dry soil) 35.26 (16.35) 33.90 (2.15) 40.39 (9.24) 27.14 (15.54) 37.24 (7.10) 41.07 (15.54) 27.36 (4.10) Saturated to unsaturated fatty acids 0.62 (0.09) 0.64 (0.06) 0.59 (0.04) 0.52 (0.16) 0.58 (0.12) 0.63 (0.00) 0.67 (0.06)
Version postprint
nuscript Manuscrit d’auteur
/ Author manuscript Manuscrit
d’auteur / Author manuscript
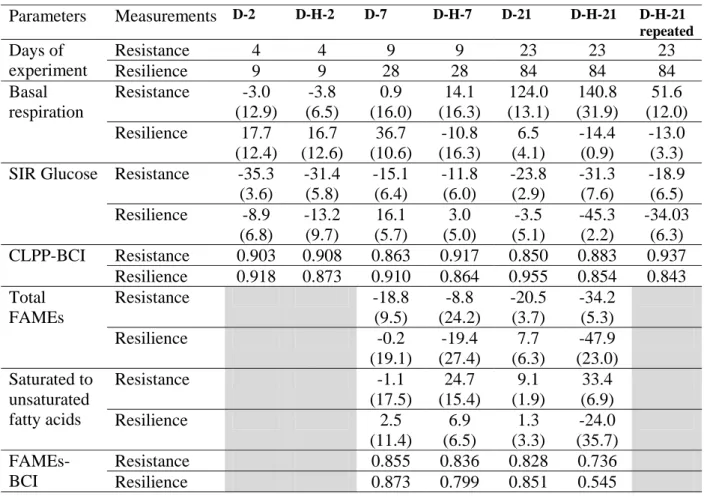
Table 2: Mean percentage change relative to control (standard deviation in brackets) for rate of soil respiration (n=4), SIR Glucose (n=4), concentration of total FAMEs (n=3), ratio saturated to unsaturated fatty acids (n=3) and Bray and Curtis Indices (BCI) for CLPP (n=4) and FAMEs (n=3), measured 2 days after the end of perturbation and 3 times perturbation duration after end of perturbation for Resistance and Resilience respectively.
Parameters Measurements D-2 D-H-2 D-7 D-H-7 D-21 D-H-21 D-H-21 repeated Days of experiment Resistance 4 4 9 9 23 23 23 Resilience 9 9 28 28 84 84 84 Basal respiration Resistance -3.0 (12.9) -3.8 (6.5) 0.9 (16.0) 14.1 (16.3) 124.0 (13.1) 140.8 (31.9) 51.6 (12.0) Resilience 17.7 (12.4) 16.7 (12.6) 36.7 (10.6) -10.8 (16.3) 6.5 (4.1) -14.4 (0.9) -13.0 (3.3) SIR Glucose Resistance -35.3
(3.6) -31.4 (5.8) -15.1 (6.4) -11.8 (6.0) -23.8 (2.9) -31.3 (7.6) -18.9 (6.5) Resilience -8.9 (6.8) -13.2 (9.7) 16.1 (5.7) 3.0 (5.0) -3.5 (5.1) -45.3 (2.2) -34.03 (6.3) CLPP-BCI Resistance 0.903 0.908 0.863 0.917 0.850 0.883 0.937 Resilience 0.918 0.873 0.910 0.864 0.955 0.854 0.843 Total FAMEs Resistance -18.8 (9.5) -8.8 (24.2) -20.5 (3.7) -34.2 (5.3) Resilience -0.2 (19.1) -19.4 (27.4) 7.7 (6.3) -47.9 (23.0) Saturated to unsaturated fatty acids Resistance -1.1 (17.5) 24.7 (15.4) 9.1 (1.9) 33.4 (6.9) Resilience 2.5 (11.4) 6.9 (6.5) 1.3 (3.3) -24.0 (35.7) FAMEs-BCI Resistance 0.855 0.836 0.828 0.736 Resilience 0.873 0.799 0.851 0.545
Version postprint 120 140 D-2 D-7 A 120 140 B D-H-2 D-H-7 drying disturbance drying-heating disturbance
rol 40 60 80 100 120 D 7 D-21 40 60 80 100 120 D H 7 D-H-21 D-H-21 repeated qCO2 ge from cont r -20 0 20 40 10 20 30 40 50 60 70 80 90 -20 0 20 40 10 20 30 40 50 60 70 80 90 % chan 40 50 60 C D 40 50 60 C 10 20 30 10 20 30 DO C
Experiment duration (days) -10 0 10 20 30 40 50 60 70 80 90 -10 0 10 20 30 40 50 60 70 80 90 p ( y )
Version postprint 1.0 R 63d 84d C D 43d 28d 23d 14d 63d 84d 43d28d .6 %) B Disturbance duration F=3.04* Interaction F=8.48** 21d 1.0 0 .9 %) D A 7d 21d Recovery time F=30.46** Interaction F 18 87** 0d 4d D-H 14d 43d28d23d 14d 4d 9d 63d 84d 43d28d 23d14d 4d Axis 2 (12 Disturbance treatment 2d 2d Axis 2 (1 0 D-H 7d 21d -1.5 1.0 -1.0 Disturbance treatment F=3.4* F=18.87** Axis 1 (82.5%) Axis 1 (86.5%) -1.0 1.0 treatment F=4.93** 2d -1.0
Version postprint 1.0 Disturbance treatment F=19.27** I t ti D-H-7 2 %) A Disturbance treatment F=20.37** 7d 14d 21d 23d 1.0 6 %) D-H D 9d 7d 14d 9d B Di t b Interaction F=22.79** D-H-21 D-7 D-21 Axis 2 (12. 2 R ti Interaction F=17.09** 0d 84d 28d 43d 63d 84d Axis 2 (3. 6 C 21d 23d 28d 43d 63d 84d -1.0 1.0 -1.0 Disturbance duration F=5.45* Axis 1 (87.3%) -1.0 1.0 Recovery time F=2.64 ns Axis 1 (94.1%) -1.0
Version postprint B: D-H-21 A: D-21 -20 0 20 21 31 41 51 61 71 81 -20 0 20 21 31 41 51 61 71 81 B: D-H-21 A: D-21 om control -80 -60 -40 -80 -60 -40 % change fr o ACT FUNG G+ G--100 -100
Version postprint
No resilience Resilience
Birch‐effect HEAT‐WAVE DROUGHT
A B ess ess Birch‐effect No resilience Resilience and direct killing of microbes Physiological cost Shifts in carbon allocation Lasting effect End of str End of str are to Control are to Control d di t killi f i b Physiological cost Shift in catabolic structure Control o f changes comp Control o f changes comp a and direct killing of microbes ‐10 0 10 20 30 40 50 60 70 ‐10 0 10 20 30 40 50 60 70 R ti (d ) R ti (d ) Magnitud e o Magnitud e o Shift in taxonomic structure Drought disturbance Shock of re‐wetting Heat‐drought disturbance Shock of re‐wetting Recovery time (days) Recovery time (days)
Heat Wave at resilience dates
C Total biomass (FAMEs)
Catabolic quotient qCO2 Bray and Curtis indice for CLPP Bray and Curtis indice for FAMEs
m pare to Control Heat‐Wave at resilience dates C e of changes co m 2 7 21 Control e