The Addition of a US Rare Earth Element (REE) Supply-Demand Model Improves the Characterization and Scope of the United States Department of Energy's Effort to Forecast US REE Supply and Demand
by Richard Mancco
Submitted to the
Department of Mechanical Engineering
in Partial Fulfillment of the Requirements for the Degree of Bachelor of Science
at the
Massachusetts Institute of Technology February 2012
ARCHIVES
SMASSACHUSETTS~ INSTltrE OF TECHNOLOGYJUN 28 2012
LIBvRRIES
@2012 Richard Mancco. All rights reservedThe author hereby grants to MIT permission to reproduce and to
distribute publicly paper and electronic copies of this thesis document in whole or in part in any medium now known or hereafter created.
Signature of Author ... ...
Department of Mechanical Engineering February 3, 2012
Certified by ... ... ...
Tonio Buonassisi Assistant Professor of Mechanical Engineering Thesis Supervisor
/
/
/
I A. aAccepted by ...
John H. Lienhard V muel C. Collins Professor of Mechanical Engineering
Undergraduate Officer
The Addition of a US Rare Earth Element (REE) Supply-Demand Model Improves the Characterization and Scope of the United States Department of Energy's Effort to Forecast US REE Supply and Demand
By Richard Mancco
Submitted to the Department of Mechanical Engin'eering on February 6, 2012 in Partial Fulfillment of the Requirements for the Degree of
Bachelor of Science in Mechanical Engineering
ABSTRACT
This paper presents the development of a new US Rare Earth Element (REE) Supply-Demand Model for the explicit forecast of US REE supply and demand in the 2010 to 2025 time period. In the 2010 Department of Energy (DOE) Critical Material Strategy (CMS) report, the DOE created a DOE REE
Supply-Demand Model that forecasted world REE supply and demand. Information from the DOE Model was
used in the report to gauge future REE supply and demand in the US. The DOE Model only used world REE data for its world supply and demand forecast, discrediting the application and usefulness of a US data driven US REE supply and demand forecast. The new US Model employs US-specific data in the form of new supply factors and demand factors to provide an improved characterization of US REE supply and demand. The US Model's methodology allows for a more precise and direct approach to calculate future REE supply and demand in the US. Four new US-specific REE supply factors were
incorporated in the new US Model - global REE competition and non-collaboration, US REE competition from non-clean energy technologies, REE exportation downsizing by REE abundant countries, and new global REE operational mines. Four new US-specific demand factors were incorporated in the new US Model - US government REE information collection capability, US government funded REE research, private industry funded REE research, and other US government REE efforts and policies. The use of these additional factors increased insight of current and possible future US REE conditions than through the use of a world REE forecast alone (DOE Model). This paper recommends the use of the US REE Supply-Demand Model as a supplement to the current DOE Model used in the 2010 DOE CMS report.
The value and usefulness of the information made available by the new US Model is analyzed in this paper by experimentally applying the US Model to Indium - a REE utilized in the production of photovoltaic cells.
Thesis Supervisor: Tonio Buonassisi
Title: Assistant Professor of Mechanical Engineering
Acknowledgments
The author would like to thank Professor Tonio Buonassisi for his guidance in completing this thesis. The author would also like to thank the United States Department of Energy for their extensive research on the critical materials topic and for making critical material information available to the public.
Table of Contents
Acknow ledgm ents ... 3
List of Figures and Tables ... 5
1. Introduction ... 6
2. Background: Department of Energy (DOE) Rare Earth Element (REE) Forecasting System...9
2.1 DOE REE Supply-Demand M odel: Demand Component ... 12
2.2 DOE REE Supply-Demand M odel: Supply Com ponent ... 16
2.3 DOE REE Supply-Demand M odel: Core Technical Advantages ... 17
2.4 DOE REE Supply-demand M odel: Technical W eaknesses ... 19
3. Incom petency of the DOE REE Forecasting System ... 20
4. The Supplem ental US REE Supply-Demand M odel ... 23
4.1 US REE Supply-Demand M odel: Demand Com ponent ... 24
4.2 US REE Supply-Demand M odel: Supply Com ponent ... 28
5. Results and Discussion: Application of the US REE Supply-Demand Model to Indium ... 30
5.1 US Indium Demand ... 30
5.2 US Indium Supply ... 35
5.3 Indium Results Using New US REE Supply-Demand M odel ... 38
6. Conclusion ... 44
List of Figures and Tables
Figure 1: DO E REE Forecasting System [Current] ... 8
Figure 2: Enhanced REE Forecasting System [Recommended] ... 8
Figure 3: DOE CM S Short Term Criticality M atrix ... 10
Figure 4: DOE CM S M edium Term Criticality M atrix ... 11
Figure 5: CMS List of "Materials in Clean Energy Technology and Components" ... 11
Table 1: Demand Factors and Demand Calculation of the DOE Model's Demand Component ... 12
Table 2: Demand Trajectories: Demand Factor State Levels ... 14
Figure 6: DOE's Global Supply and Demand of Yttrium Oxide for 2010 to 2025 ... 16
Table 3: Demand Factors and Demand Calculation for the New US Model's Demand Component ... 26
Table 4: Trajectories: Demand Factor State Levels for New US Supply-Demand Model ... 27
Table 5: Supply Factors and Supply Calculation for the New US Model's Supply Component ... 29
Table 6: US Indium Dem and Factors ... 31
Table 7: US-Specific CIGS Indium Intensity ... 32
Table 8: Global and US PV Deployment: High and Low Added PV Capacity per Year ... 33
Figure 7: Added PV Capacity per Year ... 33
Table 9: Low and High CIGS US M arket Share ... 34
Table 10: Factor Intensity of the Four New Additional Demand Factors [Indium] ... 35
Table 11: Extrapolation of 2015 Indium Supply ... 35
Table 12: Factor Intensity for the Four New Additional Supply Factors [Indium] ... 38
Figure 8: US Indium Dem and Trajectories ... 39
Figure 9: 2015 US Indium Supply - Monte Carlo Estimate ... 40
Figure 10: 2015 US Indium Supply Estim ates ... 41
Figure 11: US Supply and Demand of Indium Calculated by the New US Model ... 42
1. Introduction
Clean energy (CE) enterprises in the United States' public and private sectors currently hold many promising clean energy technologies. Cumulatively, these technologies have the potential to reduce the United States' dependence on fossil fuels. The United States Department of Energy (DOE), the American Physical Society (APS), and other government agencies and private institutions have recognized, for many years, the potential these technologies have in becoming game changers in the United States' energy portfolio. These institutions have funded numerous research and manufacturing projects in an effort to create final CE products capable of competing with fossil fuels, and from a national economic stand point, also capable of competing with foreign CE products.
Today, these clean energy technologies face a raw-material supply scarcity that threatens to suppress their long term potential in the United States. Specifically, a large number of these raw materials are rare earth elements (REEs) used in the production of CE technologies from photovoltaic cells to wind turbines. In December 2010, the DOE published a Critical Material Strategy (CMS) report to analyze national REE supply for the growing REE demand coming from US CE technologies [1]. The objective was to better understand the risk of REE supply shortages for CE technologies in the US, and recommend possible federal government actions to mitigate US REE supply risk. In its 2010 CMS report, the DOE constructed a "Supply-Demand" model' to determine the range of possible global supply and demand for 14 rare earth elements, individually. The analysis was conducted for the 2010 to 2025 time period and was exclusively based on global REE supply and global REE demand with respect to the CE technology industry2.
The DOE used global or non-US-specific data as input for its DOE REE Supply-Demand Model (DOE Model). Using world data to understand US REE supply and demand can be effectively labeled as a
1A Supply-Demand model is defined as a quantitative forecast or estimation of future supply and demand
2 "With respect to the CE technology industry" is defined as the calculation of REE demand coming from CE
technologies and REE supply available for CE technologies. 6
"Global Approach" to understanding US REE supply and US REE demand with respect to CE technologies. The DOE Model did not make use of a "US Approach"; the use of US-specific demand and supply data to directly calculate US REE supply and demand with respect to CE technologies.
This paper explicates the need for a new US REE Supply-Demand Modelthat would enable a missing US Approach within the DOE's effort to understand US REE supply and demand. This paper analyzes how the inclusion of both a US Approach and a Global Approach for the creation of a new "Enhanced DOE REE Forecasting System" is better suited to help the DOE understand US REE supply and demand than the current "DOE REE Forecasting System."
The US REE Supply-Demand Model or US Model is the forecasting element of the US Approach in the recommended Enhanced DOE REE Forecasting System. The US Model is created in this thesis and supported as improving characterization and scope of forecasting possible US REE supply and demand for the 2010 to 2025 time period, beyond the current DOE Model. The US Model's methodology was designed after the DOE Model's methodology - which took a Global Approach to understand US REE supply and demand. Both modeling methodologies are analyzed in this thesis. To determine the value, usefulness, competency of the US Model, the model was experimentally applied to determine US supply and demand of Indium, a rare earth metal central to the production of Copper Indium Gallium Selenide (CIGS) photovoltaic cells. The value added characteristics and new information made possible by the new model are presented in this thesis and are used in support of including a US REE Supply-Demand Model (US Approach )to the current DOE REE Forecasting System. The addition of the US Model to create the Enhanced DOE REE Forecasting System improves the DOE's capability to determine future national REE supply and demand.
Figure 1 and Figure 2 summarize the DOE REE Forecasting System and the recommended Enhanced REE Forecasting System.
Global Approach (DOE Approach)
I
I
- - - - - - -
-Figure 1: DOE REE Forecasting System [Current]
---.40%
Global Approach (DOE Approach) US Approach
Figure 2: Enhanced REE Forecasting System [Recommended]
/ I
2. Background: The DOE REE Forecasting System
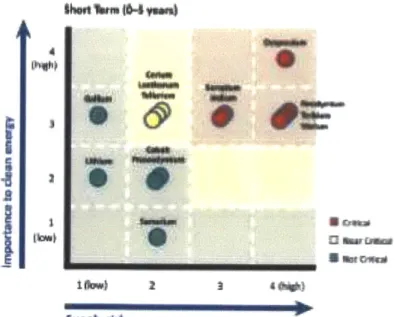
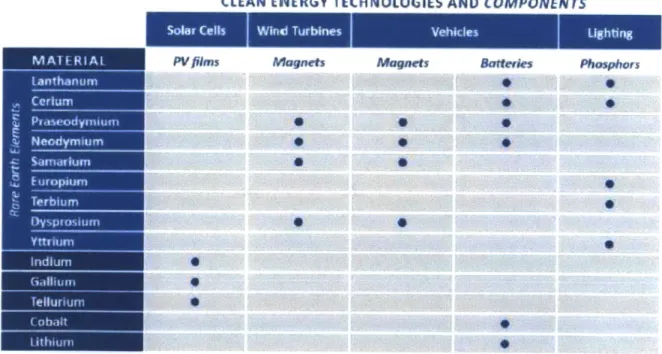
With the publication of the December 2010 Critical Materials Strategy report, the DOE presented a diagnosis of current and future REE supply and demand for CE technologies in the United States. In the CMS report, rare earth elements with high "supply risk" and high "importance to clean energy", as seen in Figure 3 and Figure 4, were highlighted and the DOE REE Supply-Demand Model, created within the report, was used as the basis for a set of REE recommendations to the US government. The information emitted in the report became central to the public and private sectors'
understanding of the United States'footing on the REE supply issue, and possible supply and demand scenarios expected in the future. A complete list of the rare earth elements investigated in the
December 2010 CMS report can be seen in Figure 5.
The DOE REE Forecasting System was the conglomerate element used to analyze US REE information and understand US REE supply and demand. It contained the DOE Model, forecasted global REE supply and demand, and gave US REE recommendations to the government and the private sector. The DOE REE Forecasting System contained several elements to its investigation of US REE supply and
demand; from information about REE price fluctuations, to information about US REE import changes, to information of possible US REE recycling programs. The DOE Model was the actual forecasting element of the DOE REE Forecasting System and had a specific set of parameters with which to project possible future global REE supplies and demands (The DOE REE Supply-Demand Model did not use other parameters of the DOE REE Forecasting System as input for its model). The DOE Model 's global REE forecasts were in turn used to understand US REE supply and demand, and build a US critical material strategy. This Global Approach, as defined earlier, enabled the DOE Model to only deliver a macro-scale understanding of US REE supply and demand. The DOE REE Supply-Demand Model was not a model tailored around US-specific data, which could capture unique REE supply and demand conditions exclusive to the US.
This paper picks up where the DOE's REE Supply-Demand System left off. A new US Approach is created and used as a supplement to the current DOE REE Forecasting System. The addition of the US Approach forms the Enhance REE Forecasting System. Included within the new US approach, a US REE Supply-Demand Model is used to understand the specific US REE supply and demand issues arising from CE technologies. The new US REE Supply-Demand Model uses a similar methodology utilized by the DOE for the construction of the DOE REE Supply-Demand Model (global approach).
In this section, the DOE Supply-Demand Model's methodology is described and its technical properties are analyzed. The analysis provides positive and negative methodology characteristics of the DOE Supply-Demand Model which are referenced in the creation of the final methodology utilized to create the new US Supply-Demand Model.
The DOE REE Supply-Demand Model contains two separate modeling components. The two modeling components are described and analyzed separately below. The DOE REE Supply-Demand Model includes a "Demand Component" to estimate future REE world demand coming from specific clean energy technologies. Similarly a "Supply Component" is used in the model to estimate current and future world REE supply levels (primary production and recycling).
11heet em 0-4 vaan)
41
3
6 ; I Ieass
IAW45-'
i*60ess
0
hM MOM a oifs C N Anuson * thiow..a IOW AFigure 4: DOE CMS Medium Term Criticality Matrix
CLEAN EINERGY TECHNOLOGIES AND COMPONENTS
PVfilms Magnets Magnets Batteries Phosphors
*
F
e
2.1 DOE REE Supply-Demand Model: Demand Component
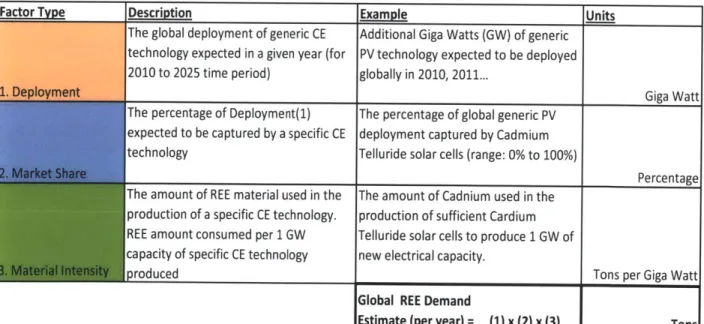
The Demand Component of the DOE REE Supply-Demand Model is responsible for forecasting global demand of each of the 14 REEs under review in the 2010 DOE CMS report. The Demand
Component used three key demand factors to calculate future demand.
1. Deployment: Total number of generic CE technology put into operation, globally, in a given year
2. Market Share: Percentage of Deployment (1) captured by a specific CE technology
3. Material Intensity: Quantity of REE consumed in 1 Giga-Watt capacity of specific CE technology.
REE demand was extrapolated from the REE demand needs of specific CE technologies. Specific CE technologies were used as the primary demand mechanism to calculate an individual REE's demand
within the US. All three of the key demand factors used input from REE demand specifics for CE technologies. Table 1 gives more detail about the three demand factors, and shows the algebraic process used to calculate global demand of each REE for the 2010 to 2025 time period. Demand was calculated as tons per year (ton/year).
Factor Type Description Example Units
The global deployment of generic CE Additional Giga Watts (GW) of generic technology expected in a given year (for PV technology expected to be deployed 2010 to 2025 time period) globally in 2010, 2011...
Giga Watt The percentage of Deployment(1) The percentage of global generic PV
expected to be captured by a specific CE deployment captured by Cadmium technology Telluride solar cells (range: 0% to 100%)
Percentage The amount of REE material used in the The amount of Cadnium used in the
production of a specific CE technology. production of sufficient Cardium REE amount consumed per 1 GW Telluride solar cells to produce 1 GW of capacity of specific CE technology new electrical capacity.
roduced Tons per Giga Watt
Global REE Demand
Estimate (per year) = (1) x (2) x (3) Tons
Multiplication of the three demand factors returned a tons-per-year estimate of global demand for each REE. The trivial calculation is given in Equation 1 (note percentage is unitless and not included).
GW * = tons (1)
GW
To forecast demand of each REE for the 2010 to 2025 time period, the Demand Component conducted the demand calculation 16 consecutive times. For simplicity and as a measure of conservative modeling,
the DOE Model's Demand Component assumed constant market share and material intensity during the 2010 to 2025 time period when forecasting demand for each REE under review. However, the Demand Component did not assume constant generic CE deployment in the 2010 to 2025 period. Deployment forecasts constructed by external institutions were used as input for the Demand Component deployment demand factor. The deployment forecasts produced by the International Energy Agency
(IEA) were used for several REEs.
The Demand Component worked similarly to a "sensitivity analysis." The three key demand factors were used to formulate four unique demand trajectories (demand curves). The four demand trajectories were utilized to represent a quantitative range for the demand of each REE under review. Determining a range of possible demand for each REE was chosen over determining an exact demand forecasts for each REE. The four demand trajectories worked synonymously to hurricane trajectories in hurricane meteorological report; where trajectories serve as indicators of what is possible in the future. Each of the four demand trajectories was formulated using a specific "state level" combination of the three key demand factors discussed previously. Each of the three demand factors could take a "high" or "low" state level; these state levels were used to represent global maximum and minimum values for the demand factor. The final outcome was a set of demand trajectories that used maximum and minimum demand factor values to calculate a range of possible future global REE demand coming
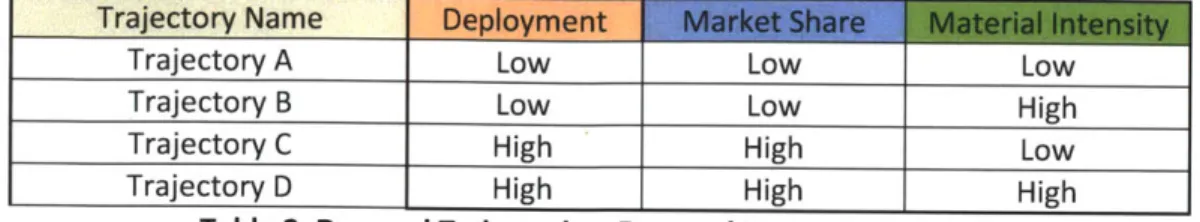
from CE technologies. Table 2 shows the state level values for each of the three demand factors comprising a demand trajectory. Demand Trajectory A represents the lowest projected global REE demand while Demand Trajectory D represents the highest projected global REE demand.
Trajectory Name lowmono
Trajectory A Low Low Low
Trajectory B Low______ Low High
Trajectory C High High Low
Trajectory D High High High
Table 2: Demand Trajectories: Demand Factor State Levels
The specific values given to the high and low state levels of each demand factor were different for each CE technology under review. This was the case due to the distinct material necessity, global deployment, and market share of each CE technology used as the primary demand mechanism for a specific REE. This complexity obligated the DOE to determine state level values for each demand factor on a case by case basis. Values for deployment were obtained from renowned institutions such as the lEA. Values for market share were based on reasonable estimations conducted by the DOE and United States Geological Survey (USGS) data . Values for material intensity were based on data from US National Laboratories, such as the National Renewable Energy Laboratory (NREL), and other credible institutions.
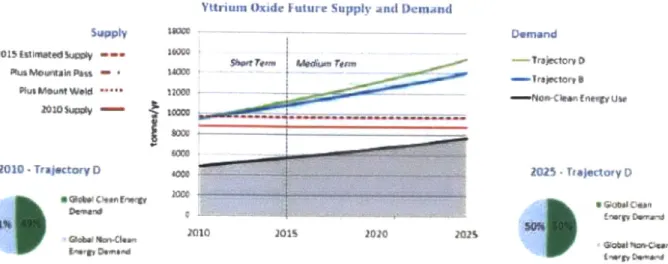
For several CE technologies under review, the DOE Model's Demand Component made use of less than four demand trajectories to determine the range of possible future global demand of a specific REE. This was the case when data was not available for either a high or low state level of at least one of the three demand factors. For example, such was the case for the demand modeling of Yttrium Oxide (Figure 6). Only Trajectory B and D were possible for Yttrium Oxide because the Demand Component only had data for one material intensity value3
and not for the two high and low material intensity
values required by methodology being used. Yttrium is a REE material utilized in the production of promising lighting technologies.
The sources used by the DOE for the demand factors ranged from government agencies to international institutions. Apart from conducting primary research through its own organization to determine demand factor values, the DOE was strongly reliant on publicly available information to gain insight on the demand factor values for specific CE technologies. Material intensity and market share for CE technologies were the only demand factors with an abundance of primary data outside DOE
research. CE material intensity and market share research was prominently conducted by several independent institutions, therefore allowing for the crosscheck and increased credibility of these two demand factor values as used by the DOE Model's Demand Component. Crosschecked values for current demand and possible future demand only strengthened the Demand Component.
Unlike material intensity and market share, CE technology deployment lacked sufficient primary data sources. Current and future data for CE technology deployment was of an estimative nature and bounded on assumptions. The DOE therefore heavily relied on other institutions for such data, and subsequently relied on the modeling capability of these institutions to deliver fact-based global CE deployment forecasts. For example, the International Energy Agency's (IEA) global photovoltaic deployment data was used to determine Indium demand originating from CIGS technologies. The reliance on the IEA's future PV deployment estimates made the DOE susceptible to poorly designed or aggressively manipulated forecasts.
Yttniuim Oxide uture Nupply ;and Demand
134ply
DeD
Figur 6 DO ' lo ba u pya d De a d o t ru Oxd f 2010 tor r 202
t o si t t n t sdeto to4W d
Q~w CI. 1 01 2010 2102S
Figure 6: DOE's Global Supply and Demand of Yttrium Oxide for 2010 to 2025
2.2 DOE REE Supply-Demand Model: Supply Component
The Supply Component of the DOE REe Supply-Demand Model provides an estimate of global REE supply for only two specific dates, 2010 and 2015. The Supply Component is less complex and has less of a forecasting function than the Demand Component. The Supply Component cannot use "supply trajectories," similar to the demand trajectories used in the Demand Component, to develop a range of
possible global supply for each REF under review. This was the case due to a lack of REe production (mining and processing) data and recycling data needed for the calculation of a yearly REF supply forecast. REF supply data is handled as proprietary information by top national and foreign REF suppliers.
The Supply Component only delivered 2010 and 2015 global REF supply estimates. The 2010 estimate for each REF under review was cited from the USGS and utilized to represent current global REE supply. The 2015 estimate for each REE was cited from private institutions and utilized to represent possible near-future global REE supply. The current supply estimate was valuable to the Supply
Component because it worked as an indicator of present-day supply for each REE. The near-future supply estimate was valuable because it facilitated gauging whether there would be a satisfactory supply
level for REE demand estimates (demand trajectories) in the near future (5 years). This can be seen in Figure 6. The 2015 estimate was not an in-house DOE calculation and resulted in making the Supply Component reliant on the modeling capability of its sources.
Indium metal is an example of an REE for which the DOE Model 's Supply Component used private institution supply estimates for the 2015 global REE (Indium) supply figure. The estimated 2015 world Indium supply was cited from Indium Corporation, one of the world's largest producers of Indium.
The Supply Component is weaker than the Demand Component. The Supply Component focused on delivering a simple measure of how an REE's supply might change in the near-future by only providing a 2010 and 2015 REE global supply estimate. This was in part due to insufficient supply data that hindered a more complete supply forecast. Mining and recycling information from REE production companies is not publically available and is rarely submitted to US REE information banks such as the USGS.
2.3 DOE REE Supply-Demand Model: Core Technical Advantages
The DOE REE Supply-Demand Model has several core technical advantages. These technical advantages make the DOE Model a competent framework to use and build-by when creating the new US REE Supply-Demand Model. The technical advantages of the DOE REE Supply-Demand Model are three fold; 1) the Demand Component of the DOE Model uses three demand factors that makes it straightforward to calculate global demand for each REE, 2) the Demand Component delivers a range of
possible global REE demand instead of a definite or exact demand estimate (sensitivity analysis approach), and 3) the Supply Component is cautious and does not over manipulate weak demand data to create even weaker global demand forecasts for each REE under review.
Using of Demand Factors:
The three demand factors used to calculate demand for each REE under review are easy to understand and can be multiplied almost seamlessly to return REE demand in units of metric tons. The three demand factors are mutually exclusive collectively exhaustive4 (MECE) to predict global REE demand coming from CE technologies (note these demand factors alone are not MECE for US REE demand). That is, the three demand factors provide a complete non-overlapping manner of accounting for global demand data and computing global demand. Sensitivity Analysis Approach for REE Demand:
Estimating the range of possible demand for each REE in the 2010 to 2025 time period instead of exactly predicting yearly demand provides a better diagnosis of how demand might change over the next several years. A REE demand range essentially provides boundaries on what to expect and plan for in the next several years. A Demand Component that directly predicts REE supply does not provide this gauging mechanism and only suggests its best guess on what supply will be.
Cautious-Forecasting Supply Component:
The lack of publicly available supply data constrains the creation of competent year-to-year supply forecast. Much more data is available for global REE demand than global REE supply for CE technologies. That is due to the secrecy of supply data, especially from foreign REE supply producers. Only a conservative and cautious forecasting Supply Component can be effectively used to gauge possible supply for CE technologies in the future.
18
2.4 DOE REE Supply-Demand Model: Technical Weaknesses
The description of the Supply Component and the Demand Components above, revealed several technical weaknesses within the DOE REE Supply-Demand Model. The identification of these
weaknesses, like the identification of core technical advantages, serve as important guidelines to follow when constructing the new US REE Supply-Demand Model as part of the supplementary US Approach. The major weaknesses of the DOE REE Supply-Demand Model in calculating global REE supply and demand were 1) the lack of primary and cross-referenced data, and 2) dependence on the modeling capability of private institutions when using their forecasted supply and demand data.
Lack of Primary Data:
For several REEs under review, the Demand Component had insufficient data to define all high and low state level values for demand factors. Missing input for demand factors resulted in a reduced number of demand trajectories and consequently a less complete range of demand for a particular REE over 2010 to 2025 time period. Overall, lack of data reduced the power and effectiveness of the Demand Component.
Dependence on Private Institution Data Modeling:
Both the Demand Component and Supply Component of the DOE Model used data created by the forecasting-models of private institutions. For example, the deployment demand factor in the Demand Component used forecast data belonging to private institutions to calculate REE demand trajectories. Similarly, the Supply Component used forecast data belonging to private institutions to define the 2015 supply estimate each REE under review. The use of forecast data by the DOE Model made the DOE Model reliant on the competency of the forecasting models used by private institutions. Unsubstantiated assumptions and unwarranted inputs used in these external models can negatively affect the power and value of the DOE Model.
The new US REE Supply-Demand Model uses parts of the DOE REE Supply-Demand Model's methodology and avoids the short falls (weaknesses) of the DOE REE Supply-Demand Model.
3. Incompetency of the DOE REE Forecasting System
From Section 2, it can be assumed that the Supply Component and the Demand Component of the DOE REE Supply-Demand Model provide a satisfactory methodology to forecast global REE supply and demand. The purpose of this section is to provide an analysis of why alone a DOE Model, which satisfactorily predicts future global REE supply and demand using world or non-US-specific data as input for its REE Supply-Demand Model (Global Approach), is not sufficient to provide a complete
understanding of US REE supply and demand or to prescribe US REE recommendations to the US government.
The DOE REE Forecasting System is incompetent in providing a complete understanding of US REE supply and demand because its Global Approach fails to 1) use US-specific supply and demand data, and 2) provide a mutually exclusive collectively exhaustive set of supply and demand factors capable of explicitly calculating US REE supply and demand. The discussion of these shortcomings provides the basis for the creation of a US Approach in the next section. The US Approach is defined as the use of US-specific data in the new US REE Supply-Demand Model.
Input-Data Limitations:
In the 2010 DOE CMS report, the DOE REE Forecasting System presents both world REE and US-specific REE data. World and US-US-specific REE data were used by the DOE REE Forecasting System to give a deeper description and analysis of world and US REE conditions. However, the DOE REE Supply-Demand Model created within the DOE System only used world data and only output global REE supply and demand estimates. The DOE System attempts to understand US supply
and demand by extrapolating US REE trends from its calculation of total world REE supply and
demand. The use of US-specific data in an REE Supply-Demand Model would allow for a direct calculation of US REE supply and demand, which would give a more deliberate and penetrating understanding of current and future US REE conditions. US-specific REE data is much more tailored than world REE data, as it captures REE factors and assumptions that are unique to REEs in the US an no other country in the world. Though a Global Approach, with its use of world data, provides an essential macro-level understanding of US REE supply and demand, the inclusion of a supplemental US Approach with an included US REE Supply-Demand Model provides a more complete scope - macro and micro - to understand and effectively forecast US REE supply and demand levels.
Non-Exhaustive Supply Factors and Demand Factors:
The DOE System's DOE REE Supply-Demand Model has MECE demand factors that are capable of adequately calculating yearly global demand for REEs in the form of demand
trajectories. However, the DOE REE Supply-Demand Model does not have a MECE set of demand factors to calculate yearly US demand for REEs. Additional demand factors are needed to
provide a more complete characterization of US REE demand and which can be used to directly forecast future US REE demand. Four additional key factors were identified as requirements for
a new US approach.
1) Federal Capability towards an Exhaustive Collection of REE Supply and Demand Information 2) Federal REE Substitutes and Production Efficiency Research
3) Private REE Substitutes and Production Efficiency Research
4) Other Federal Efforts/Policies to Reduce a Possible REE Deficit - Including Recycling These four demand factors were extracted from key recommendation issued by the DOE and
APS on how to mitigate a potential US REE supply deficit. These four demand factors were deemed important in helping reduce REE demand coming from US CE technologies. A more in depth description of these four additional demand factors is provided in Section 4.
Though the DOE Model did not make use of supply factors, several US-specific supply factors are needed to characterize US supply above global supply. The new US-specific supply factors would help determine possible current and future US REE supply. Four new US-specific supply factors were identified:
1) Global Competition and Non-Collaboration 2) Competition from US Non-CIGS REE Consumption 3) Foreign REE Exportation Restrictions
4) New Operational Mines (REE Production from By-Product or Direct Mining)
These variables are logically important when analyzing how the US' REE supply might develop between 2010 and 2015. In the current DOE Model, the 2010 and 2015 global supply estimates,
borrowed from private institutions, provide exact 2010 and 2015 global supply values. These exact supply values are not sensitive to estimative discrepancies and do not provide a range of
possible future global supply. Section 4 provides more information about the four supply factors.
It is important to keep the list of additional demand/supply factors to a minimum. Though the additional factors provide specified input to the new US REE Supply-Demand Model, weak and unnecessary factors will dilute the power of the Model.
The DOE Model, which is part of the DOE REE Forecasting System, does not provide a complete understanding of US REE supply and demand because it only utilizes global REE data and non-specialized supply/demand factors. The additional employment of US-specific REE data in a new US REE Supply-Demand Model along side of the DOE's Global Approach would permit for a supply and demand forecast that is more tailored to the US ongoing REE issue. This inclusion enhances the forecasting scope of the system, from only a global perspective to a global and national perspective.
4. The Supplemental US REE Supply-Demand Model
The addition of a US Approach to the Global Approach based DOE REE Forecasting System would improve the understanding and forecasting of US REE supply and demand. The addition of the US Approach essentially provides a second more specified approach to determine current and future US REE supply and demand. The combine use of the Global Approach and US Approach is defined in this paper as the new Enhanced REE Forecasting System. The actual forecasting element of the US Approach is the new US REE Supply-Demand Model.
In this paper, a new US REE Supply-Demand Model is constructed and analyzed to prove the advantages of including a US Approach to the DOE REE Forecasting System (therefore creating the
Enhanced REE Forecasting System). A referenced excel files contains the mathematical and statistical procedures used to construct the US Model. The US Model is the actual forecasting tool for the US Approach and only value-added information made possible by the US Model will support the use of the
US Approach.
The incompetency of the DOE REE Forecasting System as well as the advantages and weaknesses of the DOE Model, described in the previous section, provide a framework for the
construction of a new supplemental US REE Supply-Demand Model (US Model). Mitigating the technical weaknesses of the DOE Model is critical in order to create an improved methodology for the US REE Supply-Demand Model.
The methodology used to create the new US Model was designed around two provisions. The first provision warranted the use of a "sensitivity analysis" approach when constructing the Demand Component and Supply Component of the US REE Supply-Demand Model. The second provision warranted the application of new amendments within the US REE Supply-Demand Model aimed to answer the weaknesses of the DOE REE Supply-Demand Model. The sensitivity analysis methodology, as
s The US REE Supply-Demand Model Excel File can be found in the Reference section. 23
used in the DOE Model, would deliver a range of possible demand and supply, an advantage over any precise supply and demand estimates.
The new US REE Supply-Demand Model can be broken down into a Demand Component and Supply Component.
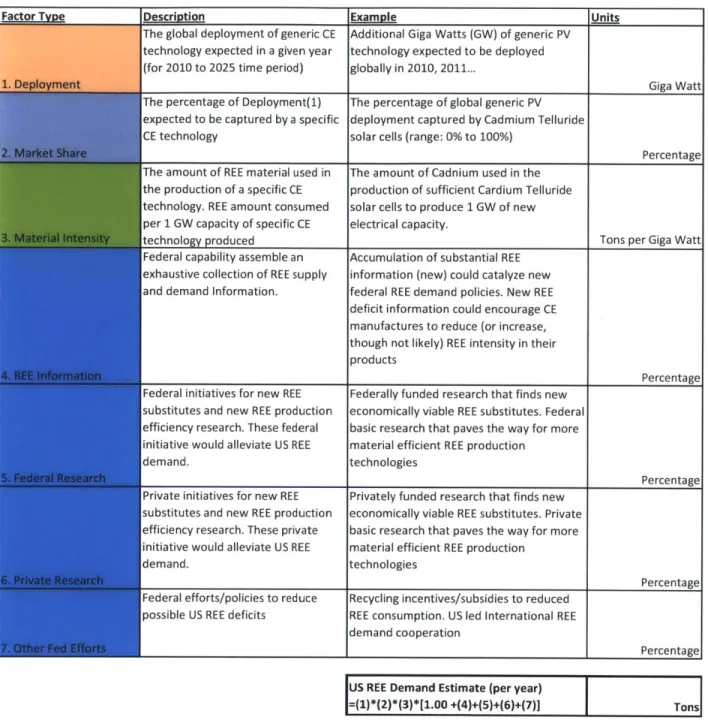
4.1 US REE Supply-Demand Model: Demand Component
The Demand Component of the new US REE Supply-Demand Model uses 1) the three key
demand factors utilized by the original DOE REE Supply-Demand Model, and 2) four new demand factors which are specific to US REE demand. A total of seven demand factors are used by the US REE
Supply-Demand Model to completely characterize US REE demand and estimate possible US REE demand for the 2010 to 2025 time period.
The four demand factors borrowed from the DOE Model's Demand Component were used to calculate tons of REE per year using the same procedures described in Section 2.1. The three demand factors; deployment, market share, material intensity, provided an explicit calculation for REE demand.
High and low state values for each of these demand factors were used to create 4 demand trajectories. Unlike the values used in the DOE Model, the three demand factors had high and low values that used US-specific demand data. When it could be appropriately assumed that the US and global values were similar, US REE demand data was replaced with global REE demand data.
The four new demand factors were incorporated into the US Model's Demand Component in order to answer the incompetency of the DOE REE Forecasting System and included additional demand factors that would complete a characterization of the US REE conditions. The new demand factors used US-specific REE data. The four new demand factors were:
1) Federal Capability towards an Exhaustive Collection of REE Supply and Demand Information 2) Federal REE Substitutes and Production Efficiency Research
3) Private REE Substitutes and Production Efficiency Research
4) Other Federal Efforts/Policies to Reduce a Possible REE Deficit - Including Recycling
The four new demand factors were also assigned high and low state levels. The new demand factors had units of percentage and their total cumulative percentage effect was multiplied with the first three demand factors (tons/year). Because the four new demand factor also had high and low state level, the multiplicative process returned maximum and minimum ranges for each of the four trajectories defined
by the first three demand factors. The four new demand factors effectively created a range for each demand trajectory; they provided high and low limits for each of the four trajectories. The eight
boundaries were converted to eight demand trajectories, and were used to determine the complete range of possible future US REE demand. Table 3 defines the seven demand factor and how US REE demand was calculated for each trajectory.
rhe global deployment of generic CE :echnology expected in a given year for 2010 to 2025 time period)
Units
Additional Giga Watts (GW) of generic PV technology expected to be deployed globally in 2010, 2011...
Giga Watt The percentage of Deployment(1) The percentage of global generic PV
expected to be captured by a specific deployment captured by Cadmium Telluride
CE technology solar cells (range: 0% to 100%)
Percentage
The amount of REE material used in The amount of Cadnium used in the the production of a specific CE production of sufficient Cardium Telluride technology. REE amount consumed solar cells to produce 1 GW of new per 1 GW capacity of specific CE electrical capacity.
echnology produced Tons per Giga Watt
Federal capability assemble an Accumulation of substantial REE exhaustive collection of REE supply information (new) could catalyze new and demand Information. federal REE demand policies. New REE
deficit information could encourage CE manufactures to reduce (or increase, though not likely) REE intensity in their products
________________________________Percentage
Federal initiatives for new REE Federally funded research that finds new substitutes and new REE production economically viable REE substitutes. Federal efficiency research. These federal basic research that paves the way for more initiative would alleviate US REE material efficient REE production
demand. technologies
Percentage
Private initiatives for new REE Privately funded research that finds new substitutes and new REE production economically viable REE substitutes. Private efficiency research. These private basic research that paves the way for more initiative would alleviate US REE material efficient REE production
demand. technologies
Percentage Federal efforts/policies to reduce Recycling incentives/subsidies to reduced
possible US REE deficits REE consumption. US led International REE demand cooperation
Percentage
IUS
REE Demand Estimate (per year)=(1)*(2)*(3)*[1.00 +(4)+(5)+(6)+(7)] Tons
Table 3: Demand Factors and Demand Calculation for the New US Model's Demand Component
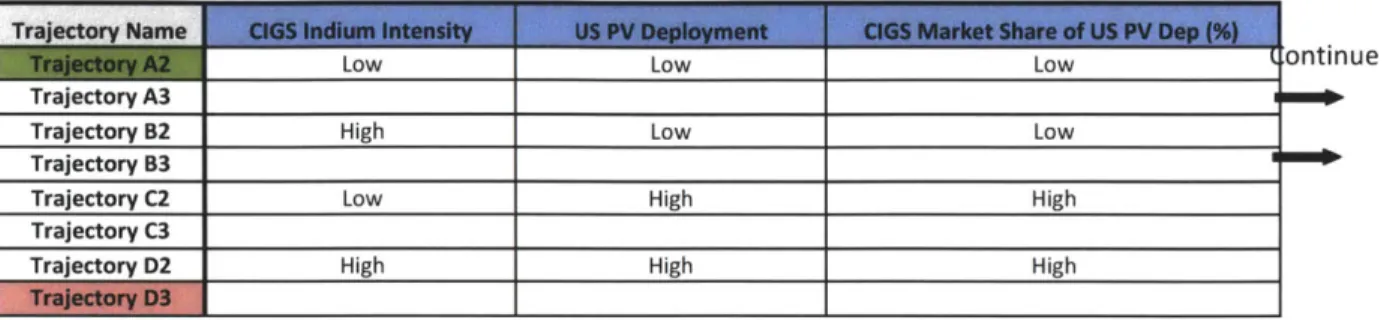
The eight demand trajectories retuned a range of possible REE demand instead of a single precise REE demand outlook for the future. Though a total of 256 (2A8 ) different demand trajectories could be created, the eight used in the new US Model 's Demand Component represented the
boundaries of these 256 possible demand trajectories and therefore provided a complete range of
possible REE demand. It is important to note that the eight demand trajectories were calculated using US specific-data and were calculated for one specific CE technology at a time.
Each of the new additional demand factors provide a negative percentage change on the
demand trajectories; that is, an increase in their value will result in the reduction of US REE demand. The additional demand factors represent efforts to reduce REE. Table 4 defines the eight demand
trajectories used in the US Model's Demand Component. Trajectories A2, B2, C2, and D2 represent the low demand boundaries. Trajectories A3, B3, C3, and D3 represent the high demand boundaries.
Low Low Low
Trajectory A3 ^ontinue
Trajectory B2 High Low Low
Trajectory B3
Trajectory C2 Low High High
Trajectory C3Hg
Trajectory D2 IHigh High H igh
Additional US-Soecific Demand Factor
Trajectory A3 Low Low Low Low
Trajectory B2 High High High High
Trajectory B3 Low Low Low Low
Trajectory C2 High High High High
Trajectory C3 Low Low Low Low
Trajectory D2 High High High High
Low Low Low Low
Trajectories: Demand Factor State Levels for New US Supply-Demand Model Table 4:
4.2 US REE Supply-Demand Model: Supply Component
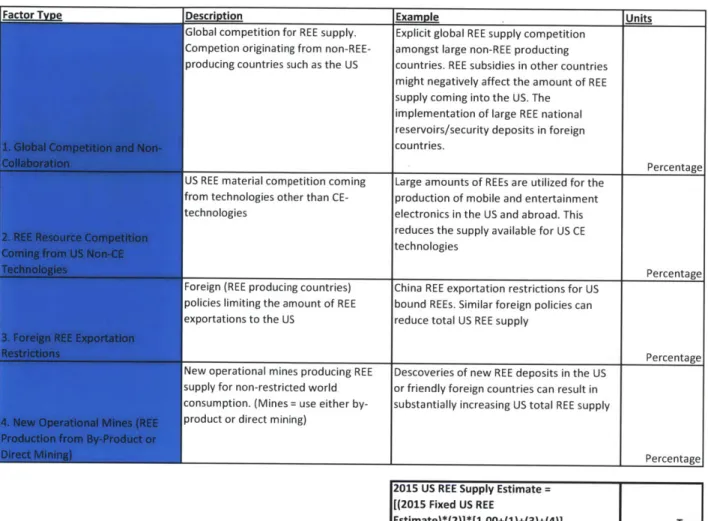
The Supply Component of the new US REE Supply-Demand Model uses 1) a single fixed supply estimate - 2015 REE US fixed supply, and 2) four additional supply factors to provide a range of possible supplies for the 2015 fixed supply.
Insufficient production data deterred the use of forecasting supply ranges for the 2010 to 2025 time period and favored the use of a single fixed supply estimate. 2015 global REE supply estimates were converted to 2015 US supply estimates by using the percentage of 2010 world REE used in US, and then multiplying this percentage times the 2015 global REE supply estimate published in the 2010 DOE CMS report. The lack of US-specific data compelled the extrapolation US REE supply from DOE published global REE supply. The percentage of 2010 world REE supply used in US was cited from the USGS.
Similarly to the new US Model's Demand Component, four supply factors were used to create a range of supply estimates for the 2015 fixed supply estimate. The four supply factors were applied to the fixed 2015 supply estimate and converted the fixed estimate to a 2015 range of possible supply. The first three new additional supply factors provided a negative supply percentage change, while the fourth new additional supply factor provided a positive supply percentage change. The four supply factors are described In Table 5:
Slobal competition for REE supply.
Competion
originating fromnon-REE-3roducing countries such as the US
.I IWite
Explicit global REE supply competition amongst large non-REE producting countries. REE subsidies in other countries might negatively affect the amount of REE supply coming into the US. The
implementation of large REE national reservoirs/security deposits in foreign countries.
Percentage
US REE material competition coming Large amounts of REEs are utilized for the from technologies other than CE- production of mobile and entertainment technologies electronics in the US and abroad. This
reduces the supply available for US CE technologies
Percentage Foreign (REE producing countries) China REE exportation restrictions for US
policies limiting the amount of REE bound REEs. Similar foreign policies can exportations to the US reduce total US REE supply
Percentage New operational mines producing REE Descoveries of new REE deposits in the US
supply for non-restricted world or friendly foreign countries can result in consumption. (Mines = use either by- substantially increasing US total REE supply
product or direct mining)
Percentage
2015 US REE Supply Estimate=
[(2015 Fixed US REE
Estimate)* (2)] *[1.00+(1)+(3)+(4)] Ton~s
Table 5: Supply Factors and Supply Calculation for the New US Model's Supply Component The four new supply factors were:
1) Global Competition and Non-Collaboration 2) Competition from US Non-CIGS REE Consumption 3) Foreign REE Exportation Restrictions
4) New Operational Mines (REE Production from By-Product or Direct Mining)
These additional US-specific supply factors improved the characterization US REE supply. The four new supply factors were drawn from the analysis conducted by the DOE and the APS [2]. The supply factors were highlighted by both the DOE and APS as important elements affecting REE supply flow into the US.
5. Results and Discussion: Application of the US REE Supply-Demand Model to Indium To understand the usefulness and value of the information made available by the new US REE Supply-Demand Model, the US Model was experimentally applied to Indium. This section describes the supply and demand modeling steps used to find the future possible range of US Indium supply and demand. More importantly, the section provides REE supply and demand results from the US model application to Indium, and compares these results to the US Indium findings and recommendations published in the 2010 DOE CMS report (Global results). The application of the US REE Supply-Demand Model to Indium is described in Section 4.1 and 4.2. The results are described in section 4.3.
Indium is a critical material for Copper Indium Gallium Selenide (CIGS) photovoltaic cells. Indium was highlighted as a having high "supply risk" and high "importance to clean energy" by the 2010 DOE Critical Material Strategy report. CIGS photovoltaic solar panels have increasingly been manufactured at a low dollar per megawatt cost - a prerequisite allowing CIGS technology to effectively compete with other RE technologies and fossil fuels. However, the noble technology and materials that makes CIGS PV cells possible, also undermine its large scale deployment. US Indium supply is know to be volatile and little is known about how its supply will change in the years to come. Recently, government and private institutions are reassessing the potential of CIGS technology as a consequence of the risk associated with Indium US supply, and ultimately reassessing the viability of CIGS technology mass deployment in the United States. Indium and its corresponding CIGS technology became an ideal candidate to test the new US REE Supply-Demand Model.
5.1 US Indium Demand
US Indium demand was calculated using the Demand Component of the US REE Supply-Demand Model. Eight demand trajectories defined the range of possible US Indium demand for the 2010 to 2025 time period. CIGS technology was defined as the only CE technology requiring Indium in the US. US Indium
demand was therefore calculated using demand data for CIGS technology. DOE Model also used CIGS technology Indium demand to calculated world Indium demand. The demand trajectories for the US
Model's Demand Component are defined in Table 6.
Original DOE Demand Factors - US Indium Data
Low Low Low
Trajectory A3 I
.ontinue
==1
Trajectory c2 Low High High
Trajectory C3
Trajectory D2 High High High
Additional US-Specific Indium Demand Factor
(1) Fed Capability Towards an (2) Fed indium Resource, (3) Private Indium Resource, (4) Other Federal
Exhaustive Collection of Substitute, and Efficiency Substitute, and Efficiency Efforts/Policies to Reduce a
Trajectory Name Indium S+D Information Research Research Possible Indiun Deficit
High High High High
Trajectory A3 Low Low Low Low
Trajectory 62 High High High High
Trajectory 63 Low Low Low Low
Trajectory C2 High High High High
Trajectory C3 Low Low Low Low
Trajectory D2 High High High High
Low Low Low Low
Table 6: US Indium Demand Factors
To forecast future Indium demand, the US REE Supply-Demand Model used the three demand factors
utilized by the DOE REE Supply-Demand Model and four new additional US-specific Indium demand factors.
Original DOE Demand Factors:
The three demand factors borrowed from the DOE Model's Demand Component methodology were formulated using US CIGS demand data. The three demand factors were Indium intensity of US
Trajectory B3
CIGS technology, generic photovoltaic technology deployment in the US, and CIGS market share of PV technology in the US.
Indium Intensity of US CIGS Technology
Indium Intensity is defined as the quantity of Indium consumed in the production of one additional Giga-watt of CIGS technology solar panels. The low and high intensity state levels for
Indium intensity had values of 16.5 tons/GW and 110 tons/GW, respectively. These high and low material intensity levels for CIGS technology were adopted from the 2010 DOE CMS report. The source for these numbers was the National Renewable Energy Laboratory (NREL). These numbers were used even though back of the envelope calculations and other private institution calculation revealed higher intensity levels. US Indium intensity coming from CIGS technology was thought to coincide with average world Indium intensity for CIGS technology.
Low Intensity: Avg Content per CIGS GW (tonnes) 16.5
High Intensity: Avg Content per CIGS GW (tonnes) 110
Table 7: US-Specific CIGS Indium Intensity
Generic Photovoltaic Technology Deployment in the US
CIGS technology solar panels fall under the category of photovoltaic technology. Lack of data for future CIGS deployment compelled the use of forecasted PV deployment for the 2010 to 2025 time period. CIGS market share, discussed below, was used to convert total forecasted
PV deployment into CIGS deployment for the 2010 to 2025 time period.
Forecasted US PV deployment was cited from the International Energy Agency (IEA) [5]. The IEA was cited because the DOE Model made used of the IEA's global PV deployment
forecast; confirming the credibility of the deployment forecast. Also, using the same source would allow to more acutely determine the benefits of directly calculating US Indium demand
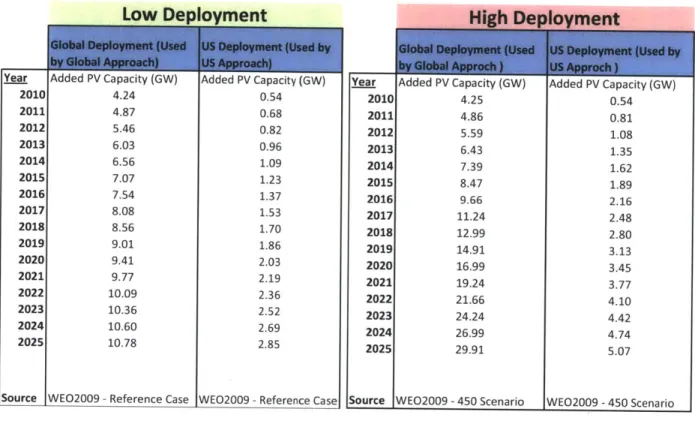
versus the Global Approach. The lEA created several deployment scenarios. The WEO 2009 Reference Case was the deployment scenario used for low US PV deployment. The WEO 2009-450 Case was the scenario used for high US PV deployment.
Low Denlovment
Aaaea Pv uapacity (uw)
4.24 4.87 5.46 6.03 6.56 7.07 7.54 8.08 8.56 9.01 9.41 9.77 10.09 10.36 10.60 10.78
Aaaea Vv Lapacity (uvv)
0.54 0.68 0.82 0.96 1.09 1.23 1.37 1.53 1.70 1.86 2.03 2.19 2.36 2.52 2.69 2.85 Year 2010 2011 2012 2013 2014 2015 2016 2017 2018 2019 2020 2021 2022 2023 2024 2025 Source Year 2010 2011 2012 2013 2014 2015 2016 2017 2018 2019 2020 2021 2022 2023 2024 2025 Added PV Capacity (bW) 4.25 4.86 5.59 6.43 7.39 8.47 9.66 11.24 12.99 14.91 16.99 19.24 21.66 24.24 26.99 29.91
Source IWEo2009 - 450 Scenario
Added PV Capacity (bW) 0.54 0.81 1.08 1.35 1.62 1.89 2.16 2.48 2.80 3.13 3.45 3.77 4.10 4.42 4.74 5.07 WE02009 - 450 Scenario
High and Low Added PV Capacity per Year
Figure 7: Added PV Capacity per Year
WE02009 - Reference Case |WE02009 - Reference case
Table 8: Global and US PV Deployment:
Deployment: Added PV Capacity Per Year*
35.00
30.00
-Global High Dep
25.00 - Global Low Dep
20.00 - US High Dep 15.00 - US Low Dep 10.00 5.00 0.00 2010 2012 2014 2016 2018 2020 2022 2024
CIGS Market Share of Generic PV Technology in the US
US CIGS market share, as a percentage of total PV deployed in the US, was defined as 10% for the low market share and 50% for the high market share. These two low and high benchmark market share values coincide with the low and high CIGS market share levels from world PV deployment assumed by the DOE Model. The high and low values were intended to simulate the possible low and high market share values of CIGS deployment; the values were
not intended to represent actual expected values.
rLow Market Share: CIGS % of Added PV Capacity 10%
High Market Share: CIGS % of Added PV Capacity 50%
Table 9: Low and High CIGS US Market Share
New US Specific Demand Factors:
In addition to the three DOE demand factors, four new US-specific demand factors were used to complete the characterization of US Indium demand originating from CIGS technology. The four US-specific demand factors demand factors were also assigned high and low values to calculate a range of possible future US Indium demand instead of a single fixed or exact demand estimate. The four factors were 1) federal information capability, 2) federal research, 3) private research, and 4) other fed efforts and policies. The US-specific demand factors were percentages and when multiplied with the three DOE demand factors had a percentage effect on final US Indium demand.
Each of the eight high and low state levels for the new US-specific demand factors were assigned values based on 1) the degree of government and private involvement in respect to each new demand factor and 2) an assessment of the each demand factors' effect on total US Indium demand. All four specific demand factors represented initiatives that can decreases US Indium demand. The
US-specific demand factors were oriented to reduce demand because federal and private interventions will logically be aimed to alleviate US Indium demand from the vulnerable US Indium supply. DOE and APS information was analyzed to help define high and low state level values for each US-specific demand factor. The final high and low state level values assigned to for each of the four new US-specific demand factors are shown in Table 10.
Factor Intensity Time Period of Factor,
High Fed Capability -5% 2010-2025
Low Fed Capability 0% 2010-2025
FactorI Inesty Time ProofFcor
High Fed Research -15%
2010-2025
Low Fed Research 0% 2010-2025
High Private Research -15% 2010-2025
Low Private Research 0% 2010-2025
Max Fed Effort
Min Fed Effort
Table 10: Factor Intensity of the
Factor Intensity Time Period of Factor
-10% 2010-2025
0% 2010-2025
Four New Additional Demand Factors [Indium]
5.2 US Indium Supply
US Indium 2015 Fixed Supply Estimate:
Current Production (2010) 2015 Estimated Supply
134
12010
Consumption Estimated (2010) 1202015 Estimated Supply (World Growth) 144
Table 11: Extrapolation of 2015 Indium Supply
A fixed estimate for the 2015 US Indium supply was extrapolated from the 2015 world Indium supply estimate provided by the DOE. The DOE's 2015 world supply data came from Indium Corporation. Indium Corporation, one of the world's largest producers of Indium, estimated the 2015 world supply by assuming "maximum capacity of primary production (600 tons), an 80% scrap recovery from ITO
processing (960 tons) and several new supplies of virgin indium brought on line by 2015" [3]. The DOE estimated the 2015 Indium world supply at 1612 tons. That estimate was converted to a 2015 US supply by using the percentage of world Indium supply consumed by the US. The USGS reported that in 2010 the US consumed 120 tons of Indium (100% all Indium used in the US is imported), that is about 9% of 2010 world supply [4]. This percentage was multiplied times the DOE 2015 global supply estimate. 2015 US Indium supply was estimated at 144 tons. The lack of US Indium supply investigations by the US government and private institutions compelled the use of world Indium supply to determine US Indium supply in 2015. Only 2015 US supply was calculated, again as a result of insufficient supply data.
New US-Specific Supply Factors:
The new US Model's Supply Component includes four new US-specific supply factors. These four new supply factors were applied to US Indium supply. The four factors were 1) global competition and non-collaboration over Indium supply, 2) US Indium supply competition from non-CIGS technologies, 3) foreign Indium exportation restrictions, and 4) the opening of new operational mines. These four supply factors improve the characterization of Indium supply within the US.
Supply factor 1 and supply factor 2 capture the importance to consider competition for Indium outside and inside the US. Indium and other REEs are critical for the production of CE technologies in many countries. According to the APS, countries are facing similar REE supply limitations and are encountering a growing number of preventive REE stockpiling initiatives by other countries; therefore effectively reducing world REE supplies. CE technologies are not the only technologies consuming US
Indium supply. According to the USGS, currently about 90% of all Indium in the US is consumed by the production of entertainment and mobile products (such as LCD displays) that use Indium Tin Oxide (ITO) for manufacturing. Indium is a critical ingredient for ITO. Supply factor 3 is also important to consider due to the increasing US REE import limitations being established by large REE exporters such as China. According to the USGS, in 2010 China reduced its REE exportation quota by 40% relative to its 2009 quota. Supply factor 4 takes into account the possibility of new Indium mining cites. Though the Indium Corporation's 2015 world estimate considers "several new supplies of virgin indium brought on line by 2015," supply 4 incorporates variability into the expected amount of increased mining in the next few years.
Based on publically available Indium supply data and points raised by the DOE and the APS, the high and low state level values assigned to each new US-specific supply factor are shown in Table 12. The calculation for the range of supplies is given in Table 5. US-specific supply factor 1, factor 3 and factor 4 were defined as having small negative (supply decreasing) effects on 2015 US Indium supply.
Factor 2 represented larger negative effects on the 2015 US Indium supply due to Indium supply competition within the US. Only a small fraction of total US Indium is supplied to CIGS technologies; most Indium is consumed by other technologies. Factor 2 converts total US Indium supply to US Indium supply for CIGS technologies, which is much smaller than total US Indium supply.
Low World Competition 0% 2010-2025
High World Competition -10% 2010-2025
Low Competition -50% 20'10-2025 High Competition -90% 2010-2025 Low Restrictions 0% 2010-2025 High Restrictions -20% 2010-2025 Max Openings 10% 2010-2025 Min Openings 0% 2010-2025
Table 12: Factor Intensity for the Four New Additional Supply Factors [Indiumn]
5.3 Indium Results Using New US REE Supply-Demand Model
Figure 8 shows the demand result after applying the US REE Supply-Demand model to Indium. Indium demand trajectories were calculated from CIGS technology Indium requirements, and four additional demand factors. Demand trajectories A2, B2, C2, and D2 represent lower Indium demand scenarios. Demand trajectories A3, B3, C3, and D3 represent the higher Indium demand scenarios. The definition of these demand trajectories are shown in Table 6. The range of possible Indium demand arising from CIGS technologies is skewed towards lower Indium demand levels - estimated demand does not surpass 20 tons per year by the year 2015. All trajectories, except trajectories D2 and D3, predict that Indium demand originating from CIGS technologies will not surpass the 40 tons/year between the 2010 to 2025 time period. A 40 ton demand estimate is slightly higher than three times the 2010 Indium supply estimate available for CIGS technologies (USGS 2010 US Indium supply (120 tons) multiplied by 10%). Trajectory D2 and D3 are the result of high PV deployment, high Indium intensity within CIGS technology, high CIGS market share, and minimal US government and private
![Figure 1: DOE REE Forecasting System [Current]](https://thumb-eu.123doks.com/thumbv2/123doknet/13867765.446056/8.918.264.635.150.538/figure-doe-ree-forecasting-current.webp)
![[PPT] Cours Langage HTML & XHTML methodes et explications | Cours informatique](data:image/gif;base64,R0lGODlhAQABAIAAAP///wAAACH5BAEAAAAALAAAAAABAAEAAAICRAEAOw==)