• Aucun résultat trouvé

Adjusted pure-play portfolio REIT equity index : historical performance of public and privacy real estate investment

N/A
N/A
Protected

Academic year: 2021

Partager "Adjusted pure-play portfolio REIT equity index : historical performance of public and privacy real estate investment"

Copied!
52
0
0

Texte intégral

(1)

ADJUSTED PURE-PLAY PORTFOLIO REIT EQUITY INDEX

HISTORICAL PERFORMANCE OF PUBLIC AND PRIVATE REAL ESTATE INVESTMENT

1987 - 2005

by

Dongwook Kim

Bachelor of Architecture

Cornell University

Submitted to the Department of Architecture in Partial Fulfillment of the Requirements for the

Degree of

MASTER OF SCIENCE

In Real Estate Development

at the

Massachusetts Institute of Technology

September, 2007

©2007 Dongwook Kim

All rights reserved

The author hereby grants to MIT permission to reproduce and to distribute publicly paper and electronic

copies of this thesis document in whole or in part in any medium now known or hereafter created

.

Signature of Author _____________________________________________________________

Department of Architecture

July 27, 2007

Certified by____________________________________________________________________

Henry O. Pollakowski,

Principal Research Associate, Center for Real Estate

Thesis Supervisor

Accepted by ___________________________________________________________________

David M. Geltner

Chairman, Interdepartmental Degree Program in

Real Estate Development

(2)

ADJUSTED PURE-PLAY PORTFOLIO REIT EQUITY INDEX

HISTORICAL PERFORMANCE OF

PUBLIC AND PRIVATE REAL ESTATE INVESTMENT

1987 - 2005

by

Dongwook Kim

Submitted to the Department of Architecture

On July 27, 2007 in Partial Fulfillment of the Requirements for the Degree of

Master of Science

In Real Estate Development

ABSTRACT

The public real estate market was initiated by the Real Estate Investment Trust Act of

1960. Since then, investors have been concerned with the assessment of performance

comparisons between publicly held assets and privately held assets. The main concern for

the assessment is to reveal historically which type of ownership provided the more efficient

vehicle for the investors. The National Council of Real Estate Investment Fiduciaries

(NCREIF) provides the investment performance of privately held commercial real estate,

and the National Association of Real Estate Investment Trust (NAREIT) provides that of

publicly held commercial real estate by REITs. However, direct comparison between the

two indexes is problematic due to the different characteristics of each market and the lack

of historical data for accurate assessment.

The primary purpose of this study is to adjust characteristics of commercial REIT assets

underlying one portfolio to match the characteristics of privately held commercial assets.

Since SNL data base provides hedonic data from 1995 and CRSP & Compustat merged

data base provides up to 2005 Q4, the sample period of this research is from 1995 Q1 to

(3)

2005 Q4. This quarterly assessment is conducted at the property sector (retail, apartment,

office and industrial), then at the aggregate level.

The main research of this thesis is to create adjusted REIT equity index that is derived

from the following treatments in the thesis. Pure-Play’ Portfolio Methodology will be applied to

replicate the performance of four real estate property-type sectors defined by NCREIF –

Implemented updated Equity to Total Asset ratio from De-leveraging REIT returns by WACC

formula based on CRSP and Compustat merged data to obtain the value weights of equity, debt

and total assets. As a proxy for the returns of debts held by REITs, Gilberto-Levy Historical

Mortgage Rate will be used as a proxy for the returns of debts held by REITs. Sector-Mix

Adjustment according to NCREIF sector weights. REIT index investment cost proxied by Vanguard

REIT fund expense (95-05) will be deducted from adjusted REIT equity index.

In this thesis, private real estate equity investment performance is represented by the MIT

Transaction Based Index (TBI) and NCREIF Property Index (NPI). Both TBI and NPI

returns are deducted by asset management fees estimated by the NFI-ODCE index

(NCREIF) over the same time period. Purpose of these adjustments is to improve

evaluation of publicly and privately held commercial real estate asset investment

performances relative to one another.

Preliminary comparison between NAREIT equity REIT index and NPI quarterly returns

from 1995-2005 was conducted to collect the mean return difference. Then the difference

after the treatments was compared to observe the effects of the author’s method.

The results demonstrate that at the aggregate level the difference between REIT and NPI

returns reduced from 1.08% to 0.74%, and the difference between REIT and TBI returns

reduced from 1.64% to 0.18%.

(4)

Thesis Supervisor: Henry O. Pollakowski

Title: Principal Research Associate

Acknowledgements

This thesis could not have been done without the help of the following individuals. I would

like to thank them for their valuable advice, encouragement and guidance.

Henry O. Pollakowski, Principle Research Associate, MIT Center for Real Estate:

David M. Geltner, Director, MIT Center for Real Estate:

Brad Case, Vice President, National Association of Real Estate Investment Trusts

Brandon Benjamin, Manager, National Association of Real Estate Investment Trusts

John Barwick, Manager, National Association of Real Estate Investment Trusts

Michael Giliberto, Managing Director, JP Morgan

Patrick Jengbin Tsai, MSRED 2007, MIT Center for Real Estate

(5)

TABLE OF CONTENTS

ABSTRACT ..……….………2

ACKNOWLEDGEMENTS ..……….…………4

1. INTRODUCTION .……….6

1.1 Background of the Public Real Estate Market………6

1.2 Background of the Private Real Estate Market………...8

1.3 Objectives………..11

2. LITERATURE REVIEW……….………12

2.1 Privately versus Publicly Held Asset ………12

2.2 REIT-Based Pure-Play Portfolio……….13

3. METHODOLOGIES………14

3.1 Data Mining and Corrections………..14

3.2 Definition of Pure-Play Portfolio……….14

3.3 Pure-Play Construction Model………15

3.4 Variance Minimization………..17

3.5 De-Leveraging Methodology through WACC formula………17

3.6 De-Leveraging Model………..18

3.7 Treatment of Management Expenses and Fees……….20

4. RESULT: COMPARISONS BY SETORS………...21

4.1 Retail and Office………...21

4.2 Apartment and Industrial……….22

4.3 Summary of the Adjustment Effects by Property Sector………35

5. OVERALL COMPARISONS………..37

5.1 Aggregate Return Performance Comparisons……….37

6. CONCLUSION……….40

7. BIBLIOGRAPHY……….42

(6)

CHAPTER 1

Introduction

1.1 Background of the Public Real Estate Market:

The ‘Real Estate Investment Trusts Act’ in 1960 initiated a public market of real estate

through the creation of publicly traded REITs. The REIT industry began to trade actively in

the market in late 1960’s, when the Mortgage REIT boom arose. Market capitalization of

the REIT vehicle has grown significantly due to the Tax Reform Act in 1986 which allowed

for the abolition of double taxation and the approval of self-management (vertical

integration). During the early 1990’s, the privately traded real estate market suffered due to

insufficient liquidity and the discrepancy in valuation between the private and public

markets. Consequently, the environment of the public market encouraged many large

companies to go public. Kimco’s Initial Public Offering (IPO) in 1991 is perceived as the

beginning of the modern REIT era. It was the first large stable real estate company to

choose REIT status. Followed by a $330 million Taubman IPO in 1992, REITs launched a

new structure called the Umbrella Partnership REIT (UPREIT). The creation of UPREIT

was another incentive for publicly traded REITs to market and grow by allowing private

firms to go public without immediate tax liability for the existing owners. Furthermore, the

increase in the number of well-managed large real estate companies’ REIT IPOs and the

growth of market capitalizations of REITs attracted many institutional investors that

required incentives for their retained liquidity investments. The growth in institutional

ownership promoted a boom in REIT IPOs in 1993 and 1994, followed by secondary

security offerings (SEOs) in 1996 and 1997.

In 1998, the prosperity of REITs began to collapse with falling share prices. Investors were

skeptical of the soaring REIT premiums to Net Asset Value (NAV) relative to private real

estate market pricing. Unfortunately, the crash of the REIT market overlapped with the

initiation of the ‘dot com’ bubble when a large number of investors pulled their money out

from REITs to invest in ‘dot com’ stocks. It was a critical event for both the public and

private real estate markets that demonstrated the different characteristics of these two

markets. REIT share prices fell although there were only modest changes in the underlying

(7)

real estate properties. REIT investors eventually realized that REITs are a part of capital

markets and the REITs’ value could be affected by dynamics that are not directly related to

property markets.

1

As a result, REIT share prices began to be determined by the Gordon

Growth Model (GGM), which is widely used for stock price valuation in capital markets.

REIT share prices consider ‘growth’ expectation of the firms by integrating the present

value of growth opportunity (PVGO).

2

PVGO can be positive or negative depending upon

the expectation in the capital market and its influence return performance in index. This

growth factor does directly influence the prices in the private market, whose values are

directly exposed to cash flows associated with the asset.

3

Figure 1. Historical Market Capitalization of REITs – Source: NAREIT

REITs Market Capitalization ($ millions)

1987 - 2005

0

50,000

100,000

150,000

200,000

250,000

300,000

19

87

19

88

19

89

19

90

19

91

19

92

19

93

199

4

199

5

19

96

19

97

19

98

19

99

20

00

20

01

20

02

20

03

20

04

20

05

Market Cap

1

David M. Geltner

2

Brealey, Myers, Allen

3

(8)

1.2 Background of Private Real Estate Market:

The private real estate market is characterized by its lack of liquidity. Privately held assets

are often held for long periods of time and possess incomparable characteristics that

cause difficulties in valuation. As a result, it is difficult to apply an asset valuation model

created for the public market to the private market due to the difficulty in obtaining correct

return data for the private market. The valuation of the privately held assets relies on the

expected cash flows of the underlying assets that correlate to the movement in capital

markets, which is not as significant as in publicly traded assets.

Various research has been carried out and methodologies have been developed to find

more correct measures to valuate those privately held assets. The NCREIF Property Index

(NPI) provides investment performances of privately held assets based on appraisal

values. Though NPI provides constructive information about the privately held assets,

appraisal values seem to have a smoothing behavior due to the conservative approach in

valuation that heavily relies on ex-post information. Unfortunately, NPI provides market

information slowly as appraisal valuations are usually conducted once a year whereas

public market values are updated instantaneously.

Adjustments for these concerns in appraisal values were considered by Geltner (1989).

His methods seek to correct for smoothed appraisal values by applying un-smoothing

reverse filters to achieve true values in pricing privately held assets. Although the

methodology reduced errors in appraisal value, related research by Fisher, Geltner and

Webb (1994) found that errors in value still remained and that un-smoothed data still

lagged behind publicly traded assets by more than one year.

(9)

Figure 2. Total Returns of REITs VS NCREIF – Source: NAREIT and NCREIF

Total Return Comparison

NAREIT vs NCREIF (NPI) 1987 - 2005

0

100

200

300

400

500

600

700

86

87

88

89

90

91

92

93

94

95

96

97

98

99

00

01

02

03

04

05

NAREIT

NPI

*100 invested at the end of 1986.

The Transactions-Based Index of Commercial Property Investment Performance (TBI)

developed by MIT CRE, measures values and returns on privately-held assets based on

transaction prices from the NCREIF Index database. As described on the MIT CRE

webpage, “This is a new type of index that offers advantages for some purposes over the

median-price or appraisal-based indexes previously available for commercial real estate in

the U.S. However, median price indexes are not true price-change indexes because the

properties that transact in one period are different from those that transacted in the previous

period.”

4

.

TBI adjusts NPI values by breaking down appraised values of properties into hedonic

variables. The basic TBI represents transaction prices that reflect variable liquidity in the

real estate marketplace over time.

4

(10)

Figure 3. Total Returns of REITs VS TBI – Source: NAREIT and TBI - MIT CRE

*100 invested at 1994-4.

Total Return Comparison

NAREIT vs. TBI (Quaterly 95-1 ~ 05-4

)

0

100

200

300

400

500

600

700

19

95

-1

19

95

-3

19

96

-1

19

96

-3

199

7-1

19

97

-3

19

98

-1

19

98

-3

19

99

-1

199

9-3

200

0-1

20

00

-3

20

01

-1

20

01

-3

20

02

-1

200

2-3

200

3-1

20

03

-3

20

04

-1

20

04

-3

20

05

-1

200

5-3

NAREIT

TBI

(11)

1.3 Objectives:

Although certain unique characteristics remain causing problematic comparisons,

investors are often interested in observing comparisons of investment performances in

public and private real estate markets. This thesis will attempt to enhance the

comparability of the two markets by observing relative risk-adjusted performances through

the creation of an annual risk-adjusted Public Real Estate Market valuation method by

property type sectors; Office, Residential, Industry, and Retail.

The quarterly equity REIT index is comparable to NPI and TBI from 1995 to 2005, based

on REIT data identified by Compustat and the Center for Research in Security Prices

(CRSP) database. The four property sector indexes of ‘Pure-Play Portfolio’ developed by

Geltner and Kluger (1998) are applied to replicate the performances of the four real estate

property sectors defined by NCREIF. Then, firm returns included in ‘Pure-Play Portfolio’

are un-levered firm by firm through use of the WACC formula, and the Vanguard REIT

fund expense is deducted.

Both Transaction Based Index and NCREIF Property index represent public real estate

market performances in this thesis. By comparing both indexes to the adjusted REIT index

created, the author hopes to present a better measurement for the performance of

privately held properties.

(12)

CHAPTER 2

Literature Review

2.1 Privately versus Publicly Held Asset

The research on a different approach for enhancing performance comparisons between

public and private real estate was developed by Moriarty and Yeatman in their thesis

presented in 1999 “A Risk-Adjusted Performance History of Public and Private Market

Real Estate Investment” (MIT CRE). This approach was later developed by Riddiough,

Moriarty and Yeatman in their literature “Privately Versus Public Held Asset Investment

Performance” (2005) to present an improved approach that compares two markets by

creating an index that adjusts asset characteristics according to a benchmark index. Their

result during the sample period of 1980 to 1998 reflects annual returns of 10.44% for

publicly held assets and 7.36% for privately held assets; a 3.08% gap between the

investment performances of the two markets.

Pagliari, Scherer, and Monopoli published their research regarding public and private

market comparison in their article “Public versus Private Real Estate Equities: A More

Refined, Long-Term Comparison” (2005). Their broad approach is similar to the previous

two articles; adjustments for partial years, leverage and sector mix, but their approach

utilized different methodologies to derive adjusted returns. This article put emphasis on an

un-smoothing method for appraisal based on the NCREIF index to reflect more precise

market movements in the private market to match movements in public market. Their

approach finds publicly traded assets outperformed privately traded asset by a gap of

3.00% during the sample period of 1981 to 2001.

This thesis is conducted using different methodologies in process but similar in its broad

analyses. The major difference in the public market performance index is the methodology

for deriving ‘Pure’ performance in one property sector. Previous research defined core

sector REITs using a benchmark of 75% or more of book value invested in one sector.

This sector specific performance approach exposes the result to the idiosyncratic risks of

other sectors. As a result, REIT based ‘Pure-Play Portfolio’ developed by Geltner and

(13)

Kluger is used in this thesis to more precisely evaluate ‘Pure’ investment performances in

each sector.

2.2 REIT-Based Pure-Play Portfolio

The foundation of this thesis is derived from the “REIT-Based Pure-Play Portfolio”

developed by Geltner and Kluger (1998). Since publicly traded REITs commonly own

assets that are in more than one sector, target specific performances are difficult to

measure. This approach measures performance in one sector without direct exposure to

other sectors by composing a portfolio that replicates the performance of the target sector.

This thesis is based on the approach developed by Geltner and Kluger, but the author

attempts to improve on some of the methodologies. Similar to the methodology developed

by Geltner and Kluger, a self-constructed index adjusts for partial years, property types

and leverage, but the author’s approach differs in several aspects. Geltner and Kluger’s

research is conducted with a sample period of 1987-1996. However, during those years

the REIT market was not mature enough to have a sufficient number of REITs and the

sample therefore lacked sufficient data. The sufficiency of data is critical to the ‘Pure-Play

Portfolio’ because the feasibility of short position is limited. Therefore, a significant sample

size must be taken in a short/long position from one firm to account for idiosyncratic risks

in the portfolio.

The main aspect of the methodology that this thesis seeks to improve is the de-leveraging

method. The author conducted de-leveraging on a firm-by-firm basis including minority

interests (book value) found in the CRSP and Compustat merged database and converted

into common equity value when calculating common equity weight in total capital. The

intent was to address the OP unit issue in the UPREIT structure that was initiated in 1992.

Since minority interests on REIT balances actually represent the equity share of REIT

properties held by third parties, they should be included in equity when calculating the

leverage ratio at the property level. Geltner and Kluger’s research may have ignored this

issue because the UPREIT structure was not active during their sample period.

Another factor they have excluded was the treatment for fees and expenses, which will be

adjusted for both the public and private market indexes in this thesis.

(14)

CHAPTER 3

Methodologies

3.1 Data Mining and Corrections

Annual firm by firm data from 1995-2005

5

was obtained from the Compustat and CRSP

merged database by SIC code #6798(DNUM) and ticker symbols (SMBL). To obtain the

proportions of the REITs’ value derived from the four property type sectors defined by

NCREIF, sufficient accounting and structural data about the REITs’ assets were necessary.

As a result, these ticker symbols were employed to the SNL Sector-Focused hedonic

database to identify property type sectors held by the REITs. If the firm’s data was only

available in one database, it was assumed to be insufficient and eliminated.

Partial-year returns were excluded because REIT share prices often reflect factors

unrelated to asset fundamentals around the time the firms enter or leave an index.

6

Studies related to REIT IPO performance by Chan, Erickson, and Wang (2003) indicate

that short to medium underperformance dynamics prevail when firms enter and exit.

3.2 Definition of Pure-Play Portfolios

Synopsis of REIT based Pure-Play Portfolio: The Case of Property Types, Geltner and

Kluger. (1998).

Pure-Play portfolio is defined as the optimal combination of long and short positions in

publicly traded REITs to replicate the performance of the target real estate sector without

direct exposure to the non-target sector. The ‘Pure-Play Portfolio’ method allows for

measurement of historical performances through the procedure of deriving unlevered

returns to the underlying properties held by the REITs broken out by the property types:

Office, Residential, Industrial, and Retail as defined by NCREIF. The basic idea was to

adjust the risk characteristics of the REIT assets underlying one portfolio to match the risk

characteristics of underlying assets in another portfolio.

5

SNL Sector-Focused database available from 1995, and Compustat and CRSP database available to 2005.

6

(15)

Various combinations in REITs can replicate exposure to one target sector. However, an

optimal combination that minimizes random volatility or idiosyncratic risks should be

investigated and chosen. Idiosyncratic risk is defined as REIT specific risk and type

specific risk. By defining and diversifying the idiosyncratic risk, Pure-Play return

components that are the same for any investment in a targeted sector can be extracted. A

REIT return is defined by its Pure-Play components and idiosyncratic components.

The Pure-Play portfolio method is effective under these relative conditions

7

:

1. The feasibility of short positions is conducted including the liquidity of the portfolio and

the required amount of the short position.

2. Sufficient data should be available to construct more diversified portfolios.

3. The exposure of firms to the target sector should be sufficiently stable over time so that

the portfolios do not require readjustment frequently.

3.3 Pure-Play Construction Model

The basic model can be described by modeling one REIT that invests in one property type

(R=retail). The return of this REIT can be broken down by its true return and idiosyncratic

return.

* ‘r’ is true return and ‘e’ is idiosyncratic return

The basic model is applied to a number of n REITs, which are made up of just two

property types; retail and office. Thus, the sum of weights in the two types should be one.

The pure play portion of each return is the same for any investments in the given property

type.

7

(16)

To construct a portfolio from the information available from many REITs, the return of the

portfolio would be function of n number of REITs

The return components are split into separate idiosyncratic components. In the next step,

construction of a Pure-Play Portfolio that targets the office sector will be conducted with

several of the constraints in equation (4). The sum of the weights to the office investment

should be one and the sum of weights to the retail investment should be zero. This

constraint can be expressed by

Several combinations that meet the above conditions can exist, but only one optimal

solution that minimizes the idiosyncratic variance should be identified by the Pure-Play

portfolio. Since the variance of Pure-Play return components is the same regardless of the

different weights, idiosyncratic variance should be minimized when the variance of the

portfolio return is minimized. The tables below are examples of two different Pure-play

portfolios that consist of three REITs investing in two property types.

(17)

Although both portfolios target one property type by 100% exposure to office and 0%

exposure to retail, the total idiosyncratic exposures in each portfolio varies due to the

change in weights in each REIT.

The optimal portfolio can be achieved by minimizing portfolio return variances. There are

several ways to conduct this minimization, but in this research, The Excel solver function

method will be used to compute the large data set available.

3.4 Variance Minimization by STATA Data Analysis and Statistical Software

To find the optimal weights that minimize idiosyncratic variance, STATA Data Analysis and

Statistical Software are used to identify the optimal solution with the specified constraints.

*Constraints.

Table 2. Number of REITs included in Pure-Play Portfolio

Year

1987 1988 1989 1990 1991 1992 1993 1994 1995 1996

# of

REITs 20 21 33 43 38 51 44 79 112

107

Year

1997 1998 1999 2000 2001 2002 2003 2004 2005

# of

REITs 77 85 88 91 53 54 57 56 62

*

Refer to appendix A for company names and data.

3.5 De-Leveraging Methodology through WACC formula.

TBI (NCREIF) is used as a proxy for private real estate investment performance. NCREIF

index returns reflect on an un-levered basis, while the REIT index reflects returns on firms

that are levered. Leverage increases volatility and returns of investment that make direct

comparisons problematic. To enhance the comparability to the NCREIF index (NPI, TBI),

REIT returns are delivered firm by firm.

(18)

In order to obtain de-levered performances of the REITs included in the Pure-Play Portfolio,

a weighted average cost of capital calculation is used in this thesis. With the aim of

removing leverage effects, value components were input into the formula below on a firm

by firm basis to obtain weights in debt and equity. Weights are determined as a percent of

total assets.

V

ASSET

= V

DEBT

+ V

PE

+ V

CS

+ V

MI

“DEBT” “EQUITY”

Firm by Firm Accounting and Market Data in each component is listed below, and the

values reflect the average of the previous year’s amount and the current year’s amount.

Since these values represent REITs holding at the end of the year, the previous year’s

value reflects the beginning value of the current year. Thus, this methodology concluded

that it is more appropriate to use the average value of the two years to reflect the current

year’s value.

3.6 De-Leveraging Model

Components included in Debt

V

DEBT

(Compustat):

Book Value of ‘Long-term Debt’ and ‘Debt in current Liabilities’ will be used to approximate

market value.

V

PE (Compustat):

Preferred Stock Value + Preferred Dividend Amount

Preferred Stock is treated as debt in this thesis due to its similar characteristics:

-Preferred stock pays specific dividends that are paid before any dividends are paid to

common stockholders and take precedence over common stock.

(19)

-Preferred stock pays a fixed dividend that does not fluctuate, although the company does.

Components included in Equity

V

CS

(CRSP):

(Number of Outstanding Common Stocks * Common Stock Closing Price) + Common

Dividend Amount.

V

MI

(CRSP):

Since the minority interest on the REIT balance actually represents the equity share of

REIT properties held by third parties, it should be included in equity when calculating the

leverage ratio at the property level. Weights found in Debt and Equity are employed to

Pure-Play Portfolio returns in each firm to obtain un-levered returns by calculating a return

on assets through the use of the WACC formula.

R

ASSET

= W

D

*R

DEBT

+ W

E

*R

EQUITY

W

D = (

V

DEBT +

V

PE)

/ V

ASSET

W

E= (

V

CS +

V

MI)

/ V

ASSET

R

DEBT

(Return on Debt) is approximated by historical Gilberto-Levy Mortgage Rates by four

property type sectors in each year.

(20)

3.7 Treatment of Management Expenses and Fees

Private Market Index:

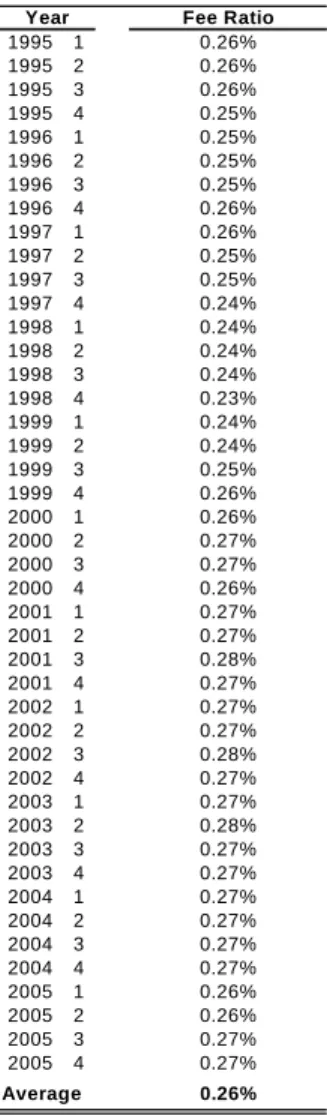
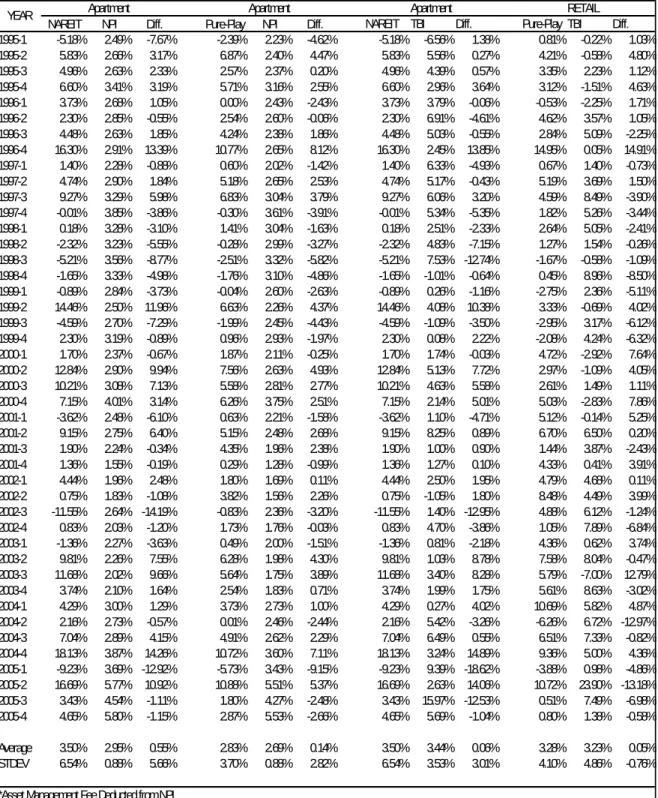
NPI returns include asset management that fees paid by investors. In this thesis, NCREIF

Fund Index – Historical. The Open End Diversified Core Equity Management Fee ratio was

used as an approximation of asset management fees and deducted from NPI and TBI

returns in each quarter.

Public Market Index:

REIT investment fees paid by the investors are approximated by Historical annual data of

Vanguard REIT Fund expense ratios. The annual returns were only available so the data

was spread out to approximate quarterly expense ratios, then deducted from Pure-Play

REIT returns.

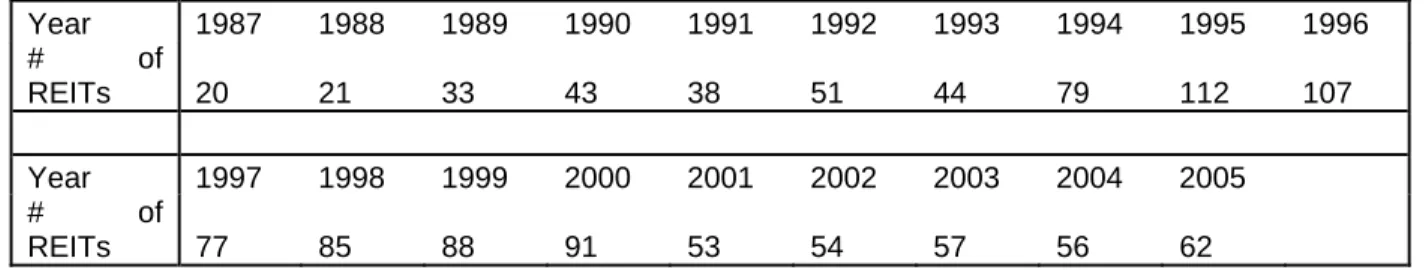
Table 3. NFI-ODCE Management Fee Table 4. Vanguard REIT Index Fund Expense

Fee Ratio 1995 1 0.26% 1995 2 0.26% 1995 3 0.26% 1995 4 0.25% 1996 1 0.25% 1996 2 0.25% 1996 3 0.25% 1996 4 0.26% 1997 1 0.26% 1997 2 0.25% 1997 3 0.25% 1997 4 0.24% 1998 1 0.24% 1998 2 0.24% 1998 3 0.24% 1998 4 0.23% 1999 1 0.24% 1999 2 0.24% 1999 3 0.25% 1999 4 0.26% 2000 1 0.26% 2000 2 0.27% 2000 3 0.27% 2000 4 0.26% 2001 1 0.27% 2001 2 0.27% 2001 3 0.28% 2001 4 0.27% 2002 1 0.27% 2002 2 0.27% 2002 3 0.28% 2002 4 0.27% 2003 1 0.27% 2003 2 0.28% 2003 3 0.27% 2003 4 0.27% 2004 1 0.27% 2004 2 0.27% 2004 3 0.27% 2004 4 0.27% 2005 1 0.26% 2005 2 0.26% 2005 3 0.27% Year Expense Ratio 1995 1 0.09% 1995 2 0.09% 1995 3 0.09% 1995 4 0.09% 1996 1 0.09% 1996 2 0.09% 1996 3 0.09% 1996 4 0.09% 1997 1 0.06% 1997 2 0.06% 1997 3 0.06% 1997 4 0.06% 1998 1 0.06% 1998 2 0.06% 1998 3 0.06% 1998 4 0.06% 1999 1 0.07% 1999 2 0.07% 1999 3 0.07% 1999 4 0.07% 2000 1 0.08% 2000 2 0.08% 2000 3 0.08% 2000 4 0.08% 2001 1 0.08% 2001 2 0.08% 2001 3 0.08% 2001 4 0.08% 2002 1 0.07% 2002 2 0.07% 2002 3 0.07% 2002 4 0.07% 2003 1 0.06% 2003 2 0.06% 2003 3 0.06% 2003 4 0.06% 2004 1 0.06% 2004 2 0.06% 2004 3 0.06% 2004 4 0.06% 2005 1 0.05% 2005 2 0.05% 2005 3 0.05% 2005 4 0.05% Year

(21)

CHAPTER 4

Result: Comparisons by Sectors

4.1 Retail and Office

The result after the adjustment for the apartment and industrial sectors came out as

expected. De-leveraging and Pure-Play effect minimized the differences between the two

markets’ return performances significantly. The adjustments increased consistency

between public and private market by reducing the difference in mean return and volatility.

The difference in the return performances utilizing the NCREIF Property Index was

reduced in the retail sector from 1.37% to 0.58% and in the office sector from 1.30% to

0.40% (Quarterly). Also, the difference in the return performances utilizing the Transaction

Based Index was reduced in the retail sector from 0.65% to - 0.14% and in the office

sector from 0.70% to - 0.19%. The volatility of the public market index was significantly

reduced as represented by the smoothed NAREIT index and significantly lower standard

deviations found in all three sectors (Table 6, 8).

Though the difference in return performances increased after deducting REIT Index Fund

Expenses and Asset Management Fees from TBI and NPI, the author presumes those

adjustments make comparison more precise by reflecting the true characteristics of both

markets. The general movements of the performance are more consistent to each other

after the adjustments, confirming that the methodologies conducted in this thesis were

constructive.

4.2 Apartment and Industrial

However, when the adjustments were applied to the apartment and industrial sectors, an

unexpected result occurred. After the de-leveraging and Pure-Play effect, the mean return

difference with both NPI and TBI increased in the industrial sector from 1.01% to 1.05%

and 0.68% to 0.72% respectively. In the apartment sector the difference with TBI

increased from 0.06% to -0.54%. (Table 6, 8).

(22)

There are several possible explanations for the less effective results in the two sectors. As

the NAREIT Sectored Index defines core sector REITs as 75% or more of book value

invested in that sector, initial NAREIT Sectored return performances had direct exposure

to other sectors that could have created idiosyncratic risks in the target sector. Also,

quarterly return data in the apartment and industrial sectors may have reflected poor

performances that when de-levered, could have increased the mean returns (negative

leverage effect). Lastly, due to the data limitation of utilizing a small sample size, some of

the large REITs in those sectors may have performed poorly and caused a result reflecting

biased mean returns in those sectors.

Although the mean return differences is less effective in the apartment and industrial

sectors, the volatility decreased across the property sectors as indicated by decreased

standard deviation in all four sectors.

(23)

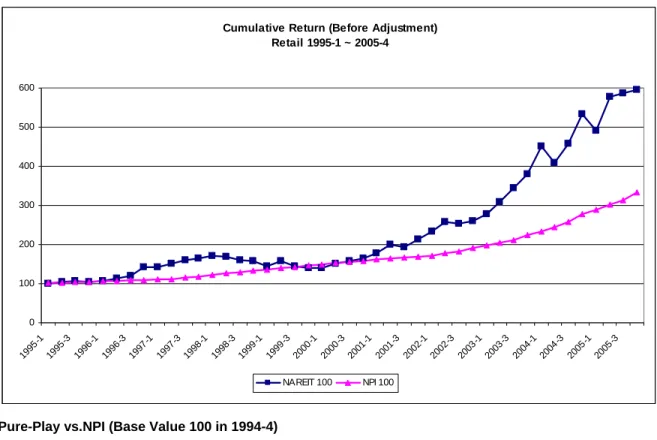
Figure 4. Retail Sector Return Performance Cobmparisons - Plots

NAREIT vs. NPI (Base Value 100 in 1994-4) Quaterly

Cumulative Return (Before Adjustment)

Retail 1995-1 ~ 2005-4

0 100 200 300 400 500 600 1995 -1 1995 -3 1996 -1 1996 -3 1997 -1 1997 -3 1998 -1 1998 -3 1999 -1 1999 -3 200 0-1 2000 -3 2001 -1 2001 -3 2002 -1 2002 -3 200 3-1 2003 -3 2004 -1 2004 -3 2005 -1 2005 -3 NAREIT 100 NPI 100

Pure-Play vs.NPI (Base Value 100 in 1994-4)

Cumulative Return (After Adjustment)

Retail 1995-1 ~ 2005-4

0 100 200 300 400 500 600 1995 -1 1995 -3 1996 -1 1996 -3 1997 -1 1997 -3 1998 -1 1998 -3 1999 -1 1999 -3 2000 -1 200 0-3 2001 -1 200 1-3 2002 -1 200 2-3 2003 -1 200 3-3 2004 -1 200 4-3 2005 -1 200 5-3 PurePlay 100 NPI 100

(24)

NAREIT vs. TBI (Base Value 100 in 1994-4)

Cumulative Return (Before Adjustment)

Retail 1995-1 ~ 2005-4

0 100 200 300 400 500 600 1995 -1 199 5-3 1996 -1 1996 -3 1997 -1 1997 -3 199 8-1 1998 -3 1999 -1 1999 -3 200 0-1 200 0-3 2001 -1 2001 -3 2002 -1 200 2-3 200 3-1 2003 -3 2004 -1 2004 -3 200 5-1 200 5-3 NAREIT 100 TBI 100

Pure-Play vs. TBI (Base Value 100 in 1994-4)

Cumulative Return (After Adjustment)

Retail 1995-1 ~2005-4

0 100 200 300 400 500 600 1995 -1 1995 -3 1996 -1 199 6-3 199 7-1 1997 -3 1998 -1 1998 -3 199 9-1 1999 -3 2000 -1 2000 -3 2001 -1 200 1-3 2002 -1 2002 -3 2003 -1 200 3-3 200 4-1 2004 -3 2005 -1 2005 -3 PurePlay 100 TBI 100

(25)

Table 4. Retail Sector Return Performance Comparisons Data

RETAIL

RETAIL

RETAIL

RETAIL

NAREIT

NPI

Diff.

Pure-Play

NPI

Diff.

NAREIT TBI

Diff.

Pure-Play TBI

Diff.

1995-1

-0.92%

1.75%

-2.67%

0.81%

1.49%

-0.68%

-0.92%

0.04%

-0.96%

0.81%

-0.22%

1.03%

1995-2

4.66%

1.46%

3.20%

4.21%

1.20%

3.01%

4.66%

-0.33%

4.98%

4.21%

-0.58%

4.80%

1995-3

2.04%

1.32%

0.72%

3.35%

1.06%

2.30%

2.04%

2.49%

-0.45%

3.35%

2.23%

1.12%

1995-4

-0.67%

-0.58%

-0.09%

3.12%

-0.83%

3.95%

-0.67%

-1.26%

0.58%

3.12%

-1.51%

4.63%

1996-1

1.44%

1.68%

-0.24%

-0.53%

1.43%

-1.96%

1.44%

-2.00%

3.44%

-0.53%

-2.25%

1.71%

1996-2

7.02%

1.32%

5.70%

4.62%

1.07%

3.55%

7.02%

3.82%

3.20%

4.62%

3.57%

1.05%

1996-3

5.10%

1.74%

3.36%

2.84%

1.49%

1.35%

5.10%

5.34%

-0.24%

2.84%

5.09%

-2.25%

1996-4

17.97%

0.04%

17.93%

14.95%

-0.22%

15.17%

17.97%

0.30%

17.67%

14.95%

0.05%

14.91%

1997-1

0.41%

1.24%

-0.83%

0.67%

0.98%

-0.31%

0.41%

1.66%

-1.25%

0.67%

1.40%

-0.73%

1997-2

5.90%

1.64%

4.26%

5.19%

1.39%

3.80%

5.90%

3.94%

1.96%

5.19%

3.69%

1.50%

1997-3

6.46%

2.33%

4.13%

4.59%

2.08%

2.50%

6.46%

8.74%

-2.27%

4.59%

8.49%

-3.90%

1997-4

3.30%

3.07%

0.23%

1.82%

2.83%

-1.01%

3.30%

5.50%

-2.20%

1.82%

5.26%

-3.44%

1998-1

3.94%

2.91%

1.03%

2.64%

2.67%

-0.03%

3.94%

5.29%

-1.35%

2.64%

5.05%

-2.41%

1998-2

-1.56%

3.52%

-5.08%

1.27%

3.28%

-2.01%

-1.56%

1.77%

-3.33%

1.27%

1.54%

-0.26%

1998-3

-5.78%

2.76%

-8.54%

-1.67%

2.52%

-4.18%

-5.78%

-0.33%

-5.45%

-1.67%

-0.58%

-1.09%

1998-4

-1.18%

3.13%

-4.31%

0.45%

2.90%

-2.44%

-1.18%

9.19% -10.37%

0.45%

8.96%

-8.50%

1999-1

-8.04%

2.21% -10.25%

-2.75%

1.97%

-4.72%

-8.04%

2.60% -10.64%

-2.75%

2.36%

-5.11%

1999-2

8.17%

2.26%

5.91%

3.33%

2.02%

1.31%

8.17%

-0.45%

8.62%

3.33%

-0.69%

4.02%

1999-3

-7.61%

2.16%

-9.77%

-2.95%

1.91%

-4.86%

-7.61%

3.42% -11.03%

-2.95%

3.17%

-6.12%

1999-4

-4.01%

2.59%

-6.60%

-2.08%

2.33%

-4.41%

-4.01%

4.50%

-8.50%

-2.08%

4.24%

-6.32%

2000-1

1.24%

2.01%

-0.77%

4.72%

1.75%

2.96%

1.24%

-2.66%

3.90%

4.72%

-2.92%

7.64%

2000-2

7.61%

2.05%

5.56%

2.97%

1.78%

1.19%

7.61%

-0.82%

8.43%

2.97%

-1.09%

4.05%

2000-3

4.05%

1.92%

2.13%

2.61%

1.65%

0.95%

4.05%

1.76%

2.29%

2.61%

1.49%

1.11%

2000-4

4.07%

1.62%

2.45%

5.03%

1.36%

3.68%

4.07%

-2.56%

6.63%

5.03%

-2.83%

7.86%

2001-1

7.75%

2.24%

5.51%

5.12%

1.97%

3.14%

7.75%

0.13%

7.62%

5.12%

-0.14%

5.25%

2001-2

12.63%

1.90%

10.73%

6.70%

1.63%

5.07%

12.63%

6.78%

5.85%

6.70%

6.50%

0.20%

2001-3

-3.01%

1.31%

-4.32%

1.44%

1.03%

0.41%

-3.01%

4.14%

-7.15%

1.44%

3.87%

-2.43%

2001-4

10.79%

1.23%

9.56%

4.33%

0.96%

3.37%

10.79%

0.69%

10.11%

4.33%

0.41%

3.91%

2002-1

9.06%

1.90%

7.16%

4.79%

1.63%

3.16%

9.06%

4.95%

4.11%

4.79%

4.68%

0.11%

2002-2

10.70%

3.57%

7.13%

8.48%

3.30%

5.18%

10.70%

4.76%

5.94%

8.48%

4.49%

3.99%

2002-3

-1.82%

3.00%

-4.82%

4.88%

2.72%

2.16%

-1.82%

6.40%

-8.22%

4.88%

6.12%

-1.24%

2002-4

2.13%

4.56%

-2.43%

1.05%

4.29%

-3.24%

2.13%

8.16%

-6.03%

1.05%

7.89%

-6.84%

2003-1

7.26%

2.91%

4.35%

4.36%

2.64%

1.73%

7.26%

0.89%

6.37%

4.36%

0.62%

3.74%

2003-2

11.52%

4.06%

7.46%

7.58%

3.78%

3.80%

11.52%

8.32%

3.20%

7.58%

8.04%

-0.47%

2003-3

11.05%

3.09%

7.96%

5.79%

2.82%

2.97%

11.05%

-6.73%

17.77%

5.79%

-7.00%

12.79%

2003-4

10.49%

6.55%

3.94%

5.61%

6.28%

-0.67%

10.49%

8.89%

1.60%

5.61%

8.63%

-3.02%

2004-1

18.87%

3.06%

15.81%

10.69%

2.79%

7.90%

18.87%

6.09%

12.78%

10.69%

5.82%

4.87%

2004-2

-9.39%

5.39% -14.78%

-6.26%

5.12% -11.37%

-9.39%

6.99% -16.38%

-6.26%

6.72% -12.97%

2004-3

11.70%

5.16%

6.54%

6.51%

4.89%

1.62%

11.70%

7.60%

4.10%

6.51%

7.33%

-0.82%

2004-4

16.56%

7.75%

8.81%

9.36%

7.48%

1.88%

16.56%

5.27%

11.29%

9.36%

5.00%

4.36%

2005-1

-7.82%

4.41% -12.23%

-3.88%

4.15%

-8.03%

-7.82%

1.24%

-9.06%

-3.88%

0.98%

-4.86%

2005-2

17.56%

4.36%

13.20%

10.72%

4.10%

6.62%

17.56%

24.16%

-6.61%

10.72%

23.90% -13.18%

2005-3

1.71%

3.88%

-2.17%

0.51%

3.61%

-3.11%

1.71%

7.75%

-6.04%

0.51%

7.49%

-6.98%

2005-4

1.43%

5.98%

-4.55%

0.80%

5.71%

-4.92%

1.43%

1.65%

-0.21%

0.80%

1.38%

-0.58%

Average

4.14%

2.77%

1.37%

3.28%

2.51%

0.77%

4.14%

3.49%

0.65%

3.28%

3.23%

0.05%

STDEV

7.18%

1.65%

5.53%

4.10%

1.65%

2.45%

7.18%

4.86%

2.32%

4.10%

4.86%

-0.76%

*Asset Management Fee Deducted from NPI

** Index Fund Expenses are Deducted from NAREIT index

YEAR

(26)

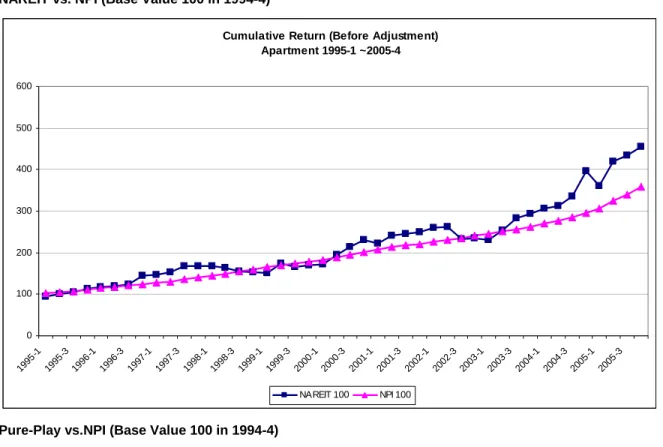
Figure 5. Apartment Sector Return Performance Comparisons – Plots

NAREIT vs. NPI (Base Value 100 in 1994-4)

Cumulative Return (Before Adjustment)

Apartment 1995-1 ~2005-4

0 100 200 300 400 500 600 1995 -1 1995 -3 1996 -1 1996 -3 1997 -1 1997 -3 1998 -1 1998 -3 1999 -1 1999 -3 2000 -1 2000 -3 2001 -1 2001 -3 2002 -1 2002 -3 2003 -1 2003 -3 2004 -1 2004 -3 2005 -1 2005 -3 NAREIT 100 NPI 100

Pure-Play vs.NPI (Base Value 100 in 1994-4)

Cumulative Return (After Adjustments)

Apartments 1995-1 ~ 2005-4

0 100 200 300 400 500 600 1995 -1 1995 -3 1996 -1 1996 -3 1997 -1 1997 -3 1998 -1 1998 -3 1999 -1 1999 -3 2000 -1 2000 -3 2001 -1 2001 -3 2002 -1 2002 -3 2003 -1 2003 -3 2004 -1 2004 -3 2005 -1 2005 -3 PurePlay 100 NPI 100

(27)

NAREIT vs. TBI (Base Value 100 in 1994-4)

Cumulative Return (Before Adjustment)

Apartment 1995-1 ~ 2005-4

0 100 200 300 400 500 600 1995 -1 1995 -3 1996 -1 199 6-3 1997 -1 1997 -3 1998 -1 1998 -3 199 9-1 1999 -3 2000 -1 2000 -3 2001 -1 200 1-3 2002 -1 2002 -3 2003 -1 2003 -3 200 4-1 2004 -3 2005 -1 2005 -3 NAREIT 100 TBI 100

Pure-Play vs. TBI (Base Value 100 in 1994-4)

Cumulative Return (After Adjustment)

Apartment 1995-1 ~2005-4

0 100 200 300 400 500 600 1995 -1 1995 -3 1996 -1 1996 -3 1997 -1 1997 -3 1998 -1 1998 -3 1999 -1 1999 -3 2000 -1 2000 -3 2001 -1 2001 -3 2002 -1 2002 -3 2003 -1 2003 -3 2004 -1 2004 -3 2005 -1 2005 -3 PurePlay 100 TBI 100

(28)

Table 5. Apartment Sector Return Performance Comparisons Data

Apartment

Apartment

Apartment

RETAIL

NAREIT

NPI

Diff.

Pure-Play

NPI

Diff.

NAREIT TBI

Diff.

Pure-Play TBI

Diff.

1995-1

-5.18%

2.49%

-7.67%

-2.39%

2.23%

-4.62%

-5.18%

-6.56%

1.38%

0.81%

-0.22%

1.03%

1995-2

5.83%

2.66%

3.17%

6.87%

2.40%

4.47%

5.83%

5.56%

0.27%

4.21%

-0.58%

4.80%

1995-3

4.96%

2.63%

2.33%

2.57%

2.37%

0.20%

4.96%

4.39%

0.57%

3.35%

2.23%

1.12%

1995-4

6.60%

3.41%

3.19%

5.71%

3.16%

2.55%

6.60%

2.96%

3.64%

3.12%

-1.51%

4.63%

1996-1

3.73%

2.68%

1.05%

0.00%

2.43%

-2.43%

3.73%

3.79%

-0.06%

-0.53%

-2.25%

1.71%

1996-2

2.30%

2.85%

-0.55%

2.54%

2.60%

-0.06%

2.30%

6.91%

-4.61%

4.62%

3.57%

1.05%

1996-3

4.48%

2.63%

1.85%

4.24%

2.38%

1.86%

4.48%

5.03%

-0.55%

2.84%

5.09%

-2.25%

1996-4

16.30%

2.91% 13.39%

10.77%

2.65%

8.12%

16.30%

2.45% 13.85%

14.95%

0.05% 14.91%

1997-1

1.40%

2.28%

-0.88%

0.60%

2.02%

-1.42%

1.40%

6.33%

-4.93%

0.67%

1.40%

-0.73%

1997-2

4.74%

2.90%

1.84%

5.18%

2.65%

2.53%

4.74%

5.17%

-0.43%

5.19%

3.69%

1.50%

1997-3

9.27%

3.29%

5.98%

6.83%

3.04%

3.79%

9.27%

6.06%

3.20%

4.59%

8.49%

-3.90%

1997-4

-0.01%

3.85%

-3.86%

-0.30%

3.61%

-3.91%

-0.01%

5.34%

-5.35%

1.82%

5.26%

-3.44%

1998-1

0.18%

3.28%

-3.10%

1.41%

3.04%

-1.63%

0.18%

2.51%

-2.33%

2.64%

5.05%

-2.41%

1998-2

-2.32%

3.23%

-5.55%

-0.28%

2.99%

-3.27%

-2.32%

4.83%

-7.15%

1.27%

1.54%

-0.26%

1998-3

-5.21%

3.56%

-8.77%

-2.51%

3.32%

-5.82%

-5.21%

7.53% -12.74%

-1.67%

-0.58%

-1.09%

1998-4

-1.65%

3.33%

-4.98%

-1.76%

3.10%

-4.86%

-1.65%

-1.01%

-0.64%

0.45%

8.96%

-8.50%

1999-1

-0.89%

2.84%

-3.73%

-0.04%

2.60%

-2.63%

-0.89%

0.26%

-1.16%

-2.75%

2.36%

-5.11%

1999-2

14.46%

2.50% 11.96%

6.63%

2.26%

4.37%

14.46%

4.08% 10.38%

3.33%

-0.69%

4.02%

1999-3

-4.59%

2.70%

-7.29%

-1.99%

2.45%

-4.43%

-4.59%

-1.09%

-3.50%

-2.95%

3.17%

-6.12%

1999-4

2.30%

3.19%

-0.89%

0.96%

2.93%

-1.97%

2.30%

0.08%

2.22%

-2.08%

4.24%

-6.32%

2000-1

1.70%

2.37%

-0.67%

1.87%

2.11%

-0.25%

1.70%

1.74%

-0.03%

4.72%

-2.92%

7.64%

2000-2

12.84%

2.90%

9.94%

7.56%

2.63%

4.93%

12.84%

5.13%

7.72%

2.97%

-1.09%

4.05%

2000-3

10.21%

3.08%

7.13%

5.58%

2.81%

2.77%

10.21%

4.63%

5.58%

2.61%

1.49%

1.11%

2000-4

7.15%

4.01%

3.14%

6.26%

3.75%

2.51%

7.15%

2.14%

5.01%

5.03%

-2.83%

7.86%

2001-1

-3.62%

2.48%

-6.10%

0.63%

2.21%

-1.58%

-3.62%

1.10%

-4.71%

5.12%

-0.14%

5.25%

2001-2

9.15%

2.75%

6.40%

5.15%

2.48%

2.68%

9.15%

8.25%

0.89%

6.70%

6.50%

0.20%

2001-3

1.90%

2.24%

-0.34%

4.35%

1.96%

2.38%

1.90%

1.00%

0.90%

1.44%

3.87%

-2.43%

2001-4

1.36%

1.55%

-0.19%

0.29%

1.28%

-0.99%

1.36%

1.27%

0.10%

4.33%

0.41%

3.91%

2002-1

4.44%

1.96%

2.48%

1.80%

1.69%

0.11%

4.44%

2.50%

1.95%

4.79%

4.68%

0.11%

2002-2

0.75%

1.83%

-1.08%

3.82%

1.56%

2.26%

0.75%

-1.05%

1.80%

8.48%

4.49%

3.99%

2002-3

-11.55%

2.64% -14.19%

-0.83%

2.36%

-3.20%

-11.55%

1.40% -12.95%

4.88%

6.12%

-1.24%

2002-4

0.83%

2.03%

-1.20%

1.73%

1.76%

-0.03%

0.83%

4.70%

-3.86%

1.05%

7.89%

-6.84%

2003-1

-1.36%

2.27%

-3.63%

0.49%

2.00%

-1.51%

-1.36%

0.81%

-2.18%

4.36%

0.62%

3.74%

2003-2

9.81%

2.26%

7.55%

6.28%

1.98%

4.30%

9.81%

1.03%

8.78%

7.58%

8.04%

-0.47%

2003-3

11.68%

2.02%

9.66%

5.64%

1.75%

3.89%

11.68%

3.40%

8.28%

5.79%

-7.00% 12.79%

2003-4

3.74%

2.10%

1.64%

2.54%

1.83%

0.71%

3.74%

1.99%

1.75%

5.61%

8.63%

-3.02%

2004-1

4.29%

3.00%

1.29%

3.73%

2.73%

1.00%

4.29%

0.27%

4.02%

10.69%

5.82%

4.87%

2004-2

2.16%

2.73%

-0.57%

0.01%

2.46%

-2.44%

2.16%

5.42%

-3.26%

-6.26%

6.72% -12.97%

2004-3

7.04%

2.89%

4.15%

4.91%

2.62%

2.29%

7.04%

6.49%

0.55%

6.51%

7.33%

-0.82%

2004-4

18.13%

3.87% 14.26%

10.72%

3.60%

7.11%

18.13%

3.24% 14.89%

9.36%

5.00%

4.36%

2005-1

-9.23%

3.69% -12.92%

-5.73%

3.43%

-9.15%

-9.23%

9.39% -18.62%

-3.88%

0.98%

-4.86%

2005-2

16.69%

5.77% 10.92%

10.88%

5.51%

5.37%

16.69%

2.63% 14.06%

10.72% 23.90% -13.18%

2005-3

3.43%

4.54%

-1.11%

1.80%

4.27%

-2.48%

3.43% 15.97% -12.53%

0.51%

7.49%

-6.98%

2005-4

4.65%

5.80%

-1.15%

2.87%

5.53%

-2.66%

4.65%

5.69%

-1.04%

0.80%

1.38%

-0.58%

Average

3.50%

2.95%

0.55%

2.83%

2.69%

0.14%

3.50%

3.44%

0.06%

3.28%

3.23%

0.05%

STDEV

6.54%

0.88%

5.66%

3.70%

0.88%

2.82%

6.54%

3.53%

3.01%

4.10%

4.86%

-0.76%

*Asset Management Fee Deducted from NPI

** Index Fund Expenses are Deducted from NAREIT index

YEAR

(29)

Figure 6. Office Sector Return Performance Comparisons – Plots

NAREIT vs. NPI (Base Value 100 in 1994-4)

Cumulative Returns (Before Adjustment)

Office 1995-1 ~ 2005-4

0 100 200 300 400 500 600 1995 -1 1995 -3 1996 -1 1996 -3 1997 -1 199 7-3 1998 -1 1998 -3 1999 -1 1999 -3 200 0-1 2000 -3 2001 -1 2001 -3 2002 -1 2002 -3 2003 -1 2003 -3 200 4-1 2004 -3 2005 -1 2005 -3 NAREIT 100 NPI 100

Pure-Play vs.NPI (Base Value 100 in 1994-4)

Cumulative Return (Before Adjustment)

Office 1995-1 ~2005-4

0 100 200 300 400 500 600 1995 -1 1995 -3 1996 -1 1996 -3 1997 -1 1997 -3 1998 -1 1998 -3 1999 -1 1999 -3 2000 -1 2000 -3 2001 -1 2001 -3 2002 -1 2002 -3 2003 -1 2003 -3 2004 -1 2004 -3 2005 -1 2005 -3 NAREIT 100 NPI 100

(30)

NAREIT vs. TBI (Base Value 100 in 1994-4)

Cumulative Return (Before Adjustment)

Office 1995-1 ~ 2005-4

0 100 200 300 400 500 600 1995 -1 1995 -3 1996 -1 1996 -3 1997 -1 1997 -3 1998 -1 1998 -3 1999 -1 1999 -3 2000 -1 2000 -3 2001 -1 2001 -3 2002 -1 2002 -3 2003 -1 2003 -3 2004 -1 2004 -3 2005 -1 2005 -3 NAREIT 100 TBI 100

Pure-Play vs. TBI (Base Value 100 in 1994-4)

Cumulative Return (After Adjustment)

Office 1995-1 ~ 2005-4

0 100 200 300 400 500 600 1995 -1 1995 -3 1996 -1 1996 -3 1997 -1 1997 -3 1998 -1 1998 -3 1999 -1 1999 -3 2000 -1 2000 -3 2001 -1 2001 -3 2002 -1 2002 -3 2003 -1 2003 -3 2004 -1 2004 -3 2005 -1 2005 -3 PurePlay 100 TBI 100

(31)

Table 6. Office Sector Return Performance Comparisons Data

Office

Office

Office

Office

NAREIT

NPI

Diff.

Pure-Play

NPI

Diff.

NAREIT TBI

Diff.

Pure-Play TBI

Diff.

1995-1

2.64%

1.91%

0.73%

0.65%

1.65%

-1.00%

2.64%

3.44%

-0.80%

0.65%

3.18%

-2.53%

1995-2

10.91%

1.98%

8.93%

6.11%

1.72%

4.38%

10.91%

4.56%

6.35%

6.11%

4.30%

1.81%

1995-3

7.84%

2.17%

5.67%

3.95%

1.91%

2.04%

7.84%

6.95%

0.89%

3.95%

6.68%

-2.74%

1995-4

13.06%

0.95%

12.11%

6.79%

0.70%

6.09%

13.06%

0.47%

12.59%

6.79%

0.21%

6.58%

1996-1

4.70%

2.67%

2.03%

1.45%

2.42%

-0.97%

4.70%

1.57%

3.13%

1.45%

1.32%

0.13%

1996-2

6.22%

2.75%

3.47%

1.98%

2.50%

-0.52%

6.22%

6.62%

-0.41%

1.98%

6.37%

-4.39%

1996-3

12.00%

2.57%

9.43%

7.45%

2.32%

5.13%

12.00%

-2.07%

14.07%

7.45%

-2.32%

9.77%

1996-4

21.88%

4.96%

16.92%

13.04%

4.70%

8.34%

21.88%

8.62%

13.26%

13.04%

8.36%

4.67%

1997-1

0.48%

3.04%

-2.56%

2.80%

2.78%

0.02%

0.48%

7.54%

-7.06%

2.80%

7.28%

-4.48%

1997-2

4.88%

3.36%

1.52%

-0.10%

3.11%

-3.20%

4.88%

6.47%

-1.59%

-0.10%

6.22%

-6.32%

1997-3

22.32%

3.87%

18.45%

9.75%

3.62%

6.13%

22.32%

8.68%

13.63%

9.75%

8.44%

1.31%

1997-4

0.08%

6.55%

-6.47%

6.43%

6.31%

0.12%

0.08%

8.25%

-8.18%

6.43%

8.01%

-1.58%

1998-1

-2.23%

5.48%

-7.71%

0.82%

5.24%

-4.42%

-2.23%

7.24%

-9.47%

0.82%

7.00%

-6.18%

1998-2

-6.25%

4.87% -11.12%

-2.10%

4.63%

-6.74%

-6.25%

2.18%

-8.43%

-2.10%

1.95%

-4.05%

1998-3

-11.76%

3.82% -15.58%

-5.68%

3.58%

-9.25%

-11.76%

-1.44% -10.32%

-5.68%

-1.68%

-3.99%

1998-4

2.19%

4.15%

-1.96%

2.74%

3.92%

-1.18%

2.19%

2.00%

0.19%

2.74%

1.77%

0.97%

1999-1

-0.95%

2.77%

-3.72%

-4.79%

2.53%

-7.32%

-0.95%

2.76%

-3.70%

-4.79%

2.51%

-7.31%

1999-2

11.54%

2.80%

8.74%

9.02%

2.56%

6.45%

11.54%

1.58%

9.96%

9.02%

1.35%

7.67%

1999-3

-8.18%

3.16% -11.34%

-4.32%

2.91%

-7.23%

-8.18%

0.02%

-8.20%

-4.32%

-0.23%

-4.09%

1999-4

2.76%

2.96%

-0.20%

3.53%

2.70%

0.83%

2.76%

0.64%

2.12%

3.53%

0.39%

3.15%

2000-1

6.01%

2.66%

3.35%

3.54%

2.40%

1.14%

6.01%

3.09%

2.91%

3.54%

2.84%

0.70%

2000-2

9.97%

3.52%

6.45%

6.96%

3.25%

3.71%

9.97%

3.79%

6.18%

6.96%

3.52%

3.43%

2000-3

13.42%

3.32%

10.10%

5.19%

3.05%

2.14%

13.42%

3.35%

10.07%

5.19%

3.08%

2.11%

2000-4

2.45%

3.97%

-1.52%

6.67%

3.71%

2.97%

2.45%

0.92%

1.53%

6.67%

0.66%

6.02%

2001-1

-5.19%

2.35%

-7.54%

0.46%

2.08%

-1.62%

-5.19%

2.74%

-7.92%

0.46%

2.47%

-2.01%

2001-2

11.57%

2.32%

9.25%

3.15%

2.05%

1.11%

11.57%

-0.68%

12.25%

3.15%

-0.95%

4.10%

2001-3

0.99%

1.46%

-0.47%

0.50%

1.18%

-0.69%

0.99%

0.59%

0.39%

0.50%

0.32%

0.18%

2001-4

-0.17%

-0.03%

-0.14%

3.44%

-0.30%

3.75%

-0.17%

-1.29%

1.12%

3.44%

-1.57%

5.01%

2002-1

5.21%

0.95%

4.26%

5.14%

0.68%

4.46%

5.21%

4.95%

0.26%

5.14%

4.68%

0.47%

2002-2

2.82%

0.81%

2.01%

6.40%

0.54%

5.86%

2.82%

-1.86%

4.68%

6.40%

-2.13%

8.53%

2002-3

-11.84%

0.83% -12.67%

0.05%

0.55%

-0.50%

-11.84%

7.85% -19.69%

0.05%

7.57%

-7.52%

2002-4

-1.75%

0.22%

-1.97%

0.80%

-0.05%

0.86%

-1.75%

-0.39%

-1.36%

0.80%

-0.66%

1.46%

2003-1

2.13%

1.27%

0.86%

2.86%

1.00%

1.87%

2.13%

2.13%

0.00%

2.86%

1.86%

1.00%

2003-2

13.38%

1.48%

11.90%

5.65%

1.20%

4.45%

13.38%

0.82%

12.56%

5.65%

0.54%

5.11%

2003-3

5.35%

1.26%

4.09%

4.56%

0.99%

3.57%

5.35%

3.52%

1.82%

4.56%

3.25%

1.30%

2003-4

9.86%

1.70%

8.16%

4.95%

1.43%

3.52%

9.86%

1.57%

8.29%

4.95%

1.30%

3.65%

2004-1

9.04%

2.26%

6.78%

10.53%

1.99%

8.54%

9.04%

2.03%

7.01%

10.53%

1.76%

8.77%

2004-2

-5.88%

2.38%

-8.26%

-5.04%

2.11%

-7.14%

-5.88%

6.73% -12.61%

-5.04%

6.46% -11.50%

2004-3

6.82%

3.20%

3.62%

2.97%

2.93%

0.04%

6.82%

-0.43%

7.25%

2.97%

-0.70%

3.67%

2004-4

12.46%

3.73%

8.73%

6.59%

3.46%

3.12%

12.46%

4.75%

7.71%

6.59%

4.48%

2.11%

2005-1

-3.34%

3.25%

-6.59%

-4.47%

2.99%

-7.45%

-3.34%

3.33%

-6.67%

-4.47%

3.07%

-7.53%

2005-2

12.19%

4.78%

7.41%

7.83%

4.52%

3.32%

12.19%

10.78%

1.41%

7.83%

10.52%

-2.69%

2005-3

4.69%

5.09%

-0.40%

2.61%

4.82%

-2.21%

4.69%

6.79%

-2.10%

2.61%

6.53%

-3.91%

2005-4

-0.37%

5.25%

-5.62%

2.06%

4.98%

-2.93%

-0.37%

12.07% -12.44%

2.06%

11.80%

-9.75%

Average

4.13%

2.83%

1.30%

3.16%

2.57%

0.60%

4.13%

3.43%

0.70%

3.16%

3.16%

0.00%

STDEV

7.74%

1.49%

6.25%

4.26%

1.49%

2.77%

7.74%

3.53%

4.21%

4.26%

3.53%

0.73%

*Asset Management Fee Deducted from NPI

** Index Fund Expenses are Deducted from NAREIT index

YEAR

(32)

Figure 7. Industrial Sector Return Performance Comparisons – Plots

NAREIT vs. NPI (Base Value 100 in 1994-4)

Cumulative Retruns (Before Adjustment)

Industrial 1995-1 ~ 2005-4

0 100 200 300 400 500 600 199 5-1 199 5-3 199 6-1 199 6-3 199 7-1 19 97-3 199 8-1 199 8-3 199 9-1 19 99-3 200 0-1 2000 -3 200 1-1 200 1-3 200 2-1 200 2-3 20 03-1 200 3-3 2004 -1 200 4-3 200 5-1 200 5-3 NAREIT 100 NPI 100

Pure-Play vs.NPI (Base Value 100 in 1994-4)

Cumulative Return (After Adjustment)

Industrial 1995-1 ~ 2005-4

0 100 200 300 400 500 600 1995 -1 1995 -3 19 96-1 1996 -3 1997 -1 19 97-3 19 98-1 1998 -3 19 99-1 19 99-3 2000 -1 2000 -3 20 01-1 2001 -3 2002 -1 20 02-3 2003 -1 2003 -3 20 04-1 2004 -3 2005 -1 20 05-3 PurePlay 100 NPI 100

(33)

NAREIT vs. TBI (Base Value 100 in 1994-4)

Cumulative Return (Before Adjustment)

Industrial 1995-1 ~ 2005-4

0 100 200 300 400 500 600 1995 -1 1995 -3 1996 -1 1996 -3 1997 -1 1997 -3 1998 -1 199 8-3 199 9-1 199 9-3 200 0-1 200 0-3 2001 -1 2001 -3 2002 -1 2002 -3 2003 -1 2003 -3 2004 -1 2004 -3 2005 -1 2005 -3 NAREIT 100 TBI 100

Pure-Play vs. TBI (Base Value 100 in 1994-4)

Cumulative Return (After Adjustment)

Industrial 1995-1 ~ 2005-4

0 100 200 300 400 500 600 1995 -1 1995 -3 19 96-1 1996 -3 1997 -1 19 97-3 19 98-1 1998 -3 1999 -1 19 99-3 2000 -1 2000 -3 20 01-1 2001 -3 2002 -1 20 02-3 20 03-1 2003 -3 2004 -1 20 04-3 2005 -1 2005 -3 PurePlay 100 TBI 100

Figure

Figure 1. Historical Market Capitalization of REITs  –  Source:  NAREIT
Figure 2. Total Returns of REITs VS NCREIF –  Source:  NAREIT and NCREIF
Figure 3. Total Returns of REITs VS TBI –  Source:  NAREIT and TBI - MIT CRE
Table 1. Example of Pure-Play portfolio
+7

Références

Documents relatifs

Katja Klumpp, Clement Stahl, Robert Falcimagne, Olivier Darsonville, Benoît Burban, et al.. Effect of agricultural practics and climate on carbon storage potential of two

Active learning and user segmentation for the cold-start problem in recommendation systems.. Alabdulrahman, Rabaa; Viktor, Herna;

Herein, we have evaluated the immunostimula- tory effects of SLA archaeosomes when used as adjuvant with ovalbumin (OVA) and hepati- tis B surface antigen (HBsAg) and compared this

Just as in the Sz = 3/2 case, for a given hole state we can take the Fourier transform of the five Ah B h minority spin pair configurations to obtain the states differentiated by

26 Another earlier powder neutron diffraction study suggested that the CO 2 guest in each large cage lies in the equatorial plane of the cage at 14 K by assuming the carbon atom of

Electricity production in a microbial fuel cell (MFC) offers an alternative method of power generation, where a broad range of renewable carbon sources can be used [1–7]. In a

The following observations are made based on the model analysis: (i) the ratio between the anodophilic and methanogenic populations can be controlled by the electrical load;

/ La version de cette publication peut être l’une des suivantes : la version prépublication de l’auteur, la version acceptée du manuscrit ou la version de l’éditeur. For