Publisher’s version / Version de l'éditeur:
Industrial and engineering chemistry research, 49, 19, pp. 9222-9229, 2010
READ THESE TERMS AND CONDITIONS CAREFULLY BEFORE USING THIS WEBSITE.
https://nrc-publications.canada.ca/eng/copyright
Vous avez des questions? Nous pouvons vous aider. Pour communiquer directement avec un auteur, consultez la
première page de la revue dans laquelle son article a été publié afin de trouver ses coordonnées. Si vous n’arrivez pas à les repérer, communiquez avec nous à [email protected].
Questions? Contact the NRC Publications Archive team at
[email protected]. If you wish to email the authors directly, please see the first page of the publication for their contact information.
NRC Publications Archive
Archives des publications du CNRC
This publication could be one of several versions: author’s original, accepted manuscript or the publisher’s version. / La version de cette publication peut être l’une des suivantes : la version prépublication de l’auteur, la version acceptée du manuscrit ou la version de l’éditeur.
For the publisher’s version, please access the DOI link below./ Pour consulter la version de l’éditeur, utilisez le lien DOI ci-dessous.
https://doi.org/10.1021/ie1004898
Access and use of this website and the material on it are subject to the Terms and Conditions set forth at
Optimizing treatment performance of microbial fuel cells by reactor
staging
Pinto, Roberto P.; Tartakovsky, Boris; Perrier, Michel; Srinivasan, Bala
https://publications-cnrc.canada.ca/fra/droits
L’accès à ce site Web et l’utilisation de son contenu sont assujettis aux conditions présentées dans le site LISEZ CES CONDITIONS ATTENTIVEMENT AVANT D’UTILISER CE SITE WEB.
NRC Publications Record / Notice d'Archives des publications de CNRC:
https://nrc-publications.canada.ca/eng/view/object/?id=784d3669-e863-4fb1-8aec-4e93d07250e8 https://publications-cnrc.canada.ca/fra/voir/objet/?id=784d3669-e863-4fb1-8aec-4e93d07250e8Optimizing Treatment Performance of Microbial Fuel Cells by Reactor Staging
Roberto P. Pinto,†,‡Boris Tartakovsky,†,‡Michel Perrier,‡and Bala Srinivasan*,‡
Biotechnology Research Institute, National Research Council, 6100 Royalmount AVenue, Montre´al, Quebec, Canada H4P 2R2, and Departement de Ge´nie Chimique, E´ cole Polytechnique Montre´al, C.P. 6079 Succ., Centre-Ville Montre´al, Quebec, Canada H3C 3A7
Microbial fuel cells (MFCs) are capable of producing electricity while cleaning wastewater. The goal of this work is to optimize an MFC-based wastewater treatment process to maximize the amount of wastewater that is cleaned. An MFC mathematical model is used to compare different operating modes and reactor configurations. The following observations are made based on the model analysis: (i) the ratio between the anodophilic and methanogenic populations can be controlled by the electrical load; (ii) coexistence of the two populations decreases reactor performance; (iii) MFCs that are connected in series always improve treatment efficiency; and (iv) influent and effluent concentrations can be used to define the best series configuration.
1. Introduction
The energy and infrastructure required to treat polluted wastewater streams represents a major challenge for modern society. Among the many technologies available to treat wastewater, some consume energy, whereas others use organic substances as a source of renewable energy, such as anaerobic digestion (AD). The latter are more promising but often require a step of aerobic post-treatment (polishing) to satisfy wastewater treatment norms. Microbial fuel cells (MFCs) represent a novel technology capable of producing electricity from low-strength wastewaters.1-3
MFCs are bioreactors that convert a large variety of highly diluted organic matter of various compositions into electricity.4 They contain anodophilic bacteria that oxidize organic matter and transfer electrons to an electrode as a part of their metabolism.5MFCs can be operated at low organic loads, where the conventional anaerobic digestion fails due to low reactions rates and washout of methanogenic microorganisms.6
Although MFCs present an interesting alternative for waste-water treatment, industrial-scale MFC treatment has not yet been implemented and the optimal reactor design and configuration are still unknown. Though examining several configurations in laboratory experiments is possible, it is very time-consuming and expensive. One solution for choosing the best configuration for MFCs is to build a mathematical model that can describe its dynamic behavior and use it to predict and study several possible configurations. This option would be fast and inex-pensive compared to the alternative of experimentation tests only.
In the modeling of MFCs, the presence of different types of microorganisms is an important aspect that needs to be taken into account. Similar to anaerobic digestion, an MFC operated on wastewater contains a complex microbial community con-sisting of fermentative, methanogenic, and anodophilic micro-organisms.7-10The balance between different members of this community might affect the MFCs’ wastewater treatment capacity (flow rate for a given effluent concentration). In particular, the competition for the same substrate between methanogenic and anodophilic microorganisms has a direct impact on the MFCs’ treatment capacity. It has been reported
that anodophils consume more organic matter at low substrate concentrations due to low substrate half-saturation constant,11 whereas methanogens perform well at high substrate concentra-tions.12
Dynamic mathematical models that describe the behavior of diverse microbial populations have already been presented.13,14 Among these two models, the model presented by Pinto et al. is chosen here for further analysis because it is simpler, has some of its parameters estimated and validated, and yet captures the essential details pertaining to substrate consumption.14
So far, very little work is reported on the analysis of MFC models. On the contrary, bioreactor models with multiple populations have been analyzed in depth15and most of them represent a phenomenon called the “competitive exclusion principle”.16This principle states that one of the microorganisms will become extinct depending upon the choice of the model parameters and operating conditions. The first goal of this paper is to study if such a phenomenon occurs in MFCs. The additional goals are to determine (i) the types of microorganisms, which are beneficial in terms of treatment capacity under various operating conditions, and (ii) the configurations of intercon-nection (series or parallel) when several MFCs are present. In this paper, the long-term effects of external (electric) load and influent substrate concentration on MFC treatment capacity are analyzed and conditions leading to coexistence of the metha-nogenic and anodophilic microorganisms are discussed. Fur-thermore, the MFCs connection that leads to the best system performance is discussed.
2. Dynamic Model for Microbial Fuel Cells
2.1. Model Balances. This section presents an MFC model
derived from Pinto et al. that will be used for the analysis and optimization purposes in this paper.14 The model takes into account the competition between anodophilic and methanogenic microorganisms for a source of carbon (acetate). The dynamic mass balance equations of the model are given below: * Author for correspondence. Phone: 1-514-340-4711ext. 7472. Fax:
1-514-340-5150. E-mail: [email protected]. †
National Research Council. ‡E´ cole Polytechnique Montre´al.
dS dt ) -qmax,aS KS,a+S Mox KM+M ox xa -qmax,mS KS,m+Sxm +D(S0-S) (1) 10.1021/ie1004898 2010 American Chemical Society
Published on Web 08/18/2010
where S and S0are the substrate concentration and the influent substrate concentration, respectively [mgSL
-1]; x
aand xmare the concentration of anodophilic and methanogenic microorgan-isms, respectively [mgxL
-1]; t is time [days]; K
dis the decay rate [days-1]; D is the dilution rate [D ) F
in V -1]; F
in is the incoming flow [L days-1]; V is the anodic compartment volume [L]; U is the specific growth rate [days-1];µ
maxis the maximum growth rate [days-1]; q
maxis the maximum substrate consump-tion rate [mgS mgx
-1 days-1]; and K is the half-saturation (Monod) constant [mgSL
-1or mg ML
-1]; M
oxis the oxidized mediator fraction per anodophilic microorganism [mgMmgx
-1];
Yis the mediator yield [mgMmgS -1]; I
MFCis the MFC current [A]; F is the Faraday constant [A days mole--1]; γ is the mediator molar mass [mgMmolmed
-1]; and m is the number of electrons transferred per mol of mediator [mole-mol
med -1]; R is a dimensionless biofilm formation retention parameter, which was defined using a two-phase biofilm growth model as
where Kx is the steepness factor [L mgx
-1] and X
max is the maximal attainable biomass concentration [mgxL
-1]. The parameter R is used to ensure that the sum of microbial populations in the biofilm cannot exceed a maximum value (Xmax, the maximal attainable biomass concentration). However, application of eq 5 is limited to D > µmax,mand D > µmax,a. Steady-state simulation results show that, if D <µmax,m and D < µmax,a, the biomass would grow without limitations, so (xm+xa) > Xmaxand eq 5 does not serve the purpose.
The MFC current is calculated by an electrochemical balance neglecting activation losses. Open circuit potential and internal resistance values were simulated as a function of the anodophilic microorganisms’ concentration in the biofilm:
where EOCV is the MFC open circuit voltage [V]; Rext is the external resistance [Ω]; and Rintis the internal resistance [Ω]. More details of the model, parameter descriptions, and values can be found in the Appendix.
3. Model Analysis: Coexistence and Substrate Consumption
3.1. Biofilm Retention and Washout. In the region of model
validity (D >µmax,mand D > µmax,a), it will be shown that the total biomass in the system at steady state is always equal to
Xmax.
Lemma 1. Let Kx.0, S0> 0, Kd)0, D >µmax,m, and D > µmax,a. Then no stable equilibrium point exists if (xm+ xa) *
Xmax.
Proof. First note that, if D and S0are positive, the steady-state solution of eq 1 assures that S is always different from zero. Also, the dynamics of substrate consumption and oxidized mediator were considered to be much faster than the dynamics of anodophilic and methanogenic microorganisms’ growth, because the time constants for substrate consumption and oxidized mediator were, respectively, in hours and mseconds, while anodophils’ and methanogens’ time constants were in days. Thus, only eqs 2 and 3 will be used for further analysis. These equations can be locally linearized to give
The parameter Kxis used in eq 5 to ensure that R switches between 0 and 1. So, three cases can be distinguished, i.e., (a) R )0 when (xm+xa) < Xmax, (b) R ) 1, (xm+xa) > Xmax, and (c) R takes a value between 0 and 1 for (xm+xa) ) Xmax.
Consider the case R ) 0. Sinceµmax,m> 0, S > 0, the only steady-state solution of eq 3 is xm ) 0. Also, any value is allowed for xaas long as xa< Xmax. By substituting R ) 0 in eq 9, it can be seen that at least the second eigenvalue is positive, thereby leading to an unstable solution.
Consider the case R ) 1. Since D > max{µmax,m,µmax,a} > max{Um, Ua}, the only steady-state equilibrium point of eqs 2 and 3 is xm) 0 and xa)0. However, xm )0 and xa)0 is inconsistent with the assumption that R ) 1, which requires (xm+xa) > Xmax. So, if ever there is a stable equilibrium point, it should only correspond to (xm+xa) ) Xmax.
3.2. Competitive Exclusion and Coexistence. One of the
first questions to be answered is related to the coexistence of the two populations. The competitive exclusion principle16 suggests the extinction of one of the species when there is a competition for the same substrate in the same ecological niche. This principle was mathematically characterized by Harmand et al., who showed that similar kinetics for growth rate are required to cause this type of exclusion.15 In the model considered, only the growth rate of anodophilic microorganisms is limited by the mediator concentration. The mediator concen-tration in turn is influenced by the external resistance; hence, the external resistance plays a key role in the type of microorganisms that are present in the MFC. This effect is explained in the following proposition.
Proposition 1. Let the decay rates be negligible and the
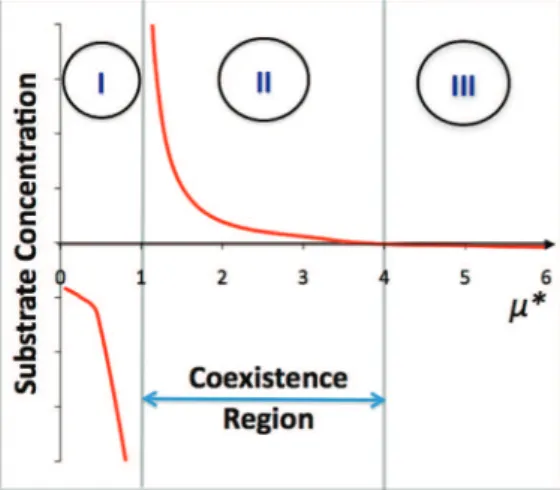
half-rate constants of the Monod kinetics of the methanogens be greater than that of the anodophils, i.e., KS,m> KS,a. Then, the coexistence of the two populations is determined by the expressionµ* ) (µmax,m/µmax,a)[(KM+Mox)/Mox]. Three regions can be distinguished based on the value ofµ*: (I) µ* < 1, only anodophils exist; (II) 1 <µ* < KS,m/KS,a, both microorganisms coexist; and (III)µ* > KS,m/KS,a, only methanogens exist.
Proof. The steady-state solution of eqs 2 and 3 presents three
possible equilibrium points (neglecting the washout solution): (I) A ) 0 and xm)0 (only anodophilic microorganisms) (II) A ) 0 and B ) 0 (coexistence)
(III) B ) 0 and xa)0 (only methanogenic microorganisms) where A ) Ua- RDand B ) Um- RD. dxa dt )(Ua-Kd,a- RD)xa, where Ua) µmax,aS KS,a+S Mox KM+Mox (2) dxm dt )(Um -Kd,m- RD)xm, where Um) µmax,mS KS,m +S (3) dMox dt ) -Y qmax,aS KS,a+S Mox KM+Mox +γ IMFC mFVxa (4) R )
(
1 + tanh[Kx(xa +xm-Xmax)] 2)
(5) IMFC)[
EOCV- RT mFln(
Mtotal Mtotal-Mox)
]
(Rext+R int) (6) Rint)Rmin+(Rmax-Rmin) e
-KRxa (7)
EOCV )E
min+(Emax-Emin) e
-1/KRxa (8)
[
d∆xa/ dt d∆xm/ dt]
)[
(Ua- RD) - 2R(1 - R)KxDxa -2R(1 - R)KxDxa -2R(1 - R)KxDxm (Um- RD) - 2R(1 - R)KxDxm]
×[
∆xa ∆xm]
(9)To study the stability of the equilibrium points I-III, once again the dynamics of substrate consumption and oxidized mediator were assumed to be much faster than the dynamics of bacteria growth. Eqs 2 and 3 can be linearized as in eq 9.
Now we consider the equilibrium point at I, for which A ) 0 and xm)0. The Jacobian that corresponds to this solution can be written as
This equilibrium point is only stable when Um < Ua. The reverse case occurs for the solution of case III, where stability is only possible when Ua< Um.
For coexistence to occur (i.e., A ) B ) 0), the following condition has to be satisfied:
Equation 11 can be solved to give
If the above expression gives a positive value of S, coexist-ence is possible. On the contrary, negative values of S indicate that one of the microorganisms would be extinct. Therefore, coexistence is possible only between 1 <µ* < Ks,m/Ks,a.
In particular, whenµ* < 1, it can be shown that Ua> Umfor any values of S and only solution I is stable. Meanwhile, for
KS,m/KS,a< µ*, one can see that Um> Uafor any values of S and only solution III is stable. The relationship between S and µ* is represented in Figure 1.
To illustrate this proof, the influence of the external resistance on the populations at steady state is presented in Figure 2. The
Rext varied between 10 and 5000 Ω, while the influent concentration was 1000 mg L-1. Three regions can be distin-guished in this figure: (I) only anodophilic microorganisms; (II) coexistence, and; (III) only methanogenic microorganisms (i.e., anaerobic reactor). Calculation with zero decay rate constants
produced qualitatively the same results, supporting the hypoth-esis that decay rates can be neglected.
The results presented in Figure 2 were qualitatively confirmed in other experimental work, when low methane production and stable power output were observed in an MFCs operated at an
Rextset close to the MFCs’ Rint.17,18
3.3. Variation of Substrate Consumption with External Load and Effluent Concentration. The coexistence depends
on the difference between the growth rates of the methanogenic and the anodophilic populations, whereas the treatment capacity depends on the substrate consumption of these microorganisms. From eq 1, it can be seen that the consumption rate depends upon the desired effluent substrate concentration and the concentration of each microbial population. As seen in the previous section, the latter is determined by the external resistance (electric load). So, the effect of external load and effluent concentration on the consumption rate is studied here.
Proposition 2. If (qmax,aµmax,m)/(qmax,mµmax,a) e 1, then coexist-ence always leads to lower substrate consumption.
Proof. This result can be proved by comparing the substrate
consumption rates (r) for each region. For a given S, rm ) constant and ra is maximized when Mox ) Mtotal, i.e., at low
Rext:
For the coexistence region, the substrate consumption rate (rc) is
The coexistence only occurs when A ) B ) 0; then eq 11 is valid. Substituting the same gives
By definition, κ ) (qmax,aµmax,m)/(qmax,mµmax,a) e 1, and because λ ) xa/Xmax, it varies between 0 and 1; therefore, eq 17 is always <1. Thus, if κ < 1, then rmax,ce rmax,m.
Figure 1. Regions of coexistence and single population existence. Region
I with values ofµ* < 1 represents only anodophilic microorganisms, whereas region II with 1 <µ* < 4 represents coexistence and region III with µ* > 4 represents only methanogenic microorganisms.
[
d∆xa/ dt d∆xm/ dt]
)[
-2R(1 - R)K xDxa -2R(1 - R)KxDxa 0 (Um-U a)][
∆xa ∆xm]
(10) µmax,a S KS,a+S Mox KM+M ox )µ max,m S KS,m+S ) RD (11) S ) KS,m -K S,aµ* µ* - 1 , whereµ* ) µmax ,m µmax ,a KM+M ox Mox (12)Figure 2. Predicted concentration of anodophilic and methanogenic
populations as a function of Rext.
rmax,a)q max,a S KS,a+S Mtotal KM+M total Xmax (13) rmax,m)q max,m S KS,m+SXmax (14) rmax,c)q max,a S KS,a+S Mox KM+M ox xa+ qmax,m S KS,m+S(Xmax-xa) (15)
rmax,c)
[
qmax,aµmax,mqmax,mµmax,a xa Xmax +
(
1 -xa Xmax)
]
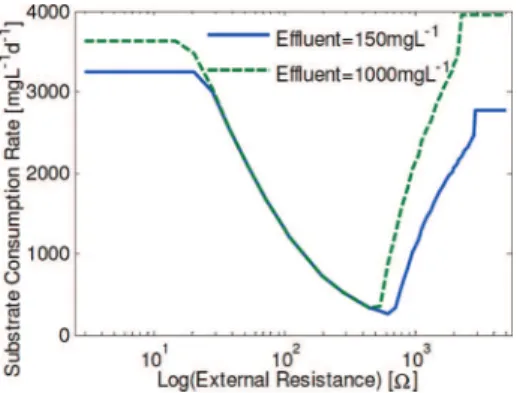
qmax,m S KS,m+SXmax (16) rmax,c rmax,m )[1 + (κ - 1)λ] (17)This proposition can be illustrated by the following example presented in Figure 3, where the influence of external resistance on the substrate consumption rate is shown. For this example, two constant effluent substrate concentrations (low and high) were selected. At low effluent substrate concentrations, an MFC with small external resistance (anodophils only) consumes the most organic matter, whereas for high concentrations, the best cleaning performance is reached at high resistance (methanogens only). Figure 3 also shows that the coexistence always leads to poorer substrate consumption.
To analyze this aspect further, the influence of the consump-tion rate on the effluent substrate concentraconsump-tion (S) is presented in Figure 4. Three values of Rextare chosen that correspond to (I) only anodophils, (II) coexistence, and (III) only methanogens. The influent concentration was varied from 150 to 2500 mg L-1. It can be seen that the methanogens perform better for higher substrate concentrations whereas the anodophils do better at lower concentrations. As confirmed in Proposition 2, the coexistence always results in a decreased substrate consumption rate.
The intersection point of the two curves in Figure 4 can be expressed as follows:
If xm)xa)Xmaxand Mox)Mtotal, for the given set of model parameters Sj can be computed as 354 mg L-1. So, for S < Sj, the anodophils have a higher substrate consumption rate than methanogens and vice versa. As Rextincreases, Mox decreases and the value of Sj increases. Furthermore, the lower the Rext, the larger is the substrate consumption rate for anodophils.
4. Optimization of Substrate Consumption by Staging 4.1. Staging. It is well known that, when the substrate
consumption is described by Monod kinetics, the reaction proceeds more rapidly in a plug-flow reactor than in a continu-ous stirred tank reactor (CSTR).19,20 This means that more substrate can be consumed in the plug-flow reactor rather than using a CSTR. In the case of MFCs, where the continuous mode is used, it is recommended to use reactors-in-series to approach the results of plug-flow operation,19 with the first stages converting the substrate at high rates and the final stages polishing the effluent to a specific requirement demand, a technique often called staging.21First, it is shown mathemati-cally that if two MFC reactors are present, staging would always lead to better performance than running the reactors in parallel.
Proposition 3. Given a fixed influent concentration and
effluent concentration, operating two MFCs in series leads to a higher performance than operating them in parallel.
Proof. Consider the two MFCs to have only methanogens
(anaerobic reactor) and have the same volume. This analysis would be similar for MFCs with anodophils. Let Sfbe the MFC specified effluent concentration. The flow rate of the parallel configuration (FP) at steady state is given by
For the MFCs in series, let Smidbe the effluent concentration of the first and the influent concentration of the second. Then, the flow rate (FS) is given by
The above equation can be solved to give
For the series configuration to be better than the parallel one,
FS> FP:
So, the proposition can be proved if it can be shown that
Moving Sf(Sf +S0)/2(KS,m + 2Sf) to the right-hand side, removing the denominators, and rearranging gives
Equation 24 can be further simplified to
Figure 3. Steady-state substrate consumption rate for MFC operated at low
(150 mg L-1) and high (1200 mg L-1) effluent concentrations.
Figure 4. Steady-state substrate consumption rate for MFC colonized by
either anodophils (Rext)10Ω), both populations (Rext) 1000Ω), or methanogens (Rext)5000Ω). Sj )KS,m-KS,aqj q j -1 , where qj ) qmax,m qmax,a KM+M ox Mox xm xa (18) FP) 2V (S0-Sf)qmax,m Sf KS,m+SfXmax (19) FS) V (Smid-S f) qmax,m Sf KS,m+S f Xmax) V (S0-S mid) qmax,m Smid KS,m+S mid Xmax (20) Smid) Sf(Sf +S 0) +
√
Sf 2(S f+S0) 2+4S 0KS,mSf(KS,m+2Sf) 2(KS,m+2Sf) (21) 1 (Smid-Sf)> 2 (S0-Sf), i.e., Smid< (S0+Sf) 2 (22) Sf(Sf+S 0) +√
Sf 2 (Sf+S 0) 2+ 4S0KS,mSf(KS,m+2S f) 2(KS,m+2S f) < (S0+S f) 2 (23) Sf 2 (Sf+S 0) 2+ 4S0KS,mSf(KS,m +2Sf) < (S0+Sf) 2 (KS,m+S f) 2 (24) 4S0Sf< (S0+Sf)2 (25)which is obviously true since (Sf-S0)2> 0. Therefore, Smid < (Sf+S0)/2 and so, FS> FP.
Staging performance will change if the growth kinetics is described by the Monod-Haldane equation,22which includes microorganism inhibition at higher substrate concentrations. In this paper, Monod-Haldane kinetics were not considered for MFCs for two reasons: first, previous experiments have shown that anodophilic microorganisms exhibit Monod-like kinet-ics;11,23,24and second, because wastewater treatment’s substrate concentrations are usually low, and at these concentrations, inhibition does not affect the growth kinetics.22
4.2. Optimizing a Two-Stage Process. The optimization
problem addressed is the following: Given (i) two MFCs of prefixed volume; (ii) a fixed influent concentration; and (iii) a constraint on the effluent concentration, choose (i) the intercon-nection structure between the MFCs and (ii) the external resistance of each MFC in order to maximize the MFC treatment capacity (as flow rate).
From a substrate consumption point of view, the choice of external resistance can be considered binary. This is in fact justified by proposition 2, where the coexistence always leads to lower substrate consumption rates. For operation with methanogens, which necessitates high external resistance, Rext ) 5000 Ω was selected. It should be emphasized that MFC operation at high external resistance essentially converts an MFC into an anaerobic reactor. For simulations with anodophils, a low external resistance of 10 Ω was chosen. Thus, the interconnection structure and external resistance are binary variables, which in turn lead to the following six interconnection configurations:
1. MP: Two MFCs with high external resistance in parallel (methanogens);
2. AP: Two MFCs with low external resistance in parallel (anodophils);
3. MM: Two MFCs in series, both with high external resistance (methanogens);
4. MA: Two MFCs in series, the first with high external resistance followed by the second with low external resistance (methanogens and anodophils);
5. AM: Two MFCs in series, the first with low external resistance followed by the second with high external resistance (anodophils and methanogens);
6. AA: Two MFCs in series, both with low external resistance (anodophils).
Thus, the optimization problem is purely a combinatorial one. So, the flow rates for all six configurations would be evaluated and the best is selected. The configurations MA and AM can be considered as cogeneration systems because electricity and methane are produced in the same configuration. Furthermore, the results presented in this section do not take into account the price of electricity and methane, which could affect the choice of reactor configuration.
Here it is shown mathematically which configuration is the best for each case.
Proposition 4. Let S0> Sf, q* ) (qmax,m/qmax,a)[(KM+Mtotal)/
Mtotal], S* ) (KS,m-KS,aq*)/(q* - 1) and Sˆ ) [S*(S*KS,a+ 2S*Sf-Sf2)]/[Sf(KS,a+S*)].
If Sf> S*, then the configuration MM will have the largest treatment capacity.
If Sf< S* and S0> Sˆ, then the configuration MA will have the largest treatment capacity.
If Sf< S* and S0< Sˆ, then the configuration AA will have the largest treatment capacity.
Proof. Assume that the oxidized mediator is at the maximum
level (Mox ) Mtotal) for all reactors with anodophils. The treatment capacity for each configuration can be written as
From the definition of S* and q*, one can find that (qmax,aMtotal)/(KM+Mtotal) ) qmax,m(KS,a+S*)/(KS,m+S*); then each of eqs 26-29 can be arranged such that
where Smid is the intermediate concentration between the first and second MFC, KS1is the half-saturation constant of the first MFC, and KS2is the half-saturation constant of the second MFC.
From eq 30, it can be seen that
Note that all concentrations and half-saturation constants are positive, i.e., KS1> 0, KS2> 0, S0> 0, Smid> 0, and Sf> 0. From eq 31, it can be seen that (Smid-Sf)/(S0-Smid) > 0. Therefore, it can be deduced that sign(Smid-Sf) ) sign(S0-Smid). Since the sign is not changed by the addition of two quantities of the same sign, sign(Smid - Sf + S0 - Smid) ) sign(S0 - Sf) ) sign(Smid-Sf) ) sign(S0-Smid). Because of the assumption
S0> Sf, sign(S0-Sf) is positive. Consequently, Smid > Sf and
Smid< S0.
Now, differentiating the first equality of eq 30 with respect to KS1and the second equality with respect to KS2, we obtain
Noting that Sfis a constant, eq 31 can be differentiated with respect to KS1and KS2, yielding
FMM) V (SmidMM-S f) qmax,mSf KS,m+S f Xmax) V (S0-S midMM) qmax,mSmidMM KS,m+S midMM Xmax (26) FMA) V (SmidMA-Sf) qmax,aSf KS,a+Sf Mtotal KM+MtotalXmax) V (S0-S midMA) qmax,mSmidMA KS,m+S midMA Xmax (27) FAM) V (SmidAM-S f) qmax,mSf KS,m+S f Xmax) V (S0-S midAM) qmax,aSmidAM KS,a+S midAM Mtotal KM+M total Xmax (28) FAA) V (SmidAA-Sf) qmax,aSf KS,a+Sf MtotalXmax KM+Mtotal ) V (S0-SmidAA) qmax,aSmidAA KS,a+SmidAA MtotalXmax KM+Mtotal (29) F ) VXmaxqmax,m KS,m+S* Sf (Smid-S f) KS2+S* KS2+S f ) VXmaxqmax,m KS,m +S* Smid (S0-Smid) KS1+S* KS1+Smid (30) Sf)S mid (Smid-S f) (S0-S mid) KS1+S* KS1+S mid KS2+S f KS2+S* (31) ∂F ∂KS1 ) ∂F ∂Smid ∂Smid ∂KS1 ) -F (Smid-Sf) ∂Smid ∂KS1 (32) ∂F ∂K S2 ) ∂F ∂S mid ∂S mid ∂K S2 )F
[
KS,1 Smid(KS,1+S mid) + 1 (S0-S mid)]
∂S mid ∂K S2 (33)Since S0> Smid > Sf, the following can be concluded from eqs 32-35,
Now, three areas of operation can be depicted and the following conclusions can be affirmed:
Consider the case when Sf> S*. Since Smid > Sf, Smid > S*. Under this assumption, ∂F/∂KS1> 0 and ∂F/∂KS2> 0. Therefore, to maximize F, a maximum KS1and KS2must be selected. Then,
KS,m> KS,aleads to an optimum configuration MM.
Consider the case when Sf< S* and Smid > S*. Under this assumption, ∂F/∂KS1> 0 and ∂F/∂KS2< 0. Now, to maximize
F, a maximum KS1and a minimum KS2must be selected. Then,
KS,m> KS,aleads to an optimum configuration MA.
Consider the case when Sf< S* and Smid < S*. Under this assumption, ∂F/∂KS1< 0 and ∂F/∂KS2< 0. To maximize F, a minimum KS1 and KS2must be selected. Then, the optimum configuration is indeed AA.
The condition Smid < S* can be represented in terms of S0 instead of Smid. For this, eq 31 is rearranged to obtain
When Smid)S*,
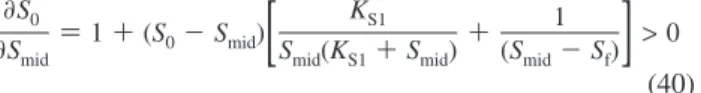
Also, the ∂S0/∂Smid> 0 as seen below:
So, the inequality Smid< S* can be written in terms of S0as
The inequality Smid< S* is valid only when Sf< S*. However, when Sf< S*, ∂F/∂KS2< 0, which leads to the second MFC always containing anodophilic microorganisms. So, using KS2 )KS,agives S0< Sˆ.
The next step was to compare the six different configurations with model simulations. All calculations were done at steady state using the model presented in section 2. Figure 5A shows the dependence of flow at steady state on the effluent substrate concentration for S0)1000 mg L
-1. The operation of reactors in parallel can be analyzed with this figure. As expected, the treatment capacity was larger for an MFC occupied by anodo-phils when substrate effluent concentration was low. When the treatment requirements were less strict, an MFC with metha-nogens presented a larger treatment capacity. For the two MFCs in parallel, with a specific substrate effluent concentration, the maximum treatment capacity could be found simply by multi-plying the treated flow by the number of MFCs in parallel.
The treatment capacity of MFCs operating in series was also graphically computed. For this, another curve that links the substrate influent concentration with the flow for a given fixed effluent concentration is required. This curve is represented in Figure 5B. When parts A and B of Figure 5 are plotted in the same figure, the crossing points represent the treatment capacity of each configuration in series (MM, MA, AM, or AA).
The treatment capacity for all configurations analyzed above was computed for several influent and effluent concentrations. These results are summarized in Figure 6, where the design that presents the largest treatment capacity is indicated in each region.
As shown in proposition 4, the configuration in series with the first MFC operating as an methanogenic reactor and the second MFC in anodophilic mode represents the best treatment capacity for most of the wastewater treatment operating regions (Sf< S* and Smid> S*). This configuration has the methanogens consuming substrate at large substrate concentrations and anodophils polishing the effluent concentration to a specific requirement. When the effluent requirements are less strict (Sf> S*), the configuration with two methanogenic MFCs in series is the best. For low concentra-tions of influent (Sf< S* and Smid< S*), two anodophilic MFCs in series present the best results. As expected from the development
Figure 5. MFCs’ treatment capacity at steady state for diverse treatment requirements. (A) Treatment capacity of the two MFCs connected in parallel and
operated at an influent concentration of 1000 mg L-1. (B) Treatment capacity of the second MFC of the two MFCs connected in series at an effluent concentration was kept at 150 mg L-1. The treatment capacity of the first MFC in series is the same as in panel (A).
∂Smid ∂K S1 ) (S* - Smid) (KS1+S*)(KS1+Smid) KS1 Smid(KS1+S mid) + 1 (S0-S mid) + 1 (Smid-S f) (34) ∂Smid ∂KS2 ) (Sf-S*) (KS2+Sf)(KS2+S*) KS1 Smid(KS1+Smid) + 1 (S0-Smid) + 1 (Smid-Sf) (35) sign
(
∂F ∂K S1)
) -sign(
∂Smid ∂K S1)
)sign(Smid-S*) (36) sign(
∂F ∂K S2)
)sign(
∂Smid ∂K S2)
)sign(S f-S*) (37) S0)S mid[
1 + (Smid-S f) Sf KS1+S* KS1+S mid KS2+S f KS2+S*]
(38) S0)S*(S*KS2 +2S*S f-Sf 2 ) Sf(KS2+S*) (39) ∂S0 ∂S mid )1 + (S 0-Smid)[
KS1 Smid(KS1+Smid) + 1 (Smid-S f)]
> 0 (40) S0< S*(S*KS2 +2S*Sf-Sf2) Sf(KS2+S*) (41)made in proposition 4, the boundary between configuration MM and MA occurs when the effluent is S*. In addition, the curve that describes Smid)S* represents the frontier between regions AA and MA in Figure 6.
An additional challenge for the electricity production design is the control of Rext. While the selection of a low Rextenhances anodophilic concentration, an Rext smaller than the MFCs’ internal resistance (Rint) strongly decreases the power output. The best choice for such design would be matching Rext with
Rint.25 This problem has been addressed for an MFC before, using MPPT (maximum power point tracking) techniques to select the optimum external resistance.26,27
As mentioned above, an MFC that only contains methanogens operates as an anaerobic reactor. In this case, all the extra material involved in building an MFC can be excluded (anode, cathode, external load, etc.). However, the flexibility offered by an MFC presents a great advantage for moving from one population to another, simply by adjusting the external load. Yet the slow dynamics of microorganism’s growth presents a restriction, such that it takes time to switch between populations. However, this same limitation may also minimize the effect of populations elimination, i.e., even at extreme values of Rext, both
populations may coexist for an extremely long time, with one of them at very low concentrations.
5. Conclusions
This paper presents analysis of a two-population MFC model. The model predicts the concentration of anodophilic and metha-nogenic microorganisms and shows that MFC external resistance (electric load) and organic load affect steady-state distribution of microbial populations. Steady-state analysis of the model shows three possible scenarios of microorganism distribution: (I) only anodophilic microorganisms; (II) coexistence; and (III) only methanogenic microorganisms. Furthermore, methanogens have higher substrate consumption rates at higher substrate effluent concentrations than the anodophils, whereas the reverse occurs at lower substrate concentrations. The coexistence scenario always leads to lower substrate consumption rates.
In addition, MFC staging was proven to always present better treatment capacity than parallel MFCs. Diverse designs for a staging unit with two MFCs were simulated to compare the maximum organic load treating capacity. The best design is a function of the dominant microbial population in each MFC, selected according to its external load. Regions with the best design were drawn as a function of influent and effluent concentrations. For the largest and most common region of operation, two MFCs in series, the first with high external resistance followed by a second with low external resistance, presented the best results.
Acknowledgment
This research was supported by the National Research Council of Canada (NRC article #53128).
Appendix
A detailed description of the model and the experimental results can be found in ref 14. The model takes into account the competition for acetate between anodophilic and methanogenic microorganisms. Charge transfer at the anode is modeled using an intracellular mediator. The reactions at the anode are as follows:
S + Moxf Mred+CO2
Table 1. Model Parameters
parameter value dimension description confidence interval [%]
F 96 485 A s mole-1 Faraday constant b
R 8.314 472 J K-1mol-1 ideal gas constant b
T 298.15 K MFC temperature b Ya 22.75 mg MmgS -1 yield in eq 4 0.91 YCH4 0.3 mLCH4mgS -1 methane yield b qmax,aa 8.48 mgSmgx
-1days-1 maximum anodophilic reaction rate 0.11
qmax,ma 8.20 mgSmgx
-1days-1 maximum methanogenic reaction rate 3.75 µmax,aa 1.97 days
-1 maximum anodophilic growth rate 3.01 µmax,ma 0.1 days-1 maximum methanogenic growth rate 3.4
KS,a 20 mgSL
-1 half-rate constant of anodophils b
KS,m 80 mgSL
-1 half-rate constant of methanogens b
M 2 mole-mol
mediator
-1 electrons transferred per mol of mediator b γ 663 400 mgMmolmediator-1 mediator molar mass b
Mtotal 0.05 mgMmgx
-1 mediator fraction b
KM 0.01 mgML
-1 mediator half-rate constant b
Kd,a 0.04 days
-1 decay rate of anodophilic microorganisms b
Kd,m 0.002 days-1 decay rate of methanogenic microorganisms b
Xmax 525 mgxL
-1 maximal attainable biomass concentration b
Kx 0.4 L mgx
-1 parameter in eq 5 b
Rmin 25 Ω minimum internal resistance b
Rmax 2025 Ω maximum internal resistance b
Emin 0.01 V minimum EOCV b
Emax 0.674 V maximum EOCV b
KR 0.024 L mgx
-1 parameter in eqs 7 and 8 b
aParameter estimated by Pinto et al.14 bPhysical constants or parameters that were experimentally measured or assumed by Pinto et al.14
Figure 6. Regions with the largest treatment capacity. Area denoted by
N/A represents a section where the effluent is larger or the same as the influent (unfeasible region). Notations: MM, two MFCs in series, both with high external resistance (methanogens); MA, two MFCs in series, the first with high external resistance followed by the second with low external resistance (methanogens and anodophils); and AA, two MFCs in series, both with low external resistance (anodophils).
Mredf Mox+e
-S f CH4+CO2
where S is the carbon source. Mredand Moxare the reduced and oxidized forms of the intracellular mediator, respectively. In addition, the following assumptions were made to achieve a fast numerical solution of the model:
(1) The carbon source is well distributed in the anodic compartment; therefore, ideal mixing is assumed and substrate gradient in the biofilm is neglected.
(2) Uniform distribution of microbial populations in the anodic compartment biofilm is assumed and biomass retention due to biofilm formation is described by a two-phase growth-washout model described below.
(3) Gas transport (e.g., oxygen, methane) through the porous cathode is neglected.
(4) Multiplicative Monod kinetics is used to describe growth kinetics of anodophilic microorganisms.
(5) A constant pool of intracellular electron transfer mediator in a microorganism is assumed.
(6) Temperature and pH are considered fully controlled and kept constant.
A constant pool of intracellular electron transfer mediator in a microorganism is assumed:
Mox+M
redf Mtotal
Biofilm formation and retention was simulated using a two-phase biofilm growth model. This method avoided a model structure with partial differential equations. It was assumed that, during the biofilm growth phase, no washout occurred, so a batch reactor balance was used. During the stationary phase, an equilibrium between biofilm growth and washout was assumed to be reached when biofilm approached its steady-state thickness.28,29 Therefore, biofilm washout was equal to net biofilm growth, i.e., a CSTR reactor balance was used. This two-phase biofilm model is described by CSTR material balances with a biomass retention parameter R.29
The parameters of the model were either estimated using experimental results obtained in a 50 mL (anodic chamber volume) MFC or chosen from values reported in the literature. As in ref 30, decay rates were considered to be constant and equal to a small percentage (2%) of the maximum growth rates. Parameter descrip-tion, units, and values are provided in Table 1. The model was validated with two independent MFC data sets.
Literature Cited
(1) Rozendal, R. A.; Hamelers, H. V. M.; Rabaey, K.; Keller, J.; Buisman, C. J. N. Towards practical implementation of bioelectrochemical wastewater treatment. Trends Biotechnol. 2008, 26 (8), 450–459.
(2) Lovley, D. R. The microbe electric: Conversion of organic matter to electricity. Curr. Opin. Biotechnol. 2008, 19 (6), 564–571.
(3) Logan, B. E.; Hamelers, B.; Rozendal, R.; Schroder, U.; Keller, J.; Freguia, S.; Aelterman, P.; Verstraete, W.; Rabaey, K. Microbial fuel cells: Methodology and technology. EnViron. Sci. Technol. 2006, 40 (17), 5181– 5192.
(4) Logan, B. E.; Regan, J. M. Microbial fuel cellssChallenges and applications. EnViron. Sci. Technol. 2006, 40 (17), 5172–5180.
(5) Debabov, V. Electricity from microorganisms. Microbiology 2008,
77(2), 123–131.
(6) Pham, T. H.; Rabaey, K.; Aelterman, P.; Clauwaert, P.; De Schamphelaire, L.; Boon, N.; Verstraete, W. Microbial fuel cells in relation to conventional anaerobic digestion technology. Eng. Life Sci. 2006, 6 (3), 285–292.
(7) Logan, B. E.; Regan, J. M. Electricity-producing bacterial com-munities in microbial fuel cells. Trends Microbiol. 2006, 14, 512–518.
(8) Arcand, Y.; Chavarie, C.; Guiot, S. Dynamic modelling of the population distribution in the anaerobic granular biofilm. Water Sci. Technol.
1994, 30, 63–73.
(9) Moletta, R.; Verrier, D.; Albagnac, G. Dynamic modeling of anaerobic digestion. Water Res. 1986, 20, 427–434.
(10) Quarmby, J.; Forster, C. F. An examination of the structure of UASB granules. Water Res. 1995, 29, 2449–2454.
(11) Torres, C. I.; Marcus, A. K.; Parameswaran, P.; Rittmann, B. E. Kinetic experiments for evaluating the Nernst-Monod model for anode-respiring bacteria (ARB) in a biofilm anode. EnViron. Sci. Technol. 2008,
42(17), 6593–6597.
(12) Esteve-Nu´n˜ez, A.; Rothermich, M.; Sharma, M.; Lovley, D. Growth of Geobacter sulfurreducens under nutrient-limiting conditions in continuous culture. EnViron. Microbiol. 2005, 7 (5), 641–648.
(13) Picioreanu, C.; Head, I. M.; Katuri, K. P.; van Loosdrecht, M. C. M.; Scott, K. A computational model for biofilm-based microbial fuel cells.
Water Res. 2007, 41 (13), 2921–2940.
(14) Pinto, R. P.; Srinivasan, B.; Manuel, M.-F.; Tartakovsky, B. A Two-Population Bio-Electrochemical Model of a Microbial Fuel Cell. Bioresour.
Technol. 2010, 101 (14), 5256–5265.
(15) Harmand, J.; Rapaport, A.; Dochain, D.; Lobry, C. Microbial ecology and bioprocess control: Opportunities and challenges. J. Process
Control 2008, 18 (9), 865–75.
(16) Hardin, G. The Competitive Exclusion Principle. Science 1960, 131, 1292–1297.
(17) Aelterman, P.; Versichele, M.; Marzorati, M.; Boon, N.; Verstraete, W. Loading rate and external resistance control the electricity generation of microbial fuel cells with different three-dimensional anodes. Bioresour.
Technol. 2008, 99 (18), 8895–8902.
(18) Chae, K.-J.; Choi, M.-J.; Kim, K.-Y.; Ajayi, F. F.; Park, W.; Kim, C.-W.; Kim, I. S. Methanogenesis control by employing various environ-mental stress conditions in two-chambered microbial fuel cells. Bioresour.
Technol. 2010, 101 (14), 5350–5357.
(19) Shuler, M. L.; Kargi, F. Bioprocess Engineering; Prentice-Hall: Upper Saddle River, NJ, 1992.
(20) Eddy, M. Wastewater Engineering: Treatment and Reuse, 4th ed.; McGraw-Hill Science/Engineering/Math: New York, 2002.
(21) Van Lier, J. B.; Van Der Zee, F. P.; Tan, N. C. G.; Rebac, S.; Kleerebezem, R. Advances in high-rate anaerobic treatment: Staging of reactor systems. Water Sci. Technol. 2001, 44, 15–25.
(22) Andrews, J. F. A mathematical model for the continuous culture of microorganisms utilizing inhibitory substrates. Biotechnol. Bioeng. 1968,
10(6), 707–723.
(23) Marcus, A. K.; Torres, C. I.; Rittmann, B. E. Conduction-based modeling of the biofilm anode of a microbial fuel cell. Biotechnol. Bioeng.
2007, 98 (6), 1171–1182.
(24) Cheng, K. Y.; Ho, G.; Cord-Ruwisch, R. Affinity of Microbial Fuel Cell Biofilm for the Anodic Potential. EnViron. Sci. Technol. 2008, 42 (10), 3828–3834.
(25) Logan, B. E. Microbial Fuel Cells, 1st ed.; John Wiley & Sons: Hobeken, NJ, 2008.
(26) Woodward, L.; Perrier, M.; Srinivasan, B.; Tartakovsky, B. Maximizing power production in a stack of microbial fuel cells using multiunit optimization method. Biotechnol. Prog. 2009, 25 (3), 676–682. (27) Woodward, L.; Pinto, R. P.; Tartakovsky, B.; Perrier, M.; Srini-vasan, B. Comparison of Real-Time Optimization Methods For Maximum Power Point Tracking of Microbial Full Cells. AIChE J. 2010, Published Online.
(28) Wanner, O.; Gujer, W. Multispecies Biofilm Model. Biotechnol.
Bioeng. 1986, 28 (3), 314–328.
(29) Tartakovsky, B.; Mu, S. J.; Zeng, Y.; Lou, S. J.; Guiot, S. R.; Wu, P. Anaerobic digestion model No. 1-based distributed parameter model of an anaerobic reactor. II. Model validation. Bioresour. Technol. 2008, 99 (9), 3676–3684.
(30) Batstone, D. J.; Keller, J.; Angelidaki, I.; Kalyuzhnyi, S. V.; Pavlostathis, S. G.; Rozzi, A.; Sanders, W. T. M.; Siegrist, H.; Vavilin, V. A. The IWA Anaerobic Digestion Model No. 1 (ADM1). Water Sci.
Technol. 2002, 45 (10), 65–73.
ReceiVed for reViewMarch 4, 2010
ReVised manuscript receiVedJuly 13, 2010
AcceptedAugust 5, 2010 IE1004898