HAL Id: hal-01949179
https://hal.umontpellier.fr/hal-01949179
Submitted on 16 Nov 2020HAL is a multi-disciplinary open access archive for the deposit and dissemination of sci-entific research documents, whether they are pub-lished or not. The documents may come from teaching and research institutions in France or abroad, or from public or private research centers.
L’archive ouverte pluridisciplinaire HAL, est destinée au dépôt et à la diffusion de documents scientifiques de niveau recherche, publiés ou non, émanant des établissements d’enseignement et de recherche français ou étrangers, des laboratoires publics ou privés.
The interplay between facilitation and habitat type
drives spatial vegetation patterns in global drylands
Miguel Berdugo, Santiago Soliveres, Sonia Kéfi, Fernando Maestre
To cite this version:
Miguel Berdugo, Santiago Soliveres, Sonia Kéfi, Fernando Maestre. The interplay between facilitation and habitat type drives spatial vegetation patterns in global drylands. Ecography, Wiley, 2018, 42 (4), pp.755-767. �10.1111/ecog.03795�. �hal-01949179�
ECOGRAPHY
Ecography
–––––––––––––––––––––––––––––––––––––––– Subject Editor: Thorsten Wiegand
Editor-in-Chief: Miguel Araújo Accepted 17 September 2018
42: 755–767, 2019
doi: 10.1111/ecog.03795
doi: 10.1111/ecog.03795 42 755–767
The spatial configuration of vascular vegetation has been linked to variations in land degradation and ecosystem functioning in drylands. However, most studies on spatial patterns conducted to date have focused on a single or a few study sites within a particular region, specific vegetation types, or in landscapes characterized by a certain type of spatial patterns. Therefore, little is known on the general typology and distribution of plant spatial patterns in drylands worldwide, and on the relative importance of biotic and abiotic factors as predictors of their variations across geographical regions and habitat types. We analyzed 115 dryland plant communities from all continents except Antarctica to: 1) investigate the general typology of spatial patterns, and 2) assess the relative importance of biotic (plant cover, frequency of facilitation, soil amelioration, height of the dominant species) and abiotic (aridity, rainfall seasonality and sand content) factors as predictors of spatial patterns (median patch size, shape of patch-size distribution and regularity) across contrasting habitat types (shrublands and grasslands). Precipitation during the warmest period and sand content were particularly strong predictors of plant spatial patterns in grasslands and shrublands, respectively. Facilitation associated with power-law like and irregular spatial patterns in both shrublands and grasslands, although it was mediated by different mechanisms (respectively soil ammelioration and percentage of facilitated species). The importance of biotic attributes as predictors of the shape of patch-size distributions declined with aridity in both habitats, leading to the emergence of more regular patterns under the most arid conditions. Our results expand our knowledge about patch formation in drylands and the habitat-dependency of their drivers. They also highlight different ways in which facilitation affects ecosystem structure through the formation of plant spatial patterns.
Keywords: patch-size distributions, aridity, regular spatial patterns
Introduction
Vegetation in arid, semi-arid and dry-subhumid ecosystems (drylands, hereafter) is usually arranged in a two-phase mosaic formed by plant patches interspersed in a matrix of open areas with less dense perennial vascular vegetation (Tongway et al. 2001). These patches usually do not follow a random configuration but exhibit
The interplay between facilitation and habitat type drives spatial
vegetation patterns in global drylands
Miguel Berdugo, Santiago Soliveres, Sonia Kéfi and Fernando T. Maestre
M. Berdugo (http://orcid.org/0000-0003-1053-8907) ([email protected]) and F. T. Maestre, Depto de Biología y Geología, Física y Química Inorgánica, Escuela Superior de Ciencias Experimentales y Tecnología, Univ. Rey Juan Carlos, Móstoles, Spain. – S. Soliveres, Depto de Ecología, Univ. de Alicante, Alicante, Spain. – S. Kéfi, ISEM, CNRS, Univ. de Montpellier, IRD, EPHE, Montpellier, France.
different spatial patterns, which largely influence ecosystem structure and functioning. For instance, the spatial patterns of vegetation largely affects soil nutrient redistribution and soil erosion (Aguiar and Sala 1999, Mayor et al. 2013), and certain configurations have been linked to changes in ecosys-tem functioning and in the degradation status of ecosysecosys-tems (Kéfi et al. 2007a, Berdugo et al. 2017).
When studying vegetation patterns, two main features are of interest: the spatial arrangement and the size distribution of plant patches. According to the spatial arrangement of plant patches two major types of vegetation patterns have been described: irregular and regular patterns. Regular patterns are formed by similar-sized plant patches with approximately equidistant neighbors, following a characteristic structure that repeats itself throughout the landscape. Irregular pat-terns, instead, are those in which patches intersperse hetero-geneously in the landscape, usually exhibiting very contrasted sizes (Klausmeier 1999). Mathematical models suggest that regular patterns arise when facilitative interactions occur at scales fundamentaly different than those of competition between plants (Lejeune et al. 1999, Peter and Elke 2005, Barbier et al. 2008). Additionaly, regular patterns are formed by water redistribution and the spatial extent of root systems of plants (Deblauwe et al. 2008, von Hardenberg et al. 2010), suggesting that abiotic and biotic factors are likely to interact in determining whether plant spatial patterns are regular or not. However, these interactions have been seldom studied in the field.
In addition to the spatial distribution of plant patches, the frequency of their size classes (patch-size distributions, referred to as PSD hereafter), provides a tool to analyze the patchy structure of vegetation typical of dryland eco-systems (Moreno de las Heras et al. 2011, Berdugo et al. 2017). Mathematical models and some field studies sug-gest that PSDs of dryland vegetation follow power law functions (i.e. there are many small patches and a few very large ones Kéfi et al. 2007a, Scanlon et al. 2007), and that increasing environmental harshness (e.g. higher aridity or grazing pressure) reduces the number of large patches (Kéfi et al. 2007a, Lin et al. 2010, Berdugo et al. 2017). As with regularity, not only abiotic factors, but also plant–plant interactions are important in determining patch-size distributions. Facilitative interactions promote the formation of large patches that underpin the creation of power-law PSDs (Kéfi et al. 2007a, Scanlon et al. 2007, Xu et al. 2015, Berdugo et al. 2017). Facilitative mecha-nisms that can increase the size of plant patches include improvements in soil and microclimatic conditions beneath nurses (the later allowing protegeé plants to thrive under environments to which they are poorly adapted, Maestre et al. 2003, Liancourt et al. 2017, Berdugo et al. 2018a). These facilitation mechanisms (soil vs microcli-mate) have different implications and could modulate how plant spatial patterns affect functioning in different ways, yet their effects have not been evaluated separately. Soil amelioration enhances functioning directly, for instance
by extending the period in which soil microbes are active (which enhances the rates of nutrient cycling, Throop and Archer 2009) and depends on the attributes of the nurses (Pugnaire et al. 1996, Maestre et al. 2001) and the envi-ronmental conditions in which they live (e.g. largest effects found on sandy soils; Ochoa-Hueso et al. 2018). However, microclimatic amelioration acts through the existing community (depending on the necessity of other species for this climatic ammelioration) and can improve func-tioning indirectly, via increasing diversity (Tilman et al. 1997, Gross et al. 2017). Thus, disentangling the relative importance of different facilitative mechanisms on spatial pattern formation may inform us about how facilitation affects ecosystem functioning via complementary processes (spatial pattern formation versus direct soil amelioration and increased species richness).
In addition to plant–plant interactions or aridity, vegetation spatial patterns (both size distribution and spa-tial arrangement) are also affected by other variables. For instance, increases in cover might promote mechanical vegetation clumping due to lack of space (creation of span-ning clusters, Abades et al. 2014, Xu et al. 2015), even in the absence of more deterministic processes. Some abiotic variables, such as rainfall seasonality or soil texture, may exacerbate experienced water stress (Sala et al. 1997) and affect infiltration rates thus, influencing spatial patterns (Deblauwe et al. 2008, von Hardenberg et al. 2010). In adi-tion, species specific features may affect spatial pattern forma-tion in different ways. For instance, large species have a major influence on the emergence of PSDs (Maestre and Cortina 2005, Borthagaray et al. 2012). Besides, clonal plants tend to generate regular patterns (Cosby 1960, Sheffer et al. 2007, Cartenì et al. 2012, Bordeu et al. 2016). Indeed, contrast-ing dominant plant types, such as grasses versus shrubs, exhibit different ways of reproduction (e.g. grasses repro-duce more frequently via rhizomatous roots than shrubs) and resource uptake (grasses have generally shallower roots than shrubs). These contrasting traits inherently affect the regularity (Penny et al. 2013) and PSDs of spatial patterns (Goslee et al. 2003, Lett and Knapp 2003, Ravi et al. 2008). Also, grasses and shrubs differentially affect ecohydrological mechanisms such as run-off, erosion or evapotranspiration, with shrubs producing higher differences in water availability with adjacent bare ground areas than grasses (Huxman et al. 2005, Ludwig et al. 2005, Okin et al. 2009). These ecohydro-logical effects can affect the way in which grasses and shrubs interact with other species (Aguiar et al. 1992, Maestre et al. 2003). Therefore, differences across vegetation types (e.g. grassland cf. shrublands) could also influence how some pro-cesses (e.g. plant–plant interactions) affect vegetation pat-terns, although this is poorly understood due to the lack of cross-habitat studies. Increases in aridity are correlated with reduced vegetation cover (Delgado-Baquerizo et al. 2013) and different relative dominance of grasses vs shrubs in drylands (Knapp et al. 2008). Therefore, understanding the interactions between aridity and other drivers of vegetation
patterns is also of paramount importance to better under-stand and forecast how dryland ecosystems may respond to ongoing climate change.
To date, no study has characterized different types of spa-tial patterns, the generality of different size distributions and spatial arrangements, or how these two properties of plant spatial patterns relate to each other in drylands worldwide. Furthermore, empirical evaluations of the abiotic and biotic factors to which each plant spatial pattern is associated are rare, due to the paucity of studies across large gradients of contrasting environmental conditions and across contrasting habitat types. This restricts our ability to forecast changes in vegetation spatial structure in response to climate change. To contribute to filling this gap in our knowledge, we investi-gated several attributes (median of patch sizes, shape of PSDs and regularity) of spatial patterns of perennial vegetation in 115 drylands spanning a wide range of environmental condi-tions, soils and vegetation types. This allowed us to assess: 1) the region and vegetation type dependency of spatial pat-terns in drylands worldwide, 2) the relative importance of aridity and biotic (plant cover, facilitative interactions, soil amelioration, habitat type and plant functional traits) fac-tors as predicfac-tors of spatial pattern attributes, and 3) whether the importance of these predictors change depending on the vegetation type considered (shrublands vs grasslands).
Material and methods
Study sites and data collection
We studied 115 dryland ecosystems from 13 countries (Fig. 1), which are a subset of the 236 sites from Ochoa-Hueso et al. (2018). Annual mean temperature and rainfall ranged from 2.6 to 25.7°C and from 67 to 801 mm, respec-tively. Elevation, latitude and longitude varied from 76 to 4524 m a.s.l., from –41° to 40°, and from –115° to 142°, respectively. The database includes three habitat types (grass-lands, shrublands and open woodlands/savanna); however, we did not use open woodlands/savanna because there were very few sites suitable for our analyses (111 sites remained). Grassland and shrubland sites covered a wide range in spe-cies richness (2 to 39 perennial spespe-cies) and total plant cover (from 4.5 to 82.8%).
At each site, we established a 30 × 30 m plot for our field measurements. We established four 30 × 1.5 m long transects separated 8 m from each other and measured the cover of perennial plants using the line intercept method as detailed in Maestre et al. (2012). Within the 30 × 30 m plot, we also collected five soil samples at 0–5 cm depth under the domi-nant species and in adjacent bare ground areas. These soils were sieved (2 mm mesh), air dried for one month and stored for laboratory analyses. To standardize soil analyses, all soil samples were shipped to Spain, where they were analyzed in the same laboratory. See Maestre et al. (2012) for additional details on the study sites and field surveys/laboratory analyses conducted.
Measurement of different attributes of vegetation patterns
In the 111 sites used, we were able to quantify the spatial pattern attributes using high-resolution remote sensing data. In brief, we downloaded VirtualEarth (< www.bing.com/ maps >) and Google Earth (< https://earth.google.com >) images with resolution ≤ 30 cm/pixel. This resolution is the best that could be found, and is enough to identify most of the vegetation present in our sites (average height ~ 40–50 cm). To obtain a sufficient number of patches to be able to fit reli-able PSDs, we took three adjacent 50 × 50 m areas per site (hereafter subplots). The first subplot was placed to match that location surveyed in the field (which was fitted onto the top left corner of the first 50 × 50 m subplot). We classified the images using an automated luminance threshold detec-tion, and contrasted the results obtained with those from other supervised classification methods (see Supplementary material Appendix 1 and Berdugo et al. 2017 for details). Finally, remote-sensing cover estimates from the first subplot were correlated with field measurements to ensure that the classification procedure reproduced what was observed in the field (Supplementary material Appendix 4 Fig. A1).
From the images, we derived two sets of metrics describ-ing the vegetation patterns. The first set of metrics (median patch-size and shape of PSDs) aimed to describe the main size distribution attributes of plant patches. The second set aimed to understand the spatial arrangement of those plant patches (regular or irregular). These three metrics (median patch size, shape of PSD, and regularity) provide a com-prehensive and complementary description of plant spatial patterns and are easy to interpret and assess in large observa-tional studies such as ours. Also, these metrics outperformed other available metrics such as variance or skewness of patch-sizes as descriptors of plant spatial patterns (Supplementary material Appendix 3).
Meassuring the size distribution of plant patches
To measure the size distribution of plant patches, we focused on two metrics that describe the grain size and the shape of the size distribution. For each site, we extracted all the patches and their sizes resulting from the image classifica-tion analyses of the three 50 × 50 m subplots. The data from all the subplots were pooled to perform the next steps. The grain size of the patches was determined by extracting the median patch size across the three subplots. Median patch size informs about the most common patch size of each image and is an important descriptor of the overall scale of the sys-tem. It is important to note that, in systems where no par-ticular scale is predominant (e.g. those whose PSD better fit to power laws), the characteristic median of patch sizes should be small (as those would be the most dominant patch sizes).
To characterize the shape of PSDs we used inversed cumulative distributions because this method allows us to: 1) summarize the variation of PSDs without selecting a spe-cific data binning, and, 2) allow a more reliable detection of the shape of PSDs (particularly those following power
law functions White et al. 2008). If both the patch sizes and frequencies are log-transformed, the shape of the inversed PSDs may vary from a straight line (power law) to a curved distribution (e.g. lognormal or exponential). To measure the shape of PSDs we fitted a quadratic regression on the log-log transformed versions of the inversed cumulative distributions and extracted the quadratic term (a parameter) of this fitting
(Fig. 2, Schneider and Kéfi 2016, Berdugo et al. 2017). The a parameter informs about the degree of curvature of the regression. When a is negative the curvature is convex, when a is positive it is concave. We use –1 × a in our
mod-els as measure of curvature (which is usually convex). Thus, large values of curvature inform about an uneven rapid loss of large patch sizes. This usually entails the emergence of a
Figure 1. Map of spatial patterns across the studied sites. The colour switch from blue to red according to the curvature of PSDs and the size is proportional to the median patch-size found. Circles indicate irregular patterns, whereas diamonds indicate regular ones. (A) Map of the world; (B) zoom on Noth America area; (C) zoom on Mediterranean area; (D) zoom on South America area.
given predominant scale (von Hardenberg et al. 2010) and is related to the lack of formation of large patch sizes and an overall low variance on the patch sizes (Supplementary mate-rial Appendix 4 Fig. A2). Smaller values of curvature suggest progressive trend towards power law distributions and the smallest (few values that are negative) indicate an upper trun-cation probably related to the existence of abnormally fre-quent large patch sizes (such as those formed when spanning clusters of vegetation are present). Values close to 0 indicate straight declines, which might be better interpreted as power law- like or other scale-invariant distributions.
Meassuring the spatial arrangement of plant patches
To measure the spatial arrangement of plant patches, we used a method called the r-spectrum (Ripley 1981, Mugglestone and Renshaw 1998). The r-spectrum summarizes the results obtained by a periodogram extracted with a fourier analysis applied in 2-D to each image (i.e. the amount of variance that can be absorved by a simple sinusoid function with increasing spatial wavelength over all possible directions in the picture). If the periodogram is averaged radially (i.e. irrespective of the direction), an r-spectrum is generated. Irregular (especially
fractal-like) patterns show a decay in the r-spectrum with increasing wavenumber. Regular patterns, intead, show a peak, or at least a bump, for a range of intermediate wave-numbers (Couteron 2002), pointing to periodic repetition of patch- interpatch structures (Fig. 2 and Supplementary mate-rial Appendix 2). In several cases, peaks at intermediate wave-numbers are preceded by strong decays of the r-spectrum in the smallest wavenumbers; in others, peaks do not appear clearly distinguishable from noise (Supplementary material Appendix 2 Fig. A2). To gain insight into whether regular signals might be occurring in these cases, we divided each subplots in four smaller squared windows and checked their r-spectra (Couteron and Lejeune 2001). We classified sub-plots as regular when either 1) the r-spectra at the subplot level showed clear regular signals, 2) when the r-spectra of the subplots showed a mixture of signals, but r-spectrum of the windows of the subplots clearly exhibited strong peaks in wavenumbers in agreement with those smaller peaks at the subplot level. The spatial pattern of a given site was classified as regular if at least two subplots met any of these criteria. To avoid subjective classification, two of us (MB and SK) implemented the classification independently, finding
Figure 2. Diagram summarizing the methodology used in this study. From classified aerial images of the sites (a) we extracted two types of indices: related to median patch sizes (b1), curvature in the size distribution (b2) as obtained from the a parameter of a quadratic regression on the log-log transformed inversed cummulative distribution, and their spatial arrangement (c). Positive and negative values of the a parameter indicate concave and covex shapes; zero values indicate straight lines. Regularity of spatial patterns was determined using the r-spectrum. If the r-spectrum indicated a strong peak at intermediate wavenumbers or exhibited a power decay, spatial pattern was classified as regular and irregular, respectively. If the r-spectrum indicated a mixture of both we divided the image into four windows and classified as regular those pictures that have at least one window exhibiting regularity in their r-spectra. A given site was considered regular when two or more subplots were so considered.
a match with each other of 92.24%. Then a consensus was made between those classifications. Main results remained consistent on the independent classification and in the consensus (Supplementary material Appendix 4 Fig. A3). Further details on the classification conducted are provided in Supplementary material Appendix 2.
Assessment of biotic and environmental factors
At each site, we measured biotic and environmental attributes known to influence spatial patterns: sand content, percentage of rainfall occurring during the warmest quarter of the year, aridity, plant cover, height of the dominant species, percent-age of facilitated species and soil amelioration (the increase in soil fertility, understood as organic carbon, under plant patches). Further rationale for the selection of these variables is presented in Supplementary material Appendix 3. We mea-sured sand content according to Kettler et al. (2001). The aridity level for each site was calculated as 1 – aridity index (AI), where AI (precipitation/potential evapotranspiration) was obtained from Zomer et al. (2008), which used climatic interpolations provided by Worldclim (Hijmans et al. 2005). To further investigate the effective precipitation due to sea-sonality, we estimated the percentage of rainfall in the warm-est quarter of the year using bioclimatic variables extracted from the Worldclim database (Hijmans et al. 2005). Total perennial cover ranged from 4 to 83% in our study sites. The height of the dominant species was obtained from pre-vious studies, local floras and global databases (Kattge et al. 2011; see Soliveres et al. 2014a, b, Le Bagousse-Pinguet et al. 2017, for more details on trait data acquisition). We intro-duced habitat type (grassland and shrubland) to control for differences in the growth form of the dominant species; these habitat types were identified depending on the dominant plant form inhabiting the sites.
We measured two facets of facilitation in this study. First, we quantified the proportion of species more associated with a given nurse than expected by chance in a subset of 70 sites. To do so, we compared the number of individuals found in open sites vs. those found under nurses and calculated a χ2 value for each pairwise interaction (see Soliveres et al.
2014a, b for full details). Second, we quantified the strength of soil amelioration by nurses, as this may increase the sur-vival and growth of beneficiaries (Pugnaire et al. 2004). We did so by measuring the difference in the organic carbon con-tents obtained in vegetated and bare ground areas (Allington and Valone 2014). Organic carbon (a good indicatior of soil fertility and its water-holding capacity) was measured by colorimetry after oxidation with a mixture of potassium dichromate and sulfuric acid (Anderson and Ingram 1994).
Statistical analyses
Describing the general typology of vegetation patterns
To gain insights in the different spatial vegetation patterns found, we related the metrics extracted (median patch-size, curvature of PSDs and regularity) between them with a
pearson’s correlation coefficient. We also compared the values of those indices using an ANOVA analysis with type of spa-tial pattern (regular and irregular) as a factor. To compare val-ues of metrics among habitat types, ANOVA and chi-squared analyses were used for contiuous metrics and regularity, respectively.
Relating ecological factors to spatial patterns
We first fitted generalized linear models to our three met-rics describing spatial patterns (one model for each, median patch-size, curvature of PSDs and regularity) as a function of both latitude and longitude to assess whether plant spa-tial patterns exhibited any biogeographic trend. We also compared the metrics between different ecozones of the world (as defined by Udvardy and Udvardy 1975) to evalu-ate whether different spatial patterns were relevalu-ated to them. We then used multi-model inference to assess how environ-mental and biotic predictors related to the observed plant spatial patterns. This analytical procedure fits all possible combinations of predictors and ranks the models obtained according to their Akaike information criterion, corrected for small sample size/number of predictors ratio (AICc). Models deviating less than two units of AICc from the best model, i.e. that with the lowest AICc, are not considered dif-ferent from it (Burnham and Anderson 2004). Between the best models selected according to this criterion, a weighted average of standardized effects for each predictor is calcu-lated (Lukacs et al. 2009). We built three models, each using one of our three metrics describing plant spatial patterns as a response variables. For regularity we used generalized lin-ear models with a family of binomial distributions using the function glm in R, and we used the function lm for con-tinuous metrics (median patch-size and curvature of PSDs). As predictors, we used sand content, aridity, percentage of rainfall in the warmest quarter, habitat, cover, height of the dominant species, facilitation and soil amelioration as predictors. We evaluated all possible interactions of biotic attributes with aridity to assess the interplay between abi-otic and biabi-otic predictors of plant spatial patterns. We did not consider other abiotic x biotic interactions as this largely increased the number of predictors to be tested and because these interactions are more likely to be ecologically relevant to help predicting the future structure of dryland ecosystems with ongoing climate change. To know whether different habitats differ on the relative importance of other predictors of shape metrics, we repeated the analysis for grasslands and shrublands separately. We performed all these analyses with those sites for which we had all the information (n = 71), but analyses with the sites that did not include facilita-tion data (n = 111) were consistent with those shown here (Supplementary material Appendix 4 Fig. A4).
We performed multi-model inference analyses with the package MuMIn (Barton 2016) in R (R Development Core Team). Prior to model fitting, we log transformed the response variable to approximate normality of the residuals.
Data deposition
Data available from Figshare Digital Repository: < http://dx.doi. org/10.6084/m9.figshare.5640193 > (Berdugo et al. 2018b).
Results
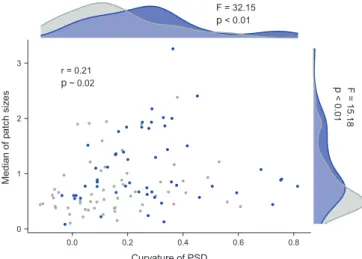
We found a significant proportion of regular patterns (54 out of 115). These were mostly spotted patterns (i.e. isolated round patches), although we also found some labyrintic (i.e. regularly spaced bands) patterns (Supplementary material Appendix 4 Fig. A2). The PSDs found were heavy tailed with varying levels of curvature (Supplementary material Appendix 4 Fig. A2, Fig. A5). Some of our sites exhibited spanning clus-ter formation (one patch had width/length equal to the size of the image) as evidenced by the upper truncation of the PSDs. Our spatial pattern metrics correlated with each other weakly (Fig. 3) so that all possible combinations of values between them could be found (Supplementary material Appendix 4 Fig. A2). However, some of these associations were signifi-cant. In general, regularity was associated with curved PSDs and larger median patch-sizes, and curvature and median were also positively associated. Only regularity was signifi-cantly associated with grasslands (χ2 test = 5.9, p = 0.01),
and the rest of the spatial patterns indicators were similar among habitat types (F1/110= 0.98/1.42 and p = 0.32/0.24 for
median/curvature respectively).
Except for a significant association between the longi-tude and the curvature of PSD, we found no correlation between any of our metrics of plant spatial patterns and
longitude or latitude (Supplementary material Appendix 4 Fig. A6; for regularity, effect sizes of latitude and longitude in a linear model were 0.22 and –0.17 with p values 0.32 and 0.45 respectively), and their values were similar among the ecozones studied (Supplementary material Appendix 4 Fig. A6, for regularity no association was found, χ2= 5.9,
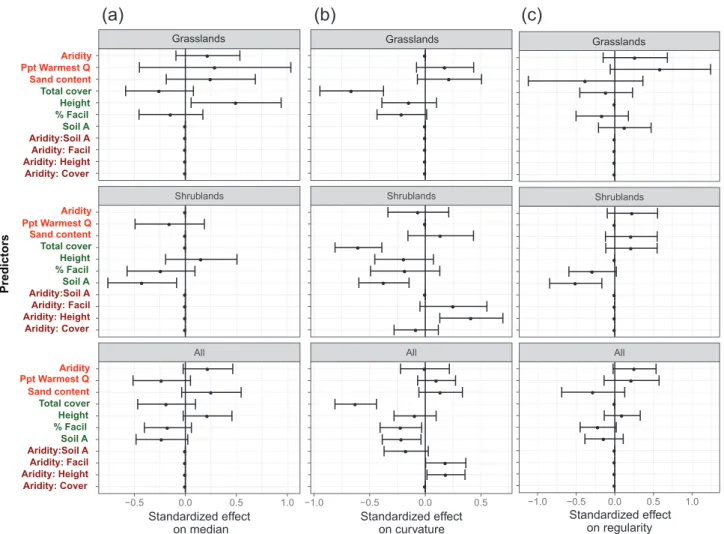
p ~ 0.24). When we analyzed all the habitats together, aridity and sand content were positively related with larger median patch sizes, sand content with curved distributions and aridity increased regularity whereas sand content decreased regularity (Fig. 4). Effective precipitation, instead, was positively related to curvatures of PSD and negatively to the median of the patch-sizes. Increases of both soil amelioration and percent-age of facilitated species were related to less curved distribu-tions, smaller patch-sizes and irregular patterns. Increases in total vegetation cover promoted less curved PSD and smaller median patch sizes. Interactions between aridity and biotic predictors were significant only for PSD curvature. When aridity increased, the relationship between height/facilitation and PSD curvature became more positive, whereas the rela-tionship between soil ammelioration and such curvature became more negative.
Some predictors of spatial patterns showed contrasting effects depending on the habitat type considered (Fig. 4). For instance, all indicators were influenced by percentage of facilitated species and not by soil amelioration in grasslands, whereas the role of soil amelioration was significant for all the indicators in shrublands. Sand content also showed contrasting relationships with spatial pattern depending on the habitat type. It was positively associated to more regu-lar patterns in shrublands, but this association was less clear and negative in grasslands. Conversely, higher sand con-tents related to larger patch sizes in grasslands but not in shrublands. Interactions between aridity and height of the dominant species and total cover were significant predictors of PSD curvature only in shrublands.
Discussion
Typology of spatial patterns
The patch-szie distribution (PSDs) of vegetation in dry-lands normally fit power law functions (Kéfi et al. 2007a, Scanlon et al. 2007, but see Maestre and Escudero 2009) with increases in aridity or other stressors leading to more curved PSDs (Kéfi et al. 2007a). These curved PSDs are asso-ciated with low functional states (Berdugo et al. 2017). Here we show that part of this change in shape is influenced by the emergence of regular patterns which associate with more curved PSDs and larger median patch-sizes under extreme aridity conditions (Fig. 5). Curvature of PSDs found here sometimes entailed an increasing median patch-size (Fig. 3). These PSDs showed a characteristic plateau previous to a strong and curved decay of patch-size frequencies (Supplementary material Appendix 4 Fig. A5). The later suggests that, in these sites, there is not only lack of large patches, but also a
0 1 r = 0.21 p ~ 0.02 2 3 0.0 0.2 0.4 0.6 0.8 Curvature of PSD Median of pa tch si ze s p < 0.01 F = 15.18 F = 32.15 p < 0.01
Figure 3. Relationships between descriptors of plant spatial patterns in drylands studied. Relationships between the curvature of the patch-size distribution and the median of the patch sizes (pearson’s ρ and its associated p-value is displayed inset). Sites with non-regular and non-regular patterns are denoted with grey and blue points, respectively. Kernel distributions indicate the distribution of curva-ture (top) and median (right) for regular (blue) and irregular (grey) patterns. Results of a one-way ANOVA test comparing regular and irregular patterns are shown together to these kernels.
characteristic lack of small ones (but note that the resolution of the images did not allowed us to measure patches smaller than 9 cm2). The loss of both large and small patches is
con-sistent with the emergence of a predominant scale associated with regularity, especially in sites following spotted patterns (Klausmeier 1999, von Hardenberg et al. 2010). In these situations small patches are scarce because nutrients tend to flow from bare areas to sites in which vegetation aggregates, or are taken by the roots that spread lateraly beyond the plant canopies (Lefever and Lejeune 1997, Lejeune et al. 2002). Similarly, large patches are considered dynamically instable due to competitive interactions between plants which tend to divide large patches (Bordeu et al. 2016). Although the emergence of predominant scales is significant in our dataset, it does not explain a large proportion of the variation found (Fig. 3). In this regard, it is important to note that many reg-ular patterns found were only apparent when windowing the subplots studied, which highlights the importance of select-ing relevant sizes of the observation windows in different
situations (e.g. depending on the plant form that is aimed to be studied). Moreover, this suggests that regular and irregular patterns are often mixed in the field (something already sug-gested by Tarnita et al. 2017). This finding calls for future studies on the fact that multi-specific sites in real ecosystems may show both regular and irregular spatial patterns, which is seldom considered but may have important consequences to determine the validity of spatial patterns as tools to monitor ecosystem degradation.
Apart from this general trend, we found evidence for the presence of spanning clusters (i.e. the appearance of very large patches spanning from one side of the studied area to the other, see lowest curvature cases in Supplementary material Appendix 4 Fig. A2). Spanning clusters are formed because high cover levels can increase the merging of vegetation, even in the absence of mechanisms promoting vegetation clump-ing (Kéfi et al. 2011, Abades et al. 2014). Although the formation of spanning clusters has been found to be more frequent at cover values around 50–60% in previous studies
● ● ● ● ● ● ● ● ● ● ● ● ● ● ● ● ● ● ● ● ● ● ● ● ● ● ● ● ● ● ● ● ● All Shrublands −0.5 0.0 0.5 1.0 Aridity: Cover Aridity: HeightAridity: Facil Aridity:Soil ASoil A % FacilHeight Total cover Sand content Ppt Warmest QAridity Standardized effect on median Predictors ● ● ● ● ● ● ● ● ● ● ● ● ● ● ● ● ● ● ● ● ● ● ● ● ● ● ● ● ● ● ● ● ● All Shrublands −1.0 −0.5 0.0 0.5 Standardized effect
on curvature Standardized effecton regularity
Aridity: Cover Aridity: HeightAridity: Facil Aridity:Soil ASoil A % FacilHeight Total cover Sand content Aridity Aridity: Cover Aridity: HeightAridity: Facil Aridity:Soil ASoil A % FacilHeight Total cover Sand content Aridity
(a)
(b)
(c)
Grasslands Grasslands Ppt Warmest Q Ppt Warmest Q ● ● ● ● ● ● ● ● ● ● ● ● ● ● ● ● ● ● ● ● ● ● ● ● ● ● ● ● ● ● ● ● ● All Shrublands −1.0 −0.5 0.0 0.5 1.0 GrasslandsFigure 4. Predictors of spatial patterns in global drylands. Standardized effect sizes of the predictors of median plant patch-size (a), curvature of PSD (–1 × a parameter, (b)) and regularity (c) for all habitat types (n = 70), grasslands (n = 37) and shrublands (n = 33) after model averaging of the best models in multimodel inference analysis (ΔAIC respect from the best model < 2). Abiotic (red) and biotic (blue) driv-ers, and the interactions between them (dark red) are displayed in the y-axis. Bars represent 95% confidence intervals of effect sizes. Soil A: soil amelioration; %Facil: percentage of facilitated species; Ppt warmest Q: percentage of annual rainfall in the warmest quarter of the year.
(cf. Kéfi et al. 2011, Abades et al. 2014), we found these clus-ters in sites with lower cover values. Indeed an analyses to detect the thresholds at which spanning clusters are formed indicated that the threshold cover was 44.5% rather than 50–60% with facilitation due to soil amelioration promoting its emergence (Supplementary material Appendix 4 Fig. A7).
Aridity as a modulator of spatial patters across habitats
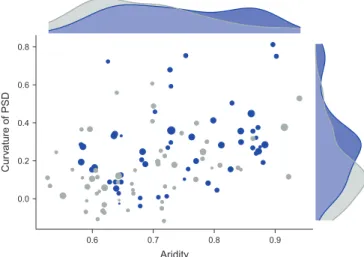
We found that abiotic constraints such as aridity, and factors reducing effective precipitation such as, rainfall seasonality, or sand content (in shrublands) are, in general, related with sites exhibiting larger median patch sizes and more curved PSDs. These attributes of spatial patterns associated with the prevalence of a dominant scale in plant patches which is further emphasized by the emergence of regular spotted pat-terns with increasing aridity (Fig. 5). This concurs with the reported shifts to regular patterns under drought conditions (Barbier et al. 2006). Our study provides the first attempt of studying the change in the type of spatial pattern as a con-tinuum and is the first empirically showing the succession from irregular to regular patterns along aridity gradients in drylands worldwide. Indeed, some studies have linked patch formation with increases in the ability of plants to maintain a high biomass due to an increased resource capture efficiency (Aguiar and Sala 1999, Boer and Puigdefábregas 2005, Meyra et al. 2012) and regular spotted patterns have been interpreted in some simulations as alternative states of desert systems (Rietkerk et al. 2004, Kéfi et al. 2010).
Although aridity per se was not a significant predictor of the shape of PSDs, it strongly modulated the effects of biotic attributes on the shape of PSDs in shrublands, but not in grasslands (Fig. 4). Grasslands in our dataset were particularly prevalent under moderate aridity conditions (Supplementary
material Appendix 4 Fig. A8), so the lack of interactions with aridity might be a consequence of a smaller aridity range in the grasslands surveyed. Our findings indicate that, in shrub-lands, aridity prevents biotic attributes (such as the traits of the dominant species or the percentage of facilitated species) to form large patches under the most arid conditions (Fig. 4). This provides empirical support to the often hypothesized facilitation collapse as the mechanism underlying shifts from power law to curved PSDs under extreme environments (Kéfi et al. 2007b). Some studies have observed or hypoth-esized a diminished importance of facilitation for community assembly as aridity increases (Holmgren and Scheffer 2010, Berdugo et al. 2018a). Although this pattern does not seem to hold for the effect of facilitation on species richness (Soliveres and Maestre 2014), unimodal facilitation–aridity relation-ships have been observed for the effect of facilitation on spe-cies abundances and vegetation biomass (Mazia et al. 2016, Berdugo et al. 2018a). Such a decrease in the importance of facilitation has been related to community specialization to arid conditions (Berdugo et al. 2018a) and, therefore, may underpin the low importance of positive plant–plant inter-actions under these conditions. Moreover, the dampening of facilitation–spatial pattern relationships in the most arid conditions reported here, may mean that competition substi-tuted facilitation as an important driver of spatial patterns in the driest sites. This would explain the emergence of regular-ity under the most arid conditions (Klausmeier 1999, Peter and Elke 2005, Gilad et al. 2007). Our results link this shift from facilitation to competition with the reduction in the frequency of large patches and to the abrupt changes in PSDs observed under extreme aridity conditions (Berdugo et al. 2017).
Factors related to the shape of patch-size distributions are specific of each vegetation-type
Plant–plant interactions have been invoked as the major mechanism forming plant spatial patterns in drylands (Lejeune et al. 1999, Barbier et al. 2008, von Hardenberg et al. 2010). Here we found a clear association between plant co-occurrences (our surrogate for facilitation) and all the spatial pattern attributes evaluated (Fig. 4). Among these results, we found a clear negative link between facilitation and regularity. Regular patterns are thought to be the conse-quence of competition operating at certain intermediate scales when compared with facilitation (Peter and Elke 2005, von Hardenberg et al. 2010). When facilitation wanes, it is likely that competition takes over the importance of plant–plant interactions, in agreement with this hypothesis. It is worth noting that separating direct facilitation effects from other co-occurrence mechanisms such as seed trapping or habitat sharing is challenging from observational data (Cipriotti and Aguiar 2015, Delalandre and Montesinos-Navarro 2018). Still, our results suggest that contrasting facilitation mecha-nisms (microclimate vs soil amelioration) may have contrast-ing effects on plant spatial patterns dependcontrast-ing on the habitat type. We found that the percentage of facilitated species
0.0 0.2 0.4 0.6 0.8 0.6 0.7 0.8 0.9 Aridity Cu rv ature of PSD
Figure 5. Change in spatial patterns through aridity gradients. Relationship between PSD curvature and aridity. The size of the points is proportional to the median of patch sizes, while color indi-cates regularity (blue). The upper pannel shows the distribution of aridity values for regular and irregular patterns; the right pannel shows the same trend for PSD curvature.
was an important predictor of spatial patterns (regularity, median patch-size and shape of PSDs) in both grasslands and shrublands, whereas soil amelioration was only important in shrublands. We also found that, whereas in grasslands the number of species that are facilitated promoted the formation of large plant patches (as shown by less curved PSDs), this had the opposite effect in shrublands (Supplementary mate-rial Appendix 4 Table A1). This result suggests that, in shrub-lands, the number of facilitated species is constraining the ability of nurses to increase patch sizes, probably because the more individuals are present in an area, the less they can grow (Schöb et al. 2014). An alternative explanation is that facili-tated species accumulate beneath the canopy of large shrubs (therefore not contributing to larger patch sizes) whereas they prefer the canopy border of grasses (Aguiar and Sala 1999), therefore contributing strongly to the formation of large patches in grasslands but not in shrublands.
Some abiotic factors showed contrasting effects depend-ing on the vegetation type and the indicators studied. Precipitation during the warmest quarter of the year in grass-lands promoted curved PSDs with high median and regular-ity, whereas in shrublands only decreased the median of patch sizes. Whereas grasses might depend strongly on water pulses, shrubs have deeper roots and do not depend so strongly on rainfall seasonality (Sala et al. 1997). On the other hand, sand content showed a positive effect on the emergence of regular spatial patterns in shrublands, and a negative effect on grasslands. Some studies report associations between loamy soils and the occurrence of regular spatial patterns which con-cur with those reported in grasslands (Deblauwe et al. 2008). We think two processes may explain these contrasting results for shrublands. First, sand content may increase experienced water stress and constraint soil amelioration. Shrublands in our database comprised larger aridity gradients than grass-lands, so plants may be more prone to compete than to facili-tate in the most extreme environments. Second, although the pivot roots typical from shrubs may find less problems on reaching subsoil resources to avoid competition, when plants have similar typologies (e.g. all of them are shrubs) competition may take place in the deep root layer. In this regard sand allows roots to explore more extense areas and therefore exploit resources from non vegetated areas, acting as a draining systems that prevents establishments of plants, and, therefore, affecting radius of belowground competition which will produce regular patterns.
Implications for future research
The association between the percentage of facilitated spe-cies and the shape of PSDs suggests that the results of previ-ous theoretical approaches, which investigated the effects of facilitation on pattern formation without taking into account multispecific plant–plant interactions (Kéfi et al. 2007a, von Hardenberg et al. 2010), may be affected by incorporating several plant species interacting with each other. Our study highlights the necessity of including community-specific mechanisms of facilitation in models aiming to simulate
plant spatial patterns. These community-specific mecha-nisms may depend on species pool and habitat filtering, in addition to the strength of facilitation per se (Fukami 2015, Berdugo et al. 2018a).
Our results relate soil amelioration mechanisms to patch formation and irregular patterns only in shrublands, while showing the relationship between the latter and the increase in species richness via facilitation in both grassland and shrublands. These important differences between habitat types on how facilitation associates with spatial patterns have been seldom studied. These mechanisms can directly impact ecosystem functioning (through the effect of the dominants on nutrients pools, see Grime 1998, or by enhancing the diversity of species, see Tilman et al. 1997, respectively) and are directly affected by facilitation (Maestre et al. 2003, Le Bagousse-Pinguet et al. 2014). It remains to be identified, however, if these two facilitation-related mechanisms only have an indirect effect, mediated by their effect on plant spa-tial patterns, or if they also have direct effects on ecosystem functioning. Future studies also need to examine whether direct (soil amelioration and increases in species richness) and indirect (through the formation of spatial patterns) effects of facilitation on ecosystem functioning might feedback on each other to better understand the overall consequences of facilitation for ecosystem functioning.
Our study also informs about the structural implications of the shifts from grasslands to shrublands reported world-wide (also known as shrub or woody encroachment Eldridge et al. 2011). Shrub encroachment by itself does not necessarily entail losses in ecosystem diversity and/or functioning (Eldridge et al. 2011, Eldridge and Soliveres 2015). However, our findings suggest that, if the dominant growth form shifts, the processes of spatial pattern forma-tion might be altered and become more dependent on soil amelioration. If accompanied by increases in aridity, our results on the shape of PSD predict that shrub encroachment could be associated to fewer large patches due to the lost of facilitative interactions, which might be linked to functional-ity losses (Berdugo et al. 2017). Indeed, the effects of shrub encroachment on soil functioning changed throughout arid-ity gradients, shifting from positive to negative with aridarid-ity (Jackson et al. 2002, Eldridge et al. 2011, Soliveres et al. 2014b, but see Knapp et al. 2008).
Concluding remarks
By examining the typology and predictors of plant spatial patterns in drylands worldwide, we found that the shape of PSD tends to become more curved by loosing both large and small plant patches, and that regular patterns emerged in the driest environments. Our results demonstrate differences in the predictors of dryland vegetation spatial patterns depend-ing on the habitat type considered. We provide evidence for a link between positive plant–plant interactions and spatial patterns, an effect that seems to be mainly due to the addition of new species to the patches, rather than by the soil amelio-ration under the nurses (although this mechanism was also
important in shrublands). We also highlight the importance of effective precipitation and sand content as predictors of spatial patterns in grasslands and shrublands, respectively. Altogether, our study constitutes a significant step forward in our understanding of how vegetation spatial patterns are formed and distributed in drylands worldwide, and highlight the importance of habitat type and aridity as predictors of such patterns in these globally important ecosystems.
Acknowledgements – We thank Chi Xu for discussions during
the processing of the images, and all the members of the EPES-BIOCOM network for the collection of field data. Martin Aguiar, Thorsten Wiegand and two anonymous reviewers provided numerous and very constructive comments that substantially improved earlier versions of this manuscript. We also thank Pierre Couteron for his assistance during the classification of regular spatial patterns.
Funding – This work was funded by the European Research
Council (ERC Grant agreements 242658 [BIOCOM] and 647038 [BIODESERT]). MB was supported by a FPU fellowship from the Spanish Ministry of Education, Culture and Sports (ref. AP2010-0759). FTM acknowledges support from a Research Award from the Alexander Von Humboldt Foundation. SS was supported by the Spanish Government under a Ramón y Cajal contract (RYC-2016-20604). The research of SK has received funding from the European Union’s Seventh Framework Programme (FP7/2007-2013) under grant agreement no. 283068 (CASCADE).
Author contributions – FTM designed the study and coordinated
data collection. MB analyzed the data, helped by SK and SS. MB wrote the manuscript, with contributions from all authors.
References
Abades, S. R. et al. 2014. Fire, percolation thresholds and the savanna forest transition: a neutral model approach. – J. Ecol. 102: 1386–1393.
Aguiar, M. R. and Sala, O. E. 1999. Patch structure, dynamics and implications for the functioning of arid ecosystems. – Trends Ecol. Evol. 14: 273–277.
Aguiar, M. R. et al. 1992. Competition and facilitation in the recruitment of seedlings in Patagonian steppe. – Funct. Ecol. 6: 66–70.
Allington, G. R. H. and Valone, T. J. 2014. Islands of fertility: a byproduct of grazing? – Ecosystems 17: 127–141.
Anderson, J. M. and Ingram, J. S. I. 1994. Tropical soil biology and fertility: a handbook of methods. – Soil Sci. 157: 265. Barbier, N. et al. 2006. Self organized vegetation patterning as a
fingerprint of climate change and human impact on semi-arid ecosystems. – J. Ecol. 94: 537–547.
Barbier, N. et al. 2008. Spatial decoupling of facilitation and com-petition at the origin of gapped vegetation patterns. – Ecology 89: 1521–1531.
Barton, K. 2016. MuMIn: multi-model inference. – R package ver. 1.15.6.
Berdugo, M. et al. 2017. Plant spatial patterns identify alternative ecosystem multifunctionality states in global drylands. – Nat. Ecol. Evol. 1: 3.
Berdugo, M. et al. 2018a. Aridity preferences alter the relative importance of abiotic and biotic drivers on plant species abundance in global drylands. – J. Ecol. doi:10.1111/1365-2745.13006
Berdugo, M. et al. 2018b. Data from: The interplay between facil-itation and habitat type drives spatial vegetation patterns in global drylands. – Figshare Digital Repository, <https://dx.doi. org/10.6084/m9.figshare.5640193>.
Boer, M. and Puigdefábregas, J. 2005. Effects of spatially structured vegetation patterns on hillslope erosion in a semiarid Mediter-ranean environment: a simulation study. – Earth Surf. Process. Landforms 30: 149–167.
Bordeu, I. et al. 2016. Self-replication of localized vegetation patches in scarce environments. – Sci. Rep. 6: 33703.
Borthagaray, A. I. et al. 2012. Connecting landscape structure and patterns in body size distributions. – Oikos 121: 697–710. Burnham, K. P. and Anderson, D. R. 2004. Multimodel inference.
– Soc. Methods Res. 33: 261–304.
Cartenì, F. et al. 2012. Negative plant soil feedback explaining ring formation in clonal plants. – J. Theor. Biol. 313: 153–161. Cipriotti, P. A. and Aguiar, M. R. 2015. Is the balance between
competition and facilitation a driver of the patch dynamics in arid vegetation mosaics? – Oikos 124: 139–149.
Cosby, H. E. 1960. Rings on the range. – J. Range. Manage. 13: 283–288.
Couteron, P. 2002. Quantifying change in patterned semi-arid vegetation by Fourier analysis of digitized aerial photographs. – Int. J. Remote Sens. 23: 3407–3425.
Couteron, P. and Lejeune, O. 2001. Periodic spotted patterns in semi‐arid vegetation explained by a propagation‐inhibition model. – J. Ecol. 89: 616–628.
Deblauwe, V. et al. 2008. The global biogeography of semi-arid periodic vegetation patterns. – Global Ecol. Biogeogr. 17: 715–723.
Delalandre, L. and Montesinos-Navarro, A. 2018. Can co-occurrence networks predict plant–plant interactions in a semi-arid gypsum community? – Perspect. Plant Ecol. Evol. Syst. 31: 36–43.
Delgado-Baquerizo, M. et al. 2013. Decoupling of soil nutrient cycles as a function of aridity in global drylands. – Nature 502: 672–676.
Eldridge, D. J. and Soliveres, S. 2015. Are shrubs really a sign of declining ecosystem function? Disentangling the myths and truths of woody encroachment in Australia. – Aust. J. Bot. 62: 594–608.
Eldridge, D. J. et al. 2011. Impacts of shrub encroachment on ecosystem structure and functioning: towards a global synthesis. – Ecol. Lett. 14: 709–722.
Fukami, T. 2015. Historical contingency in community assembly: integrating niches, species pools, and priority effects. – Annu. Rev. Ecol. Evol. Syst. 46: 1–23.
Gilad, E. et al. 2007. A mathematical model of plants as ecosystem engineers. – J. Theor. Biol. 244: 680–691.
Goslee, S. C. et al. 2003. High-resolution images reveal rate and pattern of shrub encroachment over six decades in New Mexico, USA. – J. Arid Environ. 54: 755–767.
Grime, J. P. 1998. Benefits of plant diversity to ecosystems: immediate, filter and founder effects. – J. Ecol. 86: 902–910. Gross, N. et al. 2017. Functional trait diversity maximizes ecosystem
multifunctionality. – Nat. Ecol. Evol. 1: 132.
Hijmans, R. J. et al. 2005. Very high resolution interpolated climate surfaces for global land areas. – Int. J. Climatol. 25: 1965–1978.
Holmgren, M. and Scheffer, M. 2010. Strong facilitation in mild environments: the stress gradient hypothesis revisited. – J. Ecol. 98: 1269–1275.
Huxman, T. E. et al. 2005. Ecohydrological implications of woody plant encroachment. – Ecology 86: 308–319.
Jackson, R. B. et al. 2002. Ecosystem carbon loss with woody plant invasion of grasslands. – Nature 418: 623–626.
Kattge, J. et al. 2011. TRY – a global database of plant traits. – Global Change Biol. 17: 2905–2935.
Kéfi, S. et al. 2007a. Spatial vegetation patterns and imminent desertification in Mediterranean arid ecosystems. – Nature 449: 213–217.
Kéfi, S. et al. 2007b. Local facilitation, bistability and transitions in arid ecosystems. – Theor. Popul. Biol. 71: 367–379. Kéfi, S. et al. 2010. Bistability and regular spatial patterns in arid
ecosystems. – Theor. Ecol. 3: 257–269.
Kéfi, S. et al. 2011. Robust scaling in ecosystems and the meltdown of patch size distributions before extinction. – Ecol. Lett. 14: 29–35.
Kettler, T. A. et al. 2001. Simplified method for soil particle-size determination to accompany soil-quality analyses. – Soil Sci. Soc. Am. J. 65: 849–852.
Klausmeier, C. A. 1999. Regular and irregular patterns in semiarid vegetation. – Science 284: 1826–1828.
Knapp, A. K. et al. 2008. Shrub encroachment in North American grasslands: shifts in growth form dominance rapidly alters control of ecosystem carbon inputs. – Global Change Biol. 14: 615–623.
Le Bagousse-Pinguet, Y. et al. 2014. Importance, but not intensity of plant interactions relates to species diversity under the interplay of stress and disturbance. – Oikos 123: 777–785. Le Bagousse-Pinguet, Y. et al. 2017. Testing the environmental
filtering concept in global drylands. – J. Ecol. 105: 1058–1069.
Lefever, R. and Lejeune, O. 1997. On the origin of tiger bush. – Bull. Math. Biol. 59: 263–294.
Lejeune, O. et al. 1999. Short range co-operativity competing with long range inhibition explains vegetation patterns. – Acta Oecol. 20: 171–183.
Lejeune, O. et al. 2002. Localized vegetation patches: a self-organized response to resource scarcity. – Phys. Rev. E 66: 10901. Lett, M. S. and Knapp, A. K. 2003. Consequences of shrub
expansion in mesic grassland: resource alterations and grami-noid responses. – J. Veg. Sci. 14: 487–496.
Liancourt, P. et al. 2017. SGH: stress or strain gradient hypothesis? Insights from an elevation gradient on the roof of the world. – Ann. Bot. 120: 29–38.
Lin, Y. et al. 2010. Spatial vegetation patterns as early signs of desertification: a case study of a desert steppe in Inner Mongolia, China. – Landscape Ecol. 25: 1519–1527.
Ludwig, J. A. et al. 2005. Vegetation patches and runoff-erosion as interacting ecohydrological processes in semiarid landscapes. – Ecology 86: 288–297.
Lukacs, P. M. et al. 2009. Model selection bias and Freedman’s paradox. – Ann. Inst. Stat. Math. 62: 117.
Maestre, F. T. and Cortina, J. 2005. Remnant shrubs in Mediter-ranean semi-arid steppes: effects of shrub size, abiotic factors and species identity on understorey richness and occurrence. – Acta Oecol. 27: 161–169.
Maestre, F. T. and Escudero, A. 2009. Is the patch size distribution of vegetation a suitable indicator of desertification processes? – Ecology 90: 1729–1735.
Maestre, F. T. et al. 2001. Potential for using facilitation by grasses to establish shrubs on a semiarid degraded steppe. – Ecol. Appl. 11: 1641–1655.
Maestre, F. T. et al. 2003. Positive, negative, and net effects in grass-shrub interactions in Mediterranean semiarid grasslands. – Ecology 84: 3186–3197.
Maestre, F. T. F. T. et al. 2012. Plant species richness and ecosystem multifunctionality in global drylands. – Science 335: 214–218. Mayor, A. G. et al. 2013. Feedbacks between vegetation pattern
and resource loss dramatically decrease ecosystem resilience and restoration potential in a simple dryland model. – Landscape Ecol. 28: 931–942.
Mazia, N. et al. 2016. The sign and magnitude of tree–grass interaction along a global environmental gradient. – Global Ecol. Biogeogr. 25: 1510–1519.
Meyra, A. G. et al. 2012. Vegetation patterns in limited resource ecosystems: a statistical mechanics model and Monte Carlo simulations. – Mol. Phys. 110: 173–178.
Moreno de las Heras, M. et al. 2011. Assessing landscape structure and pattern fragmentation in semiarid ecosystems using patch-size distributions. – Ecol. Appl. 21: 2793–2805.
Mugglestone, M. A. and Renshaw, E. 1998. Detection of geological lineations on aerial photographs using two-dimensional spectral analysis. – Comput. Geosci. 24: 771–784.
Ochoa-Hueso, R. et al. 2018. Soil fungal abundance and plant functional traits drive fertile island formation in global drylands. – J. Ecol. 106: 242–253.
Okin, G. S. et al. 2009. Impact of feedbacks on Chihuahuan desert grasslands: transience and metastability. – J. Geophys. Res. 114: G01004.
Penny, G. G. et al. 2013. Local properties of patterned vegetation: quantifying endogenous and exogenous effects. – Phil. Trans. A Math. Phys. Eng. Sci. 371: 20120359
Peter, S. and Elke, B. 2005. Pattern and process: competition causes regular spacing of individuals within plant populations. – J. Ecol. 93: 395–403.
Pugnaire, F. I. et al. 1996. Facilitation and succession under the canopy of a leguminous shrub, Retama sphaerocarpa, in a semi-arid environment in south-east Spain. – Oikos 76: 455–464.
Pugnaire, F. I. et al. 2004. Soil as a mediator in plant–plant interactions in a semi-arid community. – J. Veg. Sci. 15: 85–92. Ravi, S. et al. 2008. Form and function of grass ring patterns in
arid grasslands: the role of abiotic controls. – Oecologia 158: 545–555.
Rietkerk, M. et al. 2004. Self-organized patchiness and catastrophic shifts in ecosystems. – Science 305: 1926–1929.
Ripley, B. D. 1981. Spatial statistics. – John Wiley and Sons. Sala, O. E. et al. 1997. Plant functional types in temperate semi-arid
regions. – In: Smith, T. M. et al. (eds), Plant functional types. Cambridge Univ. Press, pp. 217–233.
Scanlon, T. M. et al. 2007. Positive feedbacks promote power-law clustering of Kalahari vegetation. – Nature 449: 209–212. Schneider, F. D. and Kéfi, S. 2016. Spatially heterogeneous pressure
raises risk of catastrophic shifts. – Theor. Ecol. 9: 207–217. Schöb, C. et al. 2014. The context dependence of beneficiary
feedback effects on benefactors in plant facilitation. – New Phytol. 204: 386–396.
Sheffer, E. et al. 2007. Why do plants in resource-deprived environments form rings? – Ecol. Complex. 4: 192–200. Soliveres, S. and Maestre, F. T. 2014. Plant–plant interactions,
of community-level studies. – Perspect. Plant Ecol. Evol. Syst. 16: 154–163.
Soliveres, S. et al. 2014a. Functional traits determine plant co-occurrence more than environment or evolutionary related-ness in global drylands. – Perspect. Plant Ecol. Evol. Syst. 16: 164–173.
Soliveres, S. et al. 2014b. Plant diversity and ecosystem multifunc-tionality peak at intermediate levels of woody cover in global drylands. – Global Ecol. Biogeogr. 23: 1408–1416.
Tarnita, C. E. et al. 2017. A theoretical foundation for multi-scale regular vegetation patterns. – Nature 541: 398.
Throop, H. L. and Archer, S. R. 2009. Resolving the dryland decomposition conundrum: some new perspectives on poten-tial drivers. – In: Lüttge, U. et al. (eds), Progress in botany, vol. 70. Springer, pp. 171–194.
Tilman, D. et al. 1997. The influence of functional diversity and composition on ecosystem processes. – Science 277: 1300–1302.
Tongway, D. J. et al. 2001. Banded vegetation patterning in arid and semiarid environments: ecological processes and consequences for management. – Springer Science and Business Media. Udvardy, M. D. F. and Udvardy, M. D. F. 1975. A classification of
the biogeographical provinces of the world. – International Union for Conservation of Nature and Natural Resources Morges, Switzerland.
von Hardenberg, J. et al. 2010. Periodic versus scale-free patterns in dryland vegetation. – Proc. R. Soc. B 277: 1771–1776. White, E. P. et al. 2008. On estimating the exponent of power-law
frequency distributions. – Ecology 89: 905–912.
Xu, C. et al. 2015. Can we infer plant facilitation from remote sensing? A test across global drylands. – Ecol. Appl. 25: 1456–1462.
Zomer, R. J. et al. 2008. Climate change mitigation: a spatial analysis of global land suitability for clean development mech-anism afforestation and reforestation. – Agric. Ecosyst. Environ. 126: 67–80.
Supplementary material (Appendix ECOG-03795 at < www. ecography.org/appendix/ecog-03795 >). Appendix 1–4.