Coterie: A Visualization of the
Conversational Dynamics within IRC
Dana Sean Spiegel
S.B., Brain and Cognitive Science, Massachusetts Institute of Technology (1999) Submitted to the Program in Media Arts and Sciences,
School of Architecture and Planning,
in partial fulfillment of the requirements for the degree of Master of Science in Media Arts and Sciences
at the Massachusetts Institute of Technology August 10, 2001
Massachusetts Institute of Technology 2001. All rights reserved.
Afhor
-\J
/
Wjogram in Media Arts and Sciences ugust 10, 2001
Ciffied by Judith Donath
Assistant Professor of Media Arts and Sciences MIT Media Laboratory
Thesis Supervisor
Accepkil by
Dr. Andrew Lippman
Chair, Department Committee on Graduate Students
-Coterie: A Visualization of the
Conversational Dynamics within IRC
Dana Sean SpiegelS.B., Brain and Cognitive Science, Massachusetts Institute of Technology (1999) Submitted to the Program in Media Arts and Sciences,
School of Architecture and Planning,
in partial fulfillment of the requirements for the degree of Master of Science in Media Arts and Sciences
at the Massachusetts Institute of Technology August 10, 2001
Abstract
Social patterns are observable in real-world interactions as visual cues. Online, however, there are few visual cues available that can be used to see and under-stand social patterns. In this thesis, I suggest that many of these social patterns are still present in our interactions online in text chat; they are merely encoded in the textual interactions. This thesis presents Coterie, a visualization of the conversational dynamics of an Internet Relay Chat (IRC) channel. Through Coterie, viewers can see the social patterns that underlie the text interactions between conversants. Using the chat messages posted to an IRC channel by users, Coterie builds statistical models for individual and channel-level interac-tion based on existing real-world sociometric models. Coterie also automati-cally separates out conversations using a conversation model based on a word usage algorithm. This information is then presented to the viewer through a novel display based on models for real-world small group interaction, which allows the viewer to see historical patterns of user interaction, such as a user's verbosity, as well as channel-level patterns, such as cohesiveness. The visual-ization is evaluated based on how well it makes such patterns visible, and fur-ther directions for its development are presented.
Thesis Advisor: Judith Donath
Coterie: A Visualization of the
Conversational Dynamics within IRC
Dana Sean SpiegelThe following people served as readers for this thesis:
John Maeda
Associate Professor of Media Arts and Sciences MIT Media Laboratory
FA
Just'ne Cassell
Assliate Professor of Media Arts and Sciences MIT Media Laboratory
Table of Contents
1 Acknowledgem ents ... 7
2 Introduction Social Beings in a Visual World... 10
C oterie ... 13
Internet Relay Chat... 15
Existing Interfaces for Online Chat ... 18
3 Coterie's Evolution Dynamics in a Real World Social Space ... 27
Multidimensional Abstract Displays of People ... 29
Initial Implementation of Coterie... 31
Coterie Revisited ... 33
4 Statistical Model of Chat Activity Real World Social M easures ... 36
Online Social M easures... 40
Higher-level Descriptions of Online Social Interaction. . 45 5 Automatically Generated Representations of People User Representations in Online Chat ... 47
User Representations in Coterie ... 49
6 Multidimensional Display of User Information Dimensions of Information Display... 53
Color and Size ... 54
Location ... 60
M otion ... 62
Physically-based M odeling ... 66
C h at. .. . . .. .. . . .. .. . .. . .. . . . .. .. .. . . .. 68
T im e ... 72
Autonomous Existence ... 73
7 Automatic Conversation Separation Visual Conversations ... 74
Automatic Conversation Separation... 76
Conversation Finder Algorithm... 78
Comparing Manual and Automatic Categorization ... 82
8 Building Upon Coterie Understanding How Patterns Affect Interaction ... 86
M odels for Chat Activity ... 88
Visual Techniques for Revealing Social Patterns ... 89
Conversation Recognition ... 90
9 Conclusion ... 93
10 Bibliography ... 95
11 Related Readings ... 98
Appendix A: Coterie in Action ... 100
Table of Figures
1 C oterie ... 2 m IRC ... 3 ChatCircles ... 4 The Palace ... 5 BodyChat... 6 Comic Chat ... 7 Visualization of Real World Int 8 PainterlyVisualization ... 9 Data Bindings in PainterlyVisu10 First Version of Coterie ... 11 Coterie's Current Visualization. 12 Group Statistics... 13 Individual Statistics... 14 Bouncing Ball ... 15 A User in Coterie... 16 H ue ... 17 Brightness and Transparency . 18 Size ... 19 Lurkers ... 20 Milgram's Crowds... 21 Crowd Layout ... 22 Coterie's Screen Layout ... 23 Jum ping... 24 Physical Model ... 25 Chat Display ... 26 Expanded Coterie Display ....
. . . . .. . - . . . . 16 . . . 19 . . . 2 0 . . . 2 2 . . . 24 eraction ... 28 . . . 30 alization ... 30 . . . 32 . . . 34 . . . 4 1 . . . 4 2 . . . 50 . . . 50 . . . 54 . . . 5 5 . . . 57 . . . 58 . . . 6 1 . . . 6 1 . . . 62 . . . 6 3 . . . 6 6 . . . 6 8 . . . 69 Table of Figures
Acknowledgments
Though this thesis is the culmination ofny two years as a Masters stu-dent at the MIT Media Lab, it is the product of my six years at MIT and the interactions and collaborations I have had with many people over those years.
I would like to thank:
My advisor, Judith Donath, head of the Sociable Media Group. You have taught me great things about social research and design, and I am indebted to you for giving me the opportunity to pursue research at the Lab.
My thesis readers, John Maeda and Justine Cassell, who have enhanced this thesis through their guidance, and provided worth-while feedback about its organization, design, and content.
The members of the Sociable Media Group: danah boyd, David Chiou, Kelly Dobson, Scott Golder, Jonathan Goler, Tina Huang, Karrie Karahalios, Raffi Krikorian, Hyun-Yuel Lee, Matt Lee, David Nguyen, Daniel Ramage, Roy Rodenstein, Joey Rozier, Derek Tang, Fernanda Viegas, and Rebecca Xiong. The Sociable Media Group has been my home for the last two years, and you have all helped me to challenge my thinking and design.
The Digital Life Consortium for supporting this research.
My friends at the Media Lab: Pascal Chesnais, Adam Smith, Jim Youll, Sunil Vemuri, Rebecca Reich, Youngmoo Kim, Mike Annany, Doug Koen, and many others. You have made the Lab a fun and playful place for learning and exploration.
Regina Joseph, who started me on the path to media and design. You have always challenged me, and have been one of my most dynamic,
interesting, and fun friends.
My friends at home in New York: Jason Menkes, Eric Poretsky, Matt Klein, Elissa Donenfeld, and many others. We've waited patiently for six years for all of us to be together again in New York. You have always been supportive and, whether or not you understood what I was talking about (even I'm not sure I do...) you were and still are always excited to listen.
Eric Plosky, best friend and partner-in-crime, for making these six years at MIT exciting and fun, and for never settling for anything less than the best from me.
Mindy Spire, for your love and support.
My mother, father, sister, and brother for always believing in me and supporting me. You have more influence upon my life then you know, and I am forever grateful for such a loving family.
2 Introduction
2.1 Social Beings in a Visual World
As social beings, we learn from a very early age how to interact with others in a social setting. Much of our understanding of how such social groups work and how we can interact with them derives from appearance. By observing a group of people interacting, we can understand their social dynamic. How people interact and converse with one another, how they move from conversation to conversation, and how their presence and level of activity changes over time are all patterns of small group interaction that we can understand by view-ing such groups of people.
Imagine you are walking through a city square on a nice summer day. As you walk, you encounter people strolling and window-shopping.
Ahead, you see a gathering of people, arranged in a circle, who seem to be paying attention to something within the group. You walk up to the edge of the crowd, realizing that there must be something of interest within the circle, perhaps a street performer. How do you know that there is someone or something of interest beyond your view? You have watched the people in the group interact: there are people who are attending to whatever is going on within the circle, people who are talking to those around them, and people who are drifting into and out of the crowd. All of these visual patterns tell you that there is something interesting at the center of the group. If the people ahead of you were not engaged, or were running into and out of the crowd quickly, then your impression of what was going on in that space might be completely different. Patterns of social activity allow us to visually gather, or "read," information about the group.
Alternatively, imagine you are at a cocktail party. You've just walked into the room, and there are a number of guests that have already arrived. Some you recognize as friends; others look completely new to you. As you glance around, you notice that most of the people in the room are interacting with one another. Moreover, there are a number of small groups, each with only a handful of people. In most of these groups a lively conversation is taking place. In some of the groups, people seem to be either drifting apart or moving into other conversations. Some groups are just forming, gathering people together into what seem to be growing conversations. There are people, mostly those milling around the edge of the room, who don't seem to be interacting with anyone else; either they are
com-pletely absorbed in thought, or are glancing around, as you are, look-ing for a lively conversation to join.
In both of these scenarios, it is clear how important the appearance of each person, as well as the appearance of each group taken as a sepa-rate and coherent whole, is to our ability to understand social inter-action. When you are at a party, and people form cliques, you can see at a glance groups of people who are having animated, dynamic, and therefore perhaps interesting conversations that you would like to join. You can also easily see dead conversations: those in which participants are looking around in search of another conversations, or are sipping their drinks quietly, barely saying anything to the people around them. There are the people-watchers, who watch the unfold-ing of the social situations around them, readunfold-ing the groups and the interaction within them with interest, and perhaps learning about the participants in those groups.
Imagine trying to accomplish any of these tasks without sight. By carefully listening to the people around you, you might still be able
to sense which groups are interesting and dynamic. However, your ability to distill this information depends on how well you can map out the conversations in your head. The visual portrayal of conversa-tional groups in the real world is a concise and rich encoding of social patterns. We gather important information as our perception moves from the individual, to small groups, to the entire social landscape. Without the visual dimension, groups become mostly incomprehen-sible: we may be able to sense some disjoint information about a
versation-perhaps that person A is talking to person B-but the overall picture, and how each person fits into that picture, is hidden. The Internet, through various communications channels such as email, multi-user dimensions (MUDs), Usenet, and Internet Relay Chat (IRC), is a social medium. We interact socially with each other online. We form conversational groups online, have discussions, and gather socially. Yet the visual expression of our group interactions is quite different on screen than in real life (there is minimal visual rep-resentation for users and groups in many cases), though behaviorally the interaction is very similar. When we interact in real time through online chat for example, we might play out the same social roles as at a cocktail party, but without most of the visual feedback that would
allow us to navigate the social space with ease.
2.2 Coterie
Social patterns are observable in real-world interactions as visual cues. Online, however, there are few visual cues available that we can use to see and understand social patterns. In this thesis, I suggest that many of these social patterns are still present in our interactions online in text chat; they are merely encoded in the textual interac-tions. We can make these patterns visible by discovering what the patterns are, extracting them from the chat, and visualizing them in an understandable way. The choice of which patterns to extract-or even which patterns are extractable-and how to visualize those patterns is driven by social issues as well as cognitive principles. By making these social patterns visible, we can create online social
Figure 1 Coterie. Coterie
is a conversation-centric visualization for IRC chat. Each user is represented by
a colored oval, and when a user posts a message, they
"hop" above the crowd. When users are having a conversation, they are brought together into the center area of the display.
Users who don't interact ("lurkers") exist in the background.
spaces that are more easily navigable, more intuitively understand-able, and more revealing of the types and depth of social interaction taking place.
This thesis will present Coterie, shown in Figure 1, a visualization of the conversational dynamics of an Internet Relay Chat (IRC) chan-nel. Through Coterie, viewers (people who are watching Coterie's visual-ization) can see the social patterns that underlie the text interactions between conversants. Coterie's
main goal is to make clear how each user (a person
1'a he
who is chatting in an IRC
ese skipped her lunch break andi took on
but she was a hardass channel through a
tra-ltm~I~lt~y"ditional interface)
inter-Nub
Saacts within the channel,
as well as to separate and distill the
conversa-she skipped her lunch break and took on
people even after closing tions between users on a
but Se was a hardas" t
Ip4+ebP 6 rk#V.prry' channel (where there can
be many conversations taking place
simultane-Nub
ously). Coterfe)s
visual-ization, which draws its
Introduction
information from statistical models describing how users within a channel interact, can give viewers a rich display that encodes aspects of user behavior such as activity and verbosity. The visualization also portrays information about the channel as a whole, such as its cohe-siveness. Along with this statistical information, Coterie automati-cally groups users based on the conversational thread in which they are currently participating. The visualization of this information can allow users to see, for example, who is talking to whom or which conversations are lively or boring. All of this information is gathered automatically over time from the chat messages that users post pub-licly to the IRC channel.
This thesis will discuss the pieces that make Coterie work: a statisti-cal model of chat activity, automatistatisti-cally generated user representa-tions, multidimensional interaction information display, and conver-sation separation. I claim that all of these components combine to create a visualization of IRC that is dynamic and information rich, is easily readable using already developed visual and social skills, and portrays the historical, social, and conversational patterns of users within a chat channel.
2.3 Internet Relay Chat
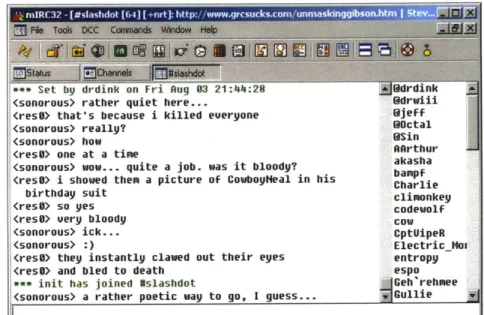
IRC, shown in Figure 2, is a well-known and popular chat system that presents both users and their messages as lists of text (Internet Relay Chat Protocol, 1993). A user can join a channel, and read or publicly post messages to the channel. In IRC, viewers can see the group of people currently within the channel as a list of names.
Mes-*** Set by drdink on Fri Rug UJ 21:44:Z
<sonorous> rather quiet here...
<resD> that's because i killed eueryone <sonorous> really?
<sonorous> how <resg> one at a time
<sonorous> wow... quite a job. was it bloody?
<res> i showed them a picture of Cowboyeal in his birthday suit
<res> so yes
<res0> uery bloody (sonorous> ick... (sonorous> :)
(resg> they instantly clawed out their eyes
<resg> and bled to death
** init has joined #slashdot
<sonorous> a rather poetic way to go, I guess...
owuruinm K rdrwiii @jeff @Octal MSin AArthur akasha bampf Charlie climonkey codewolf cow CptUipeR ElectricHoi entropy espo Geh'rehmee Gullie
sages posted to the channel are displayed in an list, ordered by their time of post. Though this interface is simple, it provides a rich envi-ronment for social interaction, and users of IRC gather and converse easily and fluidly.
Though the interface is very simple, IRC, like other purely text-based chats, is very popular. It is easy to use and has an almost transparent interface: all that users must do is type a message, and it appears within the channel. Addressing particular users is done by prefixing their user names to the message. Joining conversations requires no extra effort; a user only has to take his turn and post a
message continuing the conversation. As a result, the only barriers to interaction within IRC are social ones. A user's ability to interact within a channel or join a conversation depends on the social eti-quette of that channel as well as that user's social skills.
Introduction
Figure 2 mIRC. mIRC is a
standard IRC chat interface. Users are shown in a list on
the right, while the chat is shown on the left.
Within IRC, user representations are very basic. Each user in an IRC channel is represented only by his name, and differentiating users requires reading their names (though for some creative users, their uniquely chosen user names can be distinguished by visual pattern matching). A user's history in the channel is encoded completely in his chat postings, and users who don't participate in the chat have no visual differentiation from users who do. Generally, when using the IRC interface, users attend to the chat window, and not to the cur-rent users window. As a result, those users who don't chat seem to lurk-they become functionally invisible to active users, who often forget that such lurkers are there.
This text only interface, however, makes "reading" the group of people online difficult. The IRC interface requires constant attention to keep track of the activity on a channel. Though users can scroll back to see the content of conversations, they must read a significant portion of the transcript to keep track of which user belongs to what conversation, and to have a sense for the time-course for these
con-versations.
Coterie makes use of this already established community as a base
for its visualization. IRC presents an ideal system for discovering and displaying information about conversations and interaction. The pat-terns of interaction discussed in Section 2.2 already exist within IRC, and using the text interactions of users within the chat system,
rie can make these patterns visible. This thesis will discuss how Cote-rie's visualization and modeling systems compare to the way that the
traditional text interface for IRC portrays conversation and interac-tion.
2.4 Existing Interfaces for Online Chat
Coterie is a visualization. However, it is useful to compare its design
and display of social interaction to that of existing graphical chats; these graphical chats provide a baseline against which to compare and evaluate Coterie's visualization. All of these chat systems use text chat for user communication; however, each has unique characteris-tics and affordances for interaction, and Coterie builds upon the ideas presented by these chat interfaces. These graphical chats also present different models for social interaction, reflected in their interfaces. As such, they are useful for understanding the model of social interac-tion that Coterie uses, as well as the assumpinterac-tions that it makes about the interaction within IRC.
ChatCircles, shown in Figure 3, is an abstract graphical chat system,
where people, represented by circles, can move their representations around the chat space (Viegas and Donath, 1999). ChatCircles, by providing a graphical chat space, creates a visual display for the social interaction in a chat room. Every user is represented by a colored circle. Coloring, in this case, provides a visual characteristic with which to differentiate users. Since users actually move through a space on screen, they can also be tracked and differentiated through their location and motion. Coterie also uses a simple, abstract repre-sentation for each user with a channel.
Figure 3 ChatCircles. In *
ChatCircles, each user is represented by a circle that grows and shrinks as they post messages. Since ChatCircles has a "hearing range", users must be near each other to have conversations. As
a result, users move themselves into conversations groups, and those groups are shown visually by the appearance of clusters of people.
Though users still interact through text chat, a user's activity level, as well as the overall activity level of the chat room, can be visually discerned by watching the expansion and contraction of the circles in the display. When a user doesn't post messages, they appear as a small circle; even lurkers have this minimal visual presence. Coterie also employs a simple shape for user representations, but uses color, size, and motion to portray more information about each user's inter-action. From the history mode in ChatCircles, longer-term interac-tion patterns become apparent. Coterie builds on ChatCircles's pre-sentations of different time courses for interaction information, and integrates both short-term and long-term interaction history into a single display.
ChatCircles enforces a virtual hearing range: when users are beyond a
certain distance, their chat messages can't be seen (though their cir-cles still grow and shrink). The hearing range, which requires users to be close to one another to interact, causes users to form conver-sation groups. As a result, ChatCircles provides a converconver-sation-cen- conversation-cen-tric environment for chat. Coterie, by contrast, automatically moves users close together when it believes they have formed a conversation group. Both of these systems, however, provide conversation group-ing that allows viewers to easily follow conversation threads.
The Palace, shown in Figure 4, is an iconic chat system where people
are represented by small, two-dimensional cartoonish figures (The
Palace, 2000). The Palace is also a graphical chat, though different from ChatCircles. Users are represented graphically by icons, and can
position themselves anywhere within a chat room. A user's
represen-Figure 4 The Palace. The pSw I Ina ArIe Po I e a Minr OMberemenM
Palace is a graphical chat Tour de Por tucal
where users are =Portadaantan
represented by icons. They Adult ne
can jump around the room, ChftPT
and talk to anyone who is present. Unlike ChatCircles, there is no "hearing range", so users often have conversations from across the room, and individual conversation groups can be difficult to separate out. Users can change and animate their
representations, giving mo
them greater ability to express their personalities.
tation in this system provides virtually no information about a user's activity; For example, a user's icon doesn't change when he posts a message (though a bubble does appear over his head).
The Palace does offer a user the ability to customize his
representa-tion on screen, allowing him a way to express identity within the chat. User representations in The Palace, therefore, are unique reflections of their users, since users can represent themselves in chat rooms through icons that are meaningful to them, and that portray part of their personality. Coterie provides a more mutable and fluid reflec-tion of each user, based on how he interacts within a chat channel. Unlike The Palace, however, Coterie's representations are not directly changeable by users and are therefore less representative of how a user chooses to appear. Instead, Coterie's user representations are reflections of how a user acts in a channel.
BodyChat, shown in Figure 5, is an avatar-based chat system, where
users are represented by three-dimensional, humanoid avatars that have some autonomous visual behavior (Viljalmsson and Cassell, 1988). Unlike other chat interfaces, a user's representation is con-trolled, in part, by an agent that can provide visual, body language-based cues:
BodyChat is a system that allows users to
commu-nicate via text while their avatars automatically ani-mate attention, salutations, turn taking, back-channel feedback and facial expression, as well as simple body functions such as blinking of the eyes. (Viljalmsson and Cassell, 1998)
Figure 5 BodyChat. In
BodyChat, users are represented by three-dimensional avatars. When interacting with others, a user's avatar automatically signals conversational cues, such as nodding and waving.
BodyChat's user representations contain information about the
con-versation. Though the system is limited to one-on-one interaction, the displays that each avatar produces allow users to "read" each
other. BodyChat's interface is intended to be realistic, as opposed to ChatCircles's or Coterie's more abstract representations. The cues that
are played out by BodyChat's avatars are specific motions that occur when users behave in certain ways.
BodyChat creates a display where body language is viewable. The
visualization makes many assumptions about how a user wants to
Introduction
communicate and about the user's intentions. These assumptions, based on BodyChat's model for conversational interaction, free users from manually enacting certain behaviors, allowing them to concen-trate on the chat:
Many visual cues important to conversation are spon-taneous and even involuntary, making it impossible for the user to explicitly select them from a menu. Furthermore, the users are often busy producing the content of their conversation, so that simultaneous behavior becomes a burden. (Viljalmsson and Cassell, 1998)
This autonomy, however, can be heavy-handed; it "raises concerns about the system's capability to accurately reflect the user's inten-tions under unforeseen circumstances or resolve issues of ambigu-ity" (Viljalmsson and Cassell, 1998). While BodyChat's displays are not necessarily suitable for giving an overview of a large number of users-its interface is intended for one-on-one interaction-the ava-tars do allow users to "read" each other.
Like BodyChat, Coterie's visualization is built around the
autono-mous display of social information. However, this information takes the form of social patterns, not cues. In this case, the social cues in
BodyChat are displays that signal certain behaviors and generally
have expected responses from other people. The social patterns
in Coterie, on the other hand, are comprehensible arrangements of
people or behaviors that display information about those people, and generally have standard interpretations to outside viewers. There is also a difference of perspective: Cues are signals between two or more
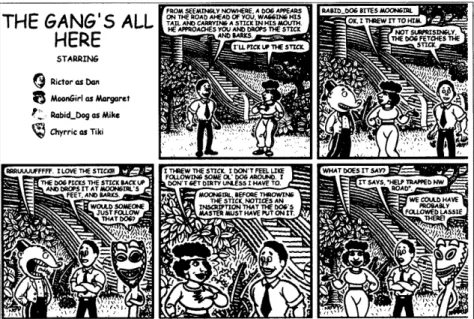
Figure 6 Comic Chat. F1OM SIEMI WHEE.A DOG RABIDDOGTMOONTE
Comic Chat automatically
THE
GANG
S
ALL
creates a visualization of
HERE
ICK HST TIE HETI HEIRC based on a comic STARRING
book metaphor. Users are Ric,,r an
represented by 1 MooGras rWet
two-dimensional avatars of 0"- Rabd as Mike,
their choice, and can pose the avatars using a simple interface.
RRRUUUUFFFFF. I LOVE THE STICKI STICK. ION'TFEELLIKE W O T SA
THE DOG PICKS THE STICK BACK UP T DIRTY S HELP TRAPPED NW
AND DROPS IT A T MOONIRAL'S RA"
FEET. AND BARKS. MOONRL. BEFORE THGOWING WOUD SOMEONE INSCRIPTION THAT THE DOG S
JUST FOLLOW MASTER MUST HAVE PUT ON IT
THA T bOG? HR I
people, whereas patterns are signals recognized by an observer from a distance. These patterns are tracked by collecting statistical infor-mation about each user's activity, and this inforinfor-mation is then used to create each user's representation, as well as to determine the overall layout of users within the channel. As a result, Coterie provides less information about conversational turn taking, instead presenting the viewer with information about individual and channel level activity and historical performance.
Comic Chat, like Coterie, provides a visualization of IRC. As shown
in Figure 6, Comic Chat allows users to interact through the text chat interface, and automatically assembles comic book-like displays of the chat. Comic Chat provides very stylized two-dimensional
represen-tations, and gives users the ability to pose the avatars or allow the system to choose an appropriate pose. Like BodyiChat, this system is
intended to allow users to chat without having to constantly control their avatar:
A second problem with current graphical chat pro-grams is the requirement that participants must spend a significant amount of time doing things other than chatting. Most graphical chat programs require that participants navigate the room (or world), looking for an interesting conversation. (Kurlander, Skelly, and Salesin, 1996)
Coterie and Comic Chat, and to a lesser extent BodyChat, all address
this issue.
Comic Chat's display is based on a comic book layout. As a result, the
visual representation of the channel is very stylized and rigid. Due to space constraints, each panel only shows only a handful of users, and leaves out any user not currently participating in the chat. To form conversation groups in this interface, users either have to prefix their messages with another user's name (a technique that is used in IRC already to personally address messages, and one that Coterie makes use of as well), or they must explicitly click on a target user within
the Comic Chat interface. Since there are at most only about five users
in any frame, Comic Chat's conversation grouping can only repre-sent small conversation groups or small parts of larger conversation groups. Coterie uses a more sophisticated model that can group all conversation participants together simultaneously.
The nature of Comic Chat's display does create an easily readable his-tory of a chat, and it provides a view of the hishis-tory of the channel that can be scanned and understood quickly. The comic form,
how-ever, can introduce misinterpretations of conversations. The stylized form of the avatars can make all conversations appear amusing, even though the text of the conversation doesn't match that tone. By dis-playing only a few of the currently active users in each frame, the context of the conversation, as well as the size of the conversation groups, can also be obscured. The relative time-course for conver-sations in Comic Chat is similarly destroyed by segmenting them into panels. While a viewer can still tell that one message came after another message, the amount of time that elapsed between the two messages is not shown, which can make rapid conversations indistin-guishable from slower ones.
Coterie takes a different approach from Comic Chat by producing a
view that is more abstract, as well as inclusive of all of the members of a channel. As a result, user activity can be contextualized based on how other users are acting. Furthermore, since chat messages
in Coterie maintain their time component, viewers can more easily
follow the time course for a conversation.
3 Coterie's Evolution
3.1 Dynamics in a Real World Social Space
The visualization used in Coterie was first developed in the fall of 1998 as a way to visualize how people were interacting with each other in a real world space. The visualization displays a virtual represen-tation of the Media Lab atrium during a sponsor event, where pro-fessionals, students, and professors socialize with each other, using information about where each person is within the real world space. The system discovers who is interacting with whom and how each person moves within the atrium over the course of the event. The visualization then categorizes each person based on different charac-teristics, such as research affiliation, gender, or age. To understand how this relatively diverse group of people move into and out of
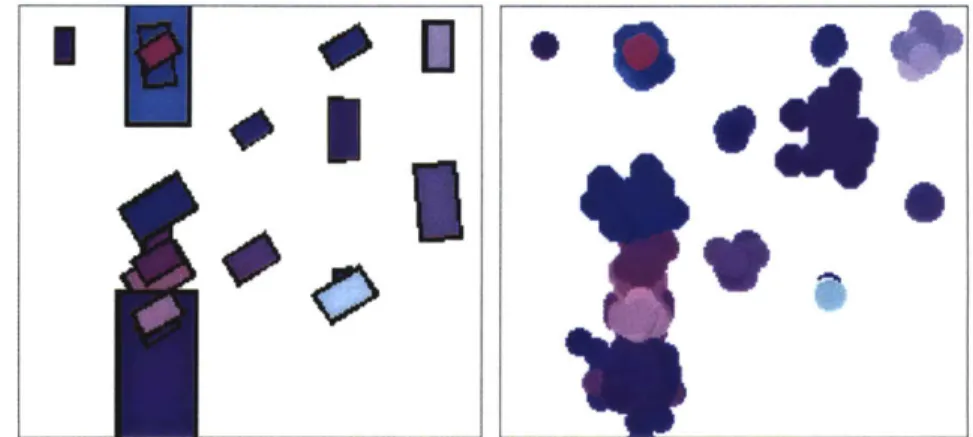
Figure 7 Visualization of
Real World Interaction. In these displays, people are
represented by colored ovals that follow their motion through the Media
Lab atrium. (a) and (b)
show two different sets of people, NIF and TTT
sponsors, respectively. (c)
shows three sets of people
within the room: NIF, TTT,
and DL (Digital Life, in red). In (d), the groups each have transparency, so people in the background can be seen.
b)
d)
groups as well as how each set of people differ in how they interact-for example, students might be a more insular group than profession-als-the interface shown in Figure 7 was designed.
In this visualization, each person is displayed as an oval that tracks on screen the person's real world location. The perspective of the display is a % view: The viewer sees the crowd from an elevated platform, maintaining the impression that he is watching a group of people, but allowing him to see into the crowd more easily. (In this case, though a bird's eye view would provide an unoccluded view, it is a very unnatural viewpoint for people-watching.) Each set of people is given a hue: the people affiliated with the News in the Future (NIF) research consortium are green, for example, and people affili-ated with the Things That Think (TTT) research consortium are blue. The saturation of each oval carries information about the cor-responding person, such as how long they have been at the Media Lab.
Showing only one set of people on the display, as in Figures 6a and 6b, allows the viewer to see how that set of people moves around in
the space, and shows correlations between certain sets of people and different levels and types of interactions, as present in the raw data. A viewer might notice, for example, how saturated ovals interacted with non-saturated ovals, thus showing how a longer affiliation with the Media Lab affects personal interaction among Lab sponsors. Dif-ferent sets of people can be overlaid on the display, such as in Figure 6c. This visualization would emphasize differences between sponsor groups. For example, TTT people might interact predominantly with other TTT people, while NIF people might interact mainly with people outside of the research group. Since some people in the display are blocked by other people, the transparency of each set of people can be adjusted, as shown in Figure 6d.
3.2 Multidimensional Abstract Displays of People
During the spring of 1999, while working on this visualization of real world interactions, development began on qualitative displays of information that encoded multiple data about a set of people. To explore this idea, PainterlyVisualization was designed, which is a program that visualizes multiple types of data in an abstract way. Figure 8 shows two screen captures of the display. About 25 people filled out a questionnaire, providing raw data, such as age, gender, and number of years affiliated with the Media Lab. This visualiza-tion paints a portrait of the group of people as represented in the data. Each person is represented by a different object, and the differ-ent dimensions of that object are bound to data about that person (as shown in Figure 9).
Figure 8
PainterlyVisualization. Data
about a set of people is painted on screen in an abstract manner. In these
displays, position, hue,
saturation, and brightness can be bound to data
about each person.
Rotation and clustering are also available dimensions.
While the data itself are quantitative, what is important in this dis-play is the qualitative representation of each person. This is a key concept that is present throughout the work presented in this thesis. In real life, when we look at someone, we do not necessarily know their exact age, or other exact information about them. What we can see are general qualities about them: their race, how young or old they are, or the type of clothes they are dressed in. The quantitative measures, such as their exact ages, are not important. What are important are the qualitative things we can know
Data Visual Dimension of Stroke
qualities relate to everyone
sur-Number of siblings Horizontal location
Room number in building Vertical location
Age Size alization and one of the driving
Soda Preference Rotation
(left = Pepsi, right = Coca-Cola,
center = neither) tion. Though the measures that
Media Lab group affiliation Hue are made about people do deal
Years at Media Lab Saturation (or variation of with numbers, when this data are
saturation for dot view)
presented visually, one of the best
Number of countries visited Coherency of dots
Figure 9 Data Bindings in PainterlyVisualization
ways we can understand the social patterns within the data is by cre-ating visualizations that emphasize qualitatively how one person is similar or different from another, and how one group of people relates to another group of people.
In PainterlyVisualization, there are four classes of data representation that build upon human abilities to distinguish different visual dimen-sions: relation to environment, relation to others, categorization, and
intensity. These classifications are discussed in an unpublished paper
called "PainterlyVisualization: Using Abstract Painting Techniques to Visualize Social Data" (Spiegel, 1999). This paper outlines these four classes of visual dimensions, and discuss the types of data that are best represented using these dimensions. Unfortunately, in Paint-erlyVisualization the relationship between the people and their repre-sentations on screen is too abstract and disconnected to be intuitively meaningful. Coterie, in its current form, addresses this issue, so that each user's representation appears as a close and individual reflection of the person it is portraying.
3.3 Initial Implementation of Coterie
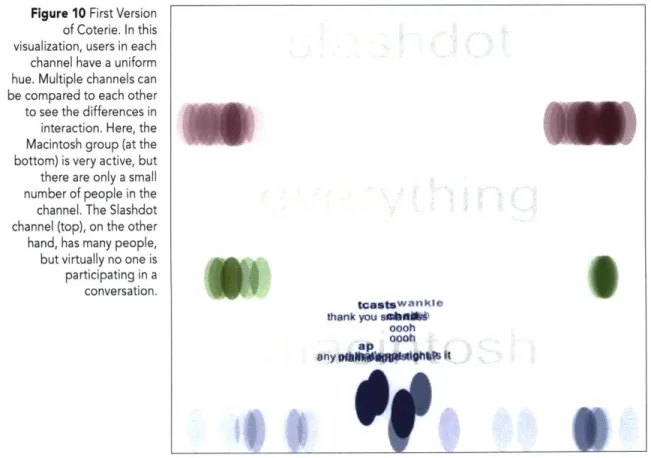
Research into real-time text chat systems began during the winter and spring of 2000. The first version of Coterie was built to under-stand how users interacted online, and to see the dynamics of those interactions in the same way that the dynamics of people interacting in the real world were seen. Coterie as shown in Figure 10, was designed using the visualization of the dynamics of a real world space, along with techniques from PainterlyVisualization.
NNOWNk-In this first version, Coterie represents each user as an oval and gath-ers statistics about how they interacted within an IRC channel.
Cote-rie also collects channel level data, such as turnover in membership.
This statistical information is then mapped into an oval's size, bright-ness, and saturation. This version of Coterie uses a simple gravity model that causes anyone that posts a message to bounce into the center of the display. Each channel is given a hue, and everyone in that channel appears in the same color, though with different satura-tion, brightness, and transparency. In this version of Coterie, most users appear as anonymous ovals.
Figure 10 First Version
of Coterie. In this visualization, users in each channel have a uniform hue. Multiple channels can be compared to each other to see the differences in
interaction. Here, the
Macintosh group (at the bottom) is very active, but there are only a small number of people in the channel. The Slashdot channel (top), on the other hand, has many people, but virtually no one is
participating in a
conversation. W
0
This visualization was built to allow comparisons between different channels in IRC. Coterie incorporates channel level data into the dis-play by mapping these statistics into changes in the overall appear-ance of the channel. For example, a channel where a large percentage of people are talking is shown as having a narrower distribution of ovals than one where most users are just lurking. In many cases, the particular patterns are emergent from the mappings of individ-ual statistics into particular visindivid-ual dimensions. By showing multiple channels next to each other differences in the activity levels of these channels is readily apparent. Figure 9 shows three different channels; the Slashdot channel has many users who appear to be lurkers, the Everything channel has fewer users, but still many lurkers, and the Macintosh channel has fewer people still, but most of them show a high level of activity. This comparison reveals the different interac-tion patterns within each channel, and provides context for relating the activity level of each channel to the group of channels as a whole.
3.4 Coterie Revisited
Coterie was further developed and refined during the spring and
summer of 2001. During these months, it became clear that grouping all of the active users into the center of the display was not sufficient for creating an intuitive display of chat activity in IRC. The visual-ization also had to separate out the different conversations, so that the groupings of people represented separate conversation groups.
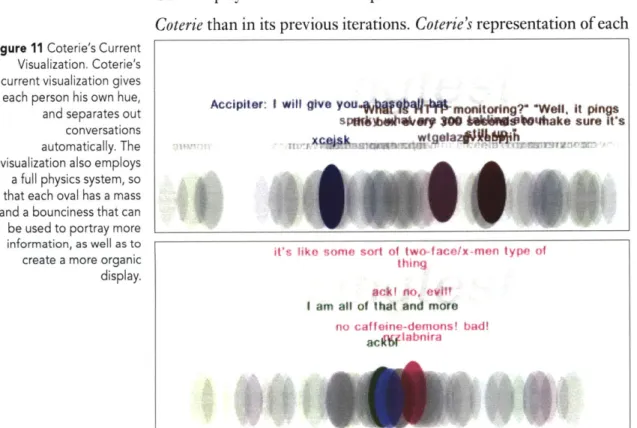
Figure 11 Coterie's Current
Visualization. Coterie's current visualization gives each person his own hue, and separates out conversations automatically. The visualization also employs a full physics system, so that each oval has a mass and a bounciness that can be used to portray more information, as well as to create a more organic display.
discussed in Chapter 7, which introduces meaningful spatiality into the visualization and creates a more understandable display.
This evolution of Coterie also introduces more dimensions onto which the system can map richer sets of interaction data. A full physics system allows mass and bounciness to portray information, and each is now represented in his own hue, to create more identity in indi-vidual representation. Long- and short-term motion and dimension change are used to portray long- and short-term statistics. As a result, the display is more lively and more readable, and each user appears more as an individual when he is active within the channel, while still fading into the crowd when he is lurking.
Context plays an even more important role in the current version of
Coterie than in its previous iterations. Coterie's representation of each
Accipiter: I will give you"$d@ $ Aj monitoring?" "Well, It pings
spUi**1evwb 300 iskWagbouhake sure It's
it's like some sort of two-f ace/x-men type of thing
ack no, evil? I am all of that and more
no caffeine-demons! bad!
ac(Iglabnira
$
user can be compared and contrasted to those of other users in the channel, as well as to a visual average of the channel as a whole. As a result, viewers can see that the activity level of one user in a chat where everyone is active is visually different from the appearance of a user with the same activity level in a channel where there is no one else chatting.
Coterie and its predecessors have always centered upon displaying the
patterns of dynamics and activity in social interaction. The evolution of the visualization is based on observing and researching how real world socialization works, and then bringing those techniques and ideas over into the domain of online interaction. The result is a visu-alization that is similar to the real world appearance of people inter-acting, and thus builds on our ability to visually understand social
4
Statistical Model of
Chat Activity
4.1 Real World Social Measures
Real world social interaction is second nature. When we gather to socialize and talk, our actions, on both an individual and a group level, are understood automatically. By watching a set of people inter-act and converse, an observer can easily see the conversation groups that form and disperse, can see who the active and inactive people in the groups are, and figure out, to a certain extent, the social dynamic within those groups. I will refer to this ability throughout this thesis as "reading" a group.
This ability to read a group of people is implicit to our understand-ing of human interaction. Though it may be easy to say that a partic-ular set of people form a conversation group and that group is tightly
Statistical Model of Chat Activitiy
knit, objectively, these are qualitative judgments based on a number of underlying assumptions as to how those people interact with one another.
To make this quantification process more explicit, the fields of sociol-ogy, sociometry, and social psychology have devised certain measures of small group interaction. (Though these measures are only a partial list of ways to describe how people interact, and though researchers don't fully agree on exactly what these measures are and what they mean, they nonetheless form a useful model for understanding group interaction.) By using these real-world models, a preliminary model for interaction on IRC can be devised that defines interesting and pertinent measures for keeping track of social activity.
Hemphill and Westie were the some of the first researchers to sci-entifically study the dimensions of groups. In their 1950 study titled "The Measurements of Group Dimensions," they describe fourteen measurable characteristics of group behavior (Hemphill and Westie, 1950). Borgatta et al. explain these dimensions in their critique "On the Dimensions of Group Behavior" (Borgatta, Cottrell, and Meyer,
1956):
Autonomy is the degree to which a group functions
independently of other groups.
Control is the degree to which a group regulates the
behavior of group members.
Flexibility is the degree to which a group's activities
are marked by informal procedures rather than by adherence to rigidly structured procedures.
Hedonic Tone is the degree to which group participa-tion is accompanied by a general feeling of pleasant-ness or agreeablepleasant-ness.
Homogeneity is the degree to which members of a group possess similar characteristics.
Intimacy is the degree to which members of a group are familiar with the personal details of one another's lives.
Participation is the degree to which members of a group apply time and effort to group activities. Permeability is the degree to which a group permits ready access to membership.
Polarization is the degree to which a group is ori-ented and works towards a single goal which is clear and specific to all members.
Potency is the degree to which a group has signifi-cance for its members.
Size is the number of members of the group.
Stability is the degree to which a group persists over a period of time with essentially the same character-istics.
Stratification is the degree to which a group orders its members into status hierarchies.
Viscidity is the degree to which members of the group function as a unit.
Almost all of the fourteen measures above seem to be applicable to purely social groups. The one characteristic that does not seem to
fit-polarization-can be rephrased for use within this particular
domain of study. In place of working towards a single clear and specific goal, we might describe polarization as the degree to which a group maintains the conversation on the topic of the chat. We can also define
a new measure, cohesiveness, which describes how well users stay
within their particular conversation groups. Also, it is important to
dis-tinguish polarization from viscidity. The former describes how the group interacts with itself internally, while the latter measures how the group interacts with its surroundings, including other groups. In a later work, Cattell defines three general classes of measures of group and individual behavior. These three classes-population variables, structural variables, and syntality (meaning the personality of the group) variables-would seem to cover all of the measures we can make about a group and the individuals that belong to it:
Population variables or dimensions are merely means
(or other statistical parameters) ofthe measured charac-teristics of the component individuals, such as the mean
I.Q, mean structure, etc., of the component mem-bers. These are clearly distinct from the character-istics of the group as a group, which arise by inter-action, for they can be measured in the individuals before they become a group. By structural variables or dimensions we mean the descriptions of the inter-nal behavior of the group, such as the status gradi-ents, the clique relations as revealed by sociometry, the reciprocal role relations, the form of leadership structure, and, in organized groups, what Stogdill has called "the sociometry of working relations in formal organizations." These are inferred from obser-vations on the internal interactions, processes, and procedures of the group and they are often quite high
level abstractions involving such complex concepts as status and leadership structure. The third category comprises the true syntality variables, which repre-sent the performances of the group acting as a whole and commonly through its executive, e.g., its decision in a committee-like situation, its constructive perfor-mance on a building task or its acts of aggression or assistance towards other groups. (Cattell, 1951)
Cattell makes no qualification as to how important each of these classes of variables are to the description of a group; such a rating is dependent upon the types of questions or goals we have about a particular group.
4.2 Online Social Measures
In IRC, we cannot read the interactions of a group of people in a channel. We can still see the interactions: we can read what people write as they post it, and we can mentally follow conversations by keeping track of who is talking to whom. But the whole process is based on a mental model of the group that must be carefully main-tained with very little visual input.
Coterie makes this modelling process explicit. Using only a user's post to a channel, Coterie extracts information about how and with whom a user is interacting, as well as information about the group as a whole. By collecting statistics about how every user in a channel is interacting, Coterie builds a statistical model for that person as well as for the channel as a whole. This information is passed along to the visualization system and the conversation finder (discussed in
ters 6 and 7, respectively), in order to create a readable display for IRC.
The particular statistics that Coterie gathers for individuals and groups fall generally into the categories of population variables and
structural variables as described by Cattell. While Hemphill and
Westie's dimensions of group measurement are well defined for real-world groups and are qualitatively easy for real-real-world researchers to measure, they are difficult to
Statsti Desripionmeasure and keep track of
algo-Number of users Number of users in the channel
rithmically. Still, they represent a
Last join time Most recent time a user has level of thoroughness and
mean-joined this channel
Last leave time Most recent time a user has left ngfulness that their online
ana-this channel logues should attempt to reach.
Join rate Percentage of people per Coterie's particular measurements,
second that have joined this
group in the last hour though simpler and easier to
Part rate Percentage of people per gather automatically by computer,
second that have left this group
in the last hour were chosen as a first step in this Last message length Length of the most recently direction.
posted message
Average message length Average length of messages Whenever a message is posted to
posted over the last hour the IRC channel to which Coterie
Message post rate Number of messages posted to is subscribed, the internal IRC
this channel per second over the
last hour client passes this message to
Cote-Percentage of talkers Percentage of users in this opes statistical database. These
channel that have posted a
message in the last hour statistics, for both individuals and
User growth rate Rate at which users have joined the channel as a whole, are shown
or left this group over the last in Figures 12 and 13.
It is important, at this point, to provide some justification for the
par-ticular choice of statistics that Coterie measure. Coterie's visualization
should provide a display of the group structure of a channel (which includes relationships between individuals). Cattell describes group structure as the "patterns of interactions of individuals, out of which,
by analysis, group traditions, roles, association patterns, hierarchies,
cliques, status dimensions, etc. are inferred as constructs" (Cattell,
1966) To this end, Coterie attempts to user statistics that describe
the channel as a group such that the patterns of interactions become visible. There are, unfortunately, no specific group variables to bring to bear upon this issue of interaction measurement; the exact
Statistic Description choice of dimensions is therefore
Last join time Most recent time this user has non-exhaustive, though
represen-joined this channel tative of the classes of
measure-Last leave time Most recent time this user has ment that Cattell describes. To
left this channel
ha large extent, the motivation of
Join rate Number of times per second measurement the exact
this user has joined this channel
in the last hour based upon the ability to
visual-Part rate Number of times per second ize those dimensions within the
this user has left this channel in
the last hour model of visual group structure
Last message length Length of the last message this as described in Section 6.3.
user has posted
Average message length Average length of messages this These chosen variables, upon
eval-user has posted over the last
hour uation within the context of the
Message post rate Number of messages this user visualization, seem to describe to
has posted per second over the alreeog xettebhv
lasta largeeo extent motiv a
v-Last Message lime Last time this user posted aa
message
Figure 13 Individual User Statistics.
an IRC channel such that interesting and relevant (according to Cat-tell) social patterns emerge. Coterie, in part, is performing a process that is the reverse of the process that sociometrists perform. Instead of measuring group and individual performance for the sake of eval-uation of group characteristics, Coterie instead creates the visible social patterns that would lead to this measurement by sociometrists. The statistical model of interaction within Coterie is therefore tightly linked to its visualization.
By visualizing these measurements of social interaction, Coterie cre-ates a display where the social patterns emerge visually. Questions such as "How talkative is a channel?" or "How many conversations do users within the group participate in?" can be answered by view-ing the visualization, instead of by readview-ing numbers from a chart. This has the possibility to make the display of this information more meaningful to the viewer, since they possibly relate more closely to the lively display than to raw numbers. The relations between sta-tistics also have the ability to combine visually to provide higher-level descriptions. For example, a channel that has few users, each of whom are actively participating within and moving between conver-sations, can be said to be a cohesive, interactive, and tightly knit com-munity, a description that is easily seen visually without understand-ing or readunderstand-ing the basic underlyunderstand-ing measurements that create such a
display.
The statistics do not take into account interpersonal interactions, such as how many times a user mentions another user's name. Such statistics would add to the richness of the description of the
chan-nel, and could be used to portray more conversational information. In this example, users who talk to each other frequently could acquire some of the other's visual characteristics, a display that is suggested elsewhere (Lee, 2001). The social patterns that Coterie can display are limited by the statistics that are collected, as well as the visualiza-tion of those statistics.
All of these measures have a time component (with the exception of last message length). This time component is very important: Just like real world social interaction, online social interaction is dynamic. As such, the results of these measures are expected to change over time. A user might leave his computer or become disinterested in the conversation for a time, which should cause his message post rate to go down. Taken as a whole, a channel's interaction changes over time as well. Around meal times, there is usually a drop in interaction as some of the users (those who live in a time zone that is currently eating dinner, for example) stop posting messages.
To accommodate the dynamic nature of the interactions in IRC, and to gather timely and pertinent measurements for those interactions, the time-based statistics use a history window. Coterie uses a window of one hour, which means that it includes in its statistical analysis any message that was posted within that time.
It is important to choose an appropriate window size so that changes in the statistical model happen at an understandable rate. If the his-tory window was small, then the measures would change too rapidly; a user who stopped posting for a few minutes would have the same
post rate as one that stopped over an hour ago. The opposite would occur if the history window was big; a user that posted this morning would have the same post rate as one who stopped posting 10 min-utes ago. With a one-hour time window, a user that stopped posting an hour ago might appear statistically like one that stopped posting 10 hours ago, but would appear different from one that stopped five minutes ago. This characteristic is in line with the time-course for IRC interaction.
4.3 Higher-level Descriptions of Online Social Interaction
In real life, we can keep track of a person's interaction in a group by watching him. Each person will signal his activity through body language, movement, speech, and inflection. For example, someone who stands off to the side of a group, only occasionally attending to what is being said by other conversants, has a low level of activity and involvement in that conversation. Alternatively, a person who is attentive and always responds to what others are saying has a high activity level, and is very involved in the conversation. These types of qualitative measures are of the type suggested by Hemphill and Westie.
Within Coterie, the low-level measures discussed in Section 4.2 can be used to derive similar types of qualitative measures as in real life. On a channel level, the interactiveness of the group can be defined by the percentage of posters. A channel that has a high percentage of users who post can be seen as highly interactive, whereas one in which only a small percentage of people post might be seen as
non-interactive. The user join rate and user part rate of a channel is a mea-sure for how cohesive that channel is: if these meamea-sures are low, the channel tends to keep its users. This is one way to define group cohe-sion. The size of a group can be mapped directly into this higher-level description for a channel.
Statistics about individuals can be used in the same way. A user's activity level is directly related to his message post rate, and his ver-bosity to his average message length. In this way, both user and group level statistics can be used to achieve Hemphill and Westie's level descriptions of the group interaction. These qualitative, higher-level patterns are portrayed by Coterie's visualization through its use of mappings between particular statistics and specific visual dimen-sions (discussed in Chapter 6). Since Coterie's statistical model of IRC is based upon an already internalized model for real-world social interaction, the patterns that emerge from the visualization can be easily understood.