HAL Id: hal-00311374
https://hal.archives-ouvertes.fr/hal-00311374
Submitted on 14 Aug 2008
HAL is a multi-disciplinary open access archive for the deposit and dissemination of sci-entific research documents, whether they are pub-lished or not. The documents may come from teaching and research institutions in France or abroad, or from public or private research centers.
L’archive ouverte pluridisciplinaire HAL, est destinée au dépôt et à la diffusion de documents scientifiques de niveau recherche, publiés ou non, émanant des établissements d’enseignement et de recherche français ou étrangers, des laboratoires publics ou privés.
Electron Microscopy Investigation of Magnetization
Process in Thin Foils and Nanostructures
Aurélien Masseboeuf, Fabien Cheynis, Jean-Christophe Toussaint, Olivier
Fruchart, Christophe Gatel, Alain Marty, Pascale Bayle-Guillemaud
To cite this version:
Aurélien Masseboeuf, Fabien Cheynis, Jean-Christophe Toussaint, Olivier Fruchart, Christophe Gatel, et al.. Electron Microscopy Investigation of Magnetization Process in Thin Foils and Nanostructures. Materials Research Society Symposia Proceedings, 2007, 1026, pp.1026-C22-04. �10.1557/PROC-1026-C22-04�. �hal-00311374�
Electron Microscopy Investigation of Magnetization Process in Thin Foils and Nanostructures
Aurelien Masseboeuf1, Fabien Cheynis2, Jean-Christophe Toussaint2, Olivier Fruchart2, Christophe Gatel1,3, Alain Marty1, and Pascale Bayle-Guillemaud1
1
INAC/SP2M, CEA Grenoble, 17 rue des martyrs, Grenoble Cedex 9, 38054, France
2
Institut Neel/MNM, CNRS, Building D, BP166, F-38042 Grenoble Cedex 9, Grenoble, France
3
CEMES-UPR 8011, CNRS, BP 94347 - 29, rue Jeanne Marvig, Toulouse Cedex, 31055, France
ABSTRACT
This paper presents an investigation of magnetization configuration evolution during in-situ magnetic processes, in materials exhibiting planar and perpendicular magnetic anisotropy. Transmission electron microscopy (TEM) has been used to perform magnetic imaging. Fresnel contrast in Lorentz Transmission Electron Microscopy (LTEM), phase retrieval methods such as Transport of Intensity Equation (TIE) solving and electron holography have all been implemented. These techniques are sensitive to magnetic induction perpendicular to the electron beam, allowing the mapping of magnetic induction distribution with a spatial resolution better than 10nm and can be extended to allow dynamical studies during in-situ observation. Thin foils of FePd alloys with a strong perpendicular magnetic anisotropy (PMA) and self-assembled Fe dots have been examined. Both are studied during magnetization processes, exhibiting the capacities of in-situ magnetic imaging in a TEM.
INTRODUCTION
Magnetic imaging in the TEM [1] has been improved during the last decade with the development of new induction mapping techniques such as Transport of Intensity Equation (TIE) solving [2] from Fresnel images. Also, improvements in electron holography [3] have allowed the technique to become a common way to observe magnetic induction distributions at a very fine scale. Nevertheless, to achieve quantitative phase reconstruction, this technique requires specialist equipment, such as a biprism and a field emission gun (FEG) source to be used in conjunction with special sample preparation geometries (known thickness and a hole for reference beam). Other mapping techniques obtained from Lorentz TEM (LTEM) by TIE solving or Differential Phase Contrast [4], can use conventional samples for the analysis but have to overcome several artifacts to become truly quantitative. For all these techniques, the interest is to be able to perform in-situ magnetization processes using the objective lens to apply an axial field.
In this paper, we describe in-situ magnetization studies of two kinds of material with different sample geometries. The first section deals with the investigation by electron holography and LTEM of a continuous magnetic layer observed in plan view and cross-sectional orientation. This thin foil is a bi-layer of bi-metallic FePd alloys : a chemically-disordered soft underlayer with vanishing anisotropy and a chemically-ordered L10 FePd exhibiting a strong perpendicular
magnetic anisotropy (PMA) grown on top. This system is potentially a good candidate for a new perpendicular storage hard drive or for logical magnetic systems. In-situ magnetization experiments are therefore of great interest to understand the saturation processes in these films. In the second section, we present a study of local magnetic induction distribution in iron dot nanostructures which have nanoscale dimensions and display a flux-closure configuration at remanent state. The focus here is on the switching process of the central magnetic wall found in the dots. The experimental observations are presented alongside 2D and 3D micro-magnetic simulations and simulated Fresnel images.
EXPERIMENT
Two samples (A for plan view & B for cross-sectional view) were used in the characterization of the FePd thin films. Both were grown on MgO (001) substrates by Molecular Beam Epitaxy (MBE). For sample A, an ultra thin seed Fe layer (2ML) was initially deposited, whereas for sample B, a Cr seed layer (2nm) followed by a Pd buffer layer (48nm) were grown and annealed at 500°C to obtain a smooth surface. In both cases, a 15 nm chemically-disordered layer of FePd2 was first deposited at 450°C, as a magnetic layer with weak anisotropy. Following
this, a Pd ordered (L10) layer, 37nm thick, was grown at 450 °C, exhibiting a strong
perpendicular anisotropy [5]. Both films were then covered by a 1.5 nm Pt capping layer in order to avoid oxidation. Magnetic properties, including MFM observations of similar samples can be found elsewhere [5]. 2D micro-magnetic modeling of this magnetic staking, calculated using GL_FFT [6] has been performed, with the following input parameters : exchange constant A = 6.9 10-12 J.m-1, uniaxial anisotropy for the hard layer K = 1.03 106 J.m-3, saturation magnetization µ0MS = 1.294 T. The cells are prisms with a rectangular basis 0.781nm x 0.625 nm and are
infinite along an in-plane direction. The second system consists of Fe dots epitaxially-grown using UHV-Pulsed-Laser Deposition (PLD) on Sapphire (1120) wafers. A 10-nm thick W buffer layer was used at the initial stage of epitaxy and a 5-nm W capping layer was used to avoid oxidation. GL_FFT was also used for a 3D simulation of the magnetization distribution inside the dots using the following parameters: A = 2 10-11 J.m-1, K = 4.81 104 J.m-3 (bulk value), µ0MS
= 2.2 T, cells are 6.25 x 6.25 x 7.81 nm. For all the samples, thin lamellae for electron microscopy characterization were obtained by conventional mechanical polishing, followed by low angle Ar ion milling. Two microscopes were used for the observations: a Jeol 3010 and a FEI Titan. Both microscopes were operated at 300kV and both are equipped with a Gatan Imaging Filter for zero-loss filtering. The imaging lenses used were the objective minilens on the Jeol microscope and a dedicated Lorentz lens on the FEI-Titan. The in-situ magnetization experiments have been carried out on the Jeol microscope using the objective lens to generate the field. The calibration of the magnetic field at the position of the sample has been initially carried out with a dedicated Hall probe setup. Electron holography has been performed on the FEI-Titan microscope.
DISCUSSION
FePd analysis:
Among the numerous materials considered for the magnetic layers of future hard drives, FePd is one of the best candidates for fundamental magnetic structure analysis. When growth conditions are optimized on MgO (001), the chemically ordered phase, with chemical axis parallel to the growth direction, exhibits strong PMA. The magnetic configuration of the layer is then made of domains with either up or down orientation. The domain walls separating up and down magnetic domains can be described in terms of Néel-capped Bloch walls, wide enough to be resolved by LTEM. This is shown by the micro-magnetic simulation of Figure 1. The bi-layer sample, at the same time, exhibits a significant perpendicular magnetic component (in the L10
layer) and also a significant in-plane component. The in-plane areas are localized in the domain walls of the hard layer (predicted by simulation to be 10 to 15 nm wide) and also in the soft underlayer underneath the perpendicular domains (see Fig 1). This soft layer associated with the Pd buffer in the cross-sectional sample ensures a parallel stripes domain configuration. For the cross sectional analysis, the magnetic domains can be easily aligned as parallel bands by prior magnetic in-plane saturation, and afterwards be observed along these bands. The study in both plan view and cross sectional orientations allows us to get complete information about the
magnetic domain configuration.
The induction distribution maps in the two orientations, obtained using phase retrieval methods, are presented in Fig. 2. The measured phase shift of the electronic wave has a magnetic and an electric component (mean inner potential, MIP). The latter has to be removed to obtain only the magnetic induction distribution. If the sample has a uniform thickness, the phase shift contribution due to an electrical potential is uniform. However, when conventional plan view TEM sample preparation is used, we measure a constant thickness variation, due to low angle ion milling. When calculating the gradient of the phase shift to get the magnetic components Bx and
By, the MIP contribution, which depends linearly of the thickness, should be a constant vector.
The gradient can then be subtracted from the induction map distribution, as has been carried out in Fig. 2A. In Fig. 2, the modulus of the in plane magnetization is represented by greyscale intensity. We can observe the domain configuration as an isotropic distribution where up and down domains are interlaced, separated by domain walls. The magnetization distribution inside the domain walls is highlighted by black arrows. In the cross-sectional sample,
Figure 2 : Induction mapping in the plan-view sample (A) and cross-sectional sample (B). (A) is the modulus
representation of the mapping obtained by TIE solving. Black arrows are following the magnetization in domain walls. White arrows indicate the up/down direction in the domains. The three images in B are vertical magnetization, horizontal magnetization and stray field induction respectively. Magnetization mapping is determined by TIE solving, stray fields are resolved by electron holography and presented as cos(10*Φ).
25 nm -1 0 +1 25 nm Figure 1: Micro-magnetic
simulation of the FePd sample configuration in cross-sectional view. The grayscale represents the component of magnetization perpendicular to the cross section.
FePd (L1
0)
FePd
250 nm
B
A
50 nm
C
D
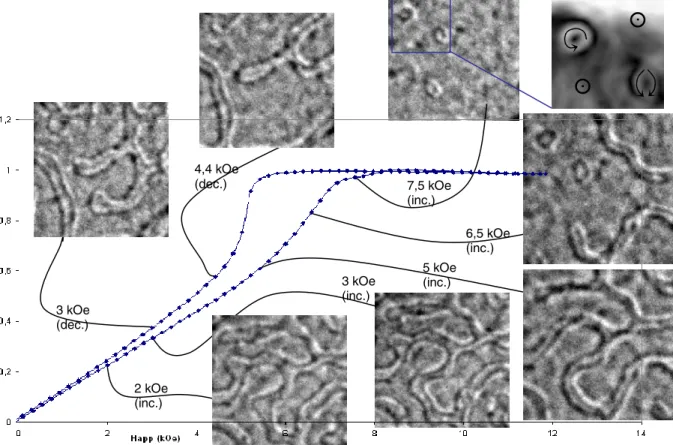
the mean inner potential contribution could not be subtracted because of the too fine scale of the images (the isotropic distribution is although not more true). As a consequence, the images contain some artefacts. It is seen that Fig. 2.B and 2.C, from the cross-sectional sample, show perpendicular and parallel components respectively, obtained using TIE phase reconstruction . Figure 2D shows the stray field in vacuum near the cross sectional sample, resolved by electron holography. Inside the magnetic layer, the domains appear in the perpendicular component distribution and Néel cap around the domain walls appears in the parallel components distribution. The bottom part of Néel cap is more clearly visible because of its enhancement due to the soft layer. An out-of-plane magnetization process on the plan view sample has been performed in order to observe the evolution of the magnetic configuration from the remanent state. Fresnel pictures showing the magnetic state of the foil are presented in Fig. 3, for several values of the applied field. As saturation is reached, minority domains are collapsing. Domains propagate by wall motion, retaining the aspect of the previously formed domains. Just before saturation (see 7.5 kOe in Fig. 3), the only domains belonging to a direction opposite to the applied field exhibit a bubble shape. This shape has been analysed with a magnetization mapping, and the inset of the 7,5 kOe picture shows the modulus of the magnetization (same as Figure 2). We can at this point distinguish two kinds of bubbles: a first one where the magnetization is turning all around the domain without discontinuity, and a second one where two singularities are cutting the domain wall in two parts, with both oriented in parallel directions. It is possible that these singularities are Vertical Bloch Lines (VBL) and are playing a major role in the magnetization process of the film. After complete saturation of the foil, the recovery of the remanent state, as expected with the magnetometry measurement [5], is sudden, and opposite domains appear with large dimensions. From the remanent state to the zero field state, these domains enlarge until they cover half the area of the image, i.e. zero magnetization.
2 kOe (inc.) 3 kOe (inc.) 5 kOe (inc.) 6,5 kOe (inc.) 7,5 kOe (inc.) 4,4 kOe (dec.) 3 kOe (dec.)
Figure 3 : Half-hysteresis cycle of the A sample. All images are 900 x 900 nm. Magnetization states are
presented as Fresnel contrasts images. Pairs of dark/bright lines indicate the domain walls. One map obtained by TIE solving is presented as inset for 7,5kOe. The hysteresis cycle has been obtained by VSM measurements.
Fe dots analysis:
It has been shown that both LTEM and Holography have great potential as techniques for magnetization observation and hysteresis cycle quantification in thin foils. We now present work that shows how LTEM can be applied to nanostructures, even if the electrical contribution is non-uniform and is the dominant contribution to the phase shift. In this case, the action of the mean inner potential on the phase reconstruction has to be analyzed carefully to ensure that it is possible to extract information related to magnetic properties after analysis. Characterization has been carried out on Fe dots with a flat shape and hexagonal base with prism geometry. They exhibit atomically-flat facets that correspond to crystallographic planes. In Fig 4, we present 3D micro-magnetic simulations carried out for self-assembled Fe dots with 0 and 100 mT field applied in-plane, transverse to the dot (along the short edge). The initial configuration (0 mT field) results in two main longitudinal domains separated by a median Bloch wall (with perpendicular magnetization) and Néel caps oriented along the short edge of the dot. At each end of the dot (left and right) the magnetic flux is closed with the occurrence of several Néel walls. One vortex terminates the Bloch wall at each surface of the dot. This 2D domain wall is called an asymmetric wall and can be viewed as a vortex that has been sheared. The main effect of a transverse magnetic field is not to affect the domains but to switch the orientation of the Néel caps from opposite at remanence to parallel around 100mT. In this process, the vortex of the Bloch wall on the top of the dot (or the bottom one, depending on the direction of the field) will move along the wall surface atop the other vortex. This process has been investigated with simulations [7].
Figure 4 : Micro-magnetic simulations and corresponding simulated Fresnel contrasts of a (1000 x 500 x 100 nm)
Fe dot in two different magnetic configurations: before (upper images) and after (lower images) the Néel cap reversal during magnetization. The color scale used in the left simulations is for the z-component, in-plane components are highlighted with white arrows. The same color scale is used for y-component in middle pictures. The Fresnel contrasts are simulated for a 100 µm defocus with a 10°-x axis tilt, adding the magnetic and the mean inner potential contribution to the electron phase shift.
We have used Fresnel imaging to observe the cap switch directly under field. Tilting the sample in the microscope is necessary to apply an in-plane field to the dot. We do not discuss here the influence of the extra perpendicular field, which happens to be only quantitative [8]. In simulated Fresnel images, we can see that the Néel Cap switch should be tracked by the localisation of surfaces vortices, revealed by bright dots (Fig. 4). Magnetic induction mapping has been carried out by TIE solving and is presented in Fig. 5-A. The two vortices described above can be seen by magnetic flux mapping (Fig. 5-B). Experimental Fresnel results coupled with images simulations
Bapp = 100 mT
Bapp = 0
M
z
Simulated Fresnel contrast
x y
z
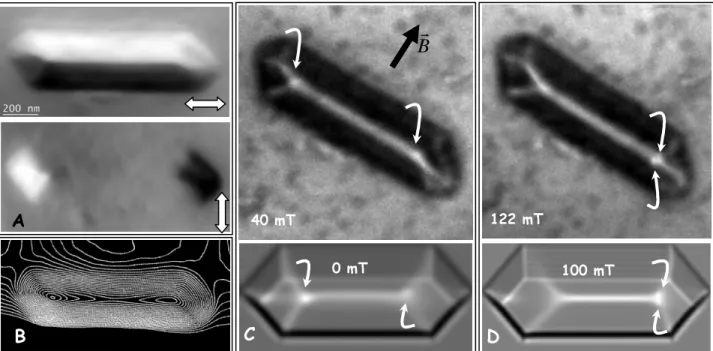
are presented on Fig 5-C and D for two magnetic states during in-plane transverse magnetization. The sample is tilted with 10° around the long axis of the dot. We can observe the evolution of the Bloch wall in the two Fresnel images,. In the first image (C) there is a bright dot at either end of the wall.In the second image (D), a double-spot can be distinguished at the right side of the wall. It is possible that the double spot arises from the top and bottom surface vortices, after the cap switch. The distinction between the two vortices is made visible in the projected view because of the tilt of the sample.
CONCLUSIONS
We have illustrated in this paper the potential of Transmission Electron Microscopy to resolve magnetization processes. Magnetization processes in FePd thin hard/soft bilayer foils have been investigated and related to magnetic defects along the domain walls. Self-assembled Fe dots have also been observed under field, where processes involving switching of Néel caps above a Bloch walls are known to occur from previous studies at remanence. Experimental results from both studies have been validated using micro-magnetic simulations. Spatial resolution better than 10 nm has been obtained in electron holography experiments, and a magnetic sensitivity of few nm.T has been determined.
REFERENCES
1. J.N. Chapman Journal of Physics D : Applied Physics, 17 ( 623-647) 1984 2. M. De Graef et Y. Zhu, Journal of Applied Physics, 89 (7177-7179) 2001 3. A. Tonomura, Electron Holography. Springer, 1999
4. A.C. Daykin et A.K. Petford-Long Ultramicroscopy, 58 (365-380) 1995 5. V. Gehanno et al., Physical Review B, 55 (12552-12555) 1997
6. J.C. Toussaint et al., Computational Materials Science, 24 (175-180) 2002 7. F. Cheynis et al., Journal of Applied Physics, accepted 2007
8. F. Cheynis et al., in preparation
40 mT 122 mT
Br
0 mT 100 mT
A
B C D
Figure 5 : Change of magnetization state in the Fe dots under field, possibly revealing a switch of Néel Cap. Left
images shows the magnetic induction mapping at remanence of the dot obtained by TIE solving (A presents the X and Y component, B is a magnetic flux map, both at 0° tilt and 0 mT field). C & D: The sample is tilted (10°) along its length axis, to apply an in-plane transverse field. The bright line along the dot is the Bloch wall. The vortices described in the text are highlighted with curved white arrows. Simulations of Fresnel contrasts are remembered for two states around the Néel Cap switch.