HAL Id: hal-01272675
https://hal-univ-rennes1.archives-ouvertes.fr/hal-01272675
Submitted on 11 Feb 2016HAL is a multi-disciplinary open access archive for the deposit and dissemination of sci-entific research documents, whether they are pub-lished or not. The documents may come from teaching and research institutions in France or abroad, or from public or private research centers.
L’archive ouverte pluridisciplinaire HAL, est destinée au dépôt et à la diffusion de documents scientifiques de niveau recherche, publiés ou non, émanant des établissements d’enseignement et de recherche français ou étrangers, des laboratoires publics ou privés.
A new lateral method for characterizing the electrical
conductivity of ion-exchange membranes
Youcef Sedkaoui, Anthony Szymczyk, Hakim Lounici, Omar Arous
To cite this version:
Youcef Sedkaoui, Anthony Szymczyk, Hakim Lounici, Omar Arous. A new lateral method for char-acterizing the electrical conductivity of ion-exchange membranes. Journal of Membrane Science, Elsevier, 2016, 507, pp.34-42. �10.1016/j.memsci.2016.02.003�. �hal-01272675�
A new lateral method for characterizing the electrical conductivity of
ion-exchange membranes
Youcef Sedkaoui1, 2, Anthony Szymczyk1*, Hakim Lounici2, Omar Arous3
1Université de Rennes 1, Institut des Sciences Chimiques de Rennes (UMR CNRS 6226), 263
Avenue du Général Leclerc, 35042 Rennes, France
2 National Polytechnic School of Algiers (ENP), 10 Hassen Badi, PO Box 182, El Harrach,
16200 Algiers, Algeria
3 USTHB, Laboratory of Hydrometallurgy and Inorganic Molecular Chemistry, Faculty of
Chemistry, PO Box 32 El Alia, 16111 Algiers, Algeria
*Corresponding author: [email protected]
Abstract
A new method for determining the electrical conductivity of ion-exchange membranes was implemented with four commercial membranes (AMX, CMX, MK-40 and MA-41). It is based on lateral resistance measurements without direct contact between electrodes and membranes. The cell configuration made it possible to determine the membrane conductivity over a wide range of electrolyte concentrations (measurements were carried out in the range 10-5 - 5x10⁻¹ M). The structural parameters of the different membranes were inferred from AC
conductivities and the microheterogeneous model. They were found in good agreement with literature results obtained by normal measurements (i.e. with current lines oriented normally to the membrane surface), thus confirming the reliability of the proposed method. The main advantage of our method is the possibility to characterize ion-exchange membranes even at low salt concentration unlike usual non-contact methods based on normal measurements.
Counterion diffusion coefficients and transport numbers within the membrane gel phase were estimated. The inter-gel phase volume fraction of an anion-exchange membrane (AMX) was also determined for the first time from membrane DC conductivity inferred from streaming potential and streaming current measurements. An excellent agreement was found with structural parameters obtained from AC measurements.
Keywords: Ion-exchange membranes, Electrical conductivity, Lateral measurements,
1. Introduction
Ion-exchange membranes (IEMs) are used in various industrial processes and electrochemical devices such as electrodialysis or fuel cells, respectively. Electrical conductivity is one of the most important characteristics of IEMs that defines their practical suitability. For example, in electrodialysis the electrical potential gradient (driving force) applied through an IEM, and so the specific energy consumption required to operate a given separation, depend on the membrane electrical conductivity. This latter can be determined from electrical resistance measurements. It has been reported, however, that the experimental value of the electrical conductivity may depend on the measuring method [1-7].
The different methods that can be implemented to measure membrane resistance can be split into different categories according to three main criteria, namely (i) the current lines can be oriented normally or parallel to the membrane surface, (ii) electrodes can be in contact with the membrane or not, (iii) direct current (DC) or alternating current (AC) can be used.
Normal measurements performed in both AC and DC modes were reported in the literature. In AC mode, the most used techniques are (i) the difference method in which the membrane resistance is obtained from the difference between the cell resistance measured with and without the membrane [8-24], and (ii) the contact-mercury method [25-33]. The difference method does not allow characterizing IEMs in too dilute solutions since it becomes highly inaccurate as the solution resistance increases too much with respect to that of the membrane (in most reported works measurements were performed with electrolyte concentrations higher than ~0.01 M). On the other hand the contact-mercury method permits, in principle, characterizing IEMs in solutions of any concentration. However, measurement can be impacted by the partial drying (de-swelling) of membrane samples when transferred from the equilibrating solution to the measuring cell and poorly reproducible results were reported with this technique [2].
The use of a highly toxic metal (mercury) is another drawback of this method. Measurements performed in DC mode were also reported from different cell configurations including the Guillou’s cell [1], a six-compartment cell with a four-electrode arrangement [34-36] or a two-compartment cell with a four-electrode arrangement [37]. A major drawback of methods involving DC measurements is the formation of diffusion boundary layers at membrane/solution interfaces, which impacts resistance measurements, particularly at low electrolyte concentration [1].
Electrical resistance measurements performed with lateral configuration were also reported in AC mode [5, 7, 38-43]. Most often, the membrane ends are put in contact with metal foils or wire electrodes (direct contact configuration). It has been argued that in such a configuration conduction may be only superficial and then experimental data may not reflect the membrane bulk conductivity [1].
In the present work we propose a new method to determine IEM electric conductivity over a wide range of electrolyte concentrations. Notably, it enables accurate measurements at low electrolyte concentrations unlike standard methods based on normal measurements. The method is based on lateral measurements performed with a measuring cell without electrode/membrane contact. Measurements were carried out with a commercial electrokinetic analyzer (SurPASS instrument, Anton Paar GmbH) allowing direct resistance measurements in AC mode as well as indirect DC resistance determination from both streaming current and streaming potential measurements. Structural parameters of four commercial IEMs (AMX, CMX, MK-40 and MA-41) were obtained from the microheterogeneous model and further combined with the Donnan exclusion model in order to assess ion transport numbers through the membrane gel phase.
2. Experimental
2.1. Membranes and chemicals
Four commercial IEMs were used in this work, two cation-exchange membranes (CMX Neosepta®, Tokuyama Soda, Japan; MK-40, Shchekinoazot, Russia), and two anion-exchange membranes (AMX Neosepta®, Tokuyama Soda, Japan; MA-41, Shchekinoazot, Russia).
AMX and CMX membranes are homogeneous membranes made of functionalized polystyrene cross-linked with divinylbenzene and mixed with finely powdered poly(vinylchloride) (PVC), which are coated on a PVC cloth used as a reinforcing material.
The membrane fixed-charge comes from the presence of sulfonate groups ( −−SO¿ 3¿
) in CMX
membrane and from the presence of quaternary ammonium groups
+¿
(
C H3)
3 −N¿¿ in AMX
membrane. Both charged groups are grafted directly to the basic polymer structure so that ionic charges are distributed over the whole membrane material.
On the other hand, MA-41 and MK-40 heterogeneous membranes are composite materials made of ion-exchange resins embedded in polyethylene. Ion-exchange resins consist in
functionalized polystyrene (with
+¿(C H3)3
−N¿ groups for MA-41 membrane and
−¿ −SO3¿
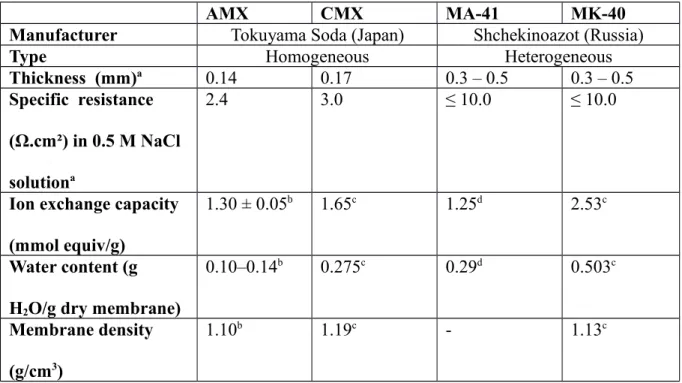
groups for MK-40 membrane) cross-linked with divinylbenzene. The main properties of these IEMs are collected in Table 1.
Electrolyte solutions were prepared from KCl and NaCl (Fisher Scientific, analytical grade) and deionized water (resistivity: 18 MΩ cm). They were further used without pH adjustment (pH was found to be 5.7±0.1 for all solutions).
Table 1. Main properties of AMX, CMX, MA-41 and MK-40 membranes.
AMX CMX MA-41 MK-40
Manufacturer Tokuyama Soda (Japan) Shchekinoazot (Russia)
Type Homogeneous Heterogeneous
Thickness (mm)a 0.14 0.17 0.3 – 0.5 0.3 – 0.5
Specific resistance (Ω.cm²) in 0.5 M NaCl solutiona
2.4 3.0 ≤ 10.0 ≤ 10.0
Ion exchange capacity (mmol equiv/g)
1.30 ± 0.05b 1.65c 1.25d 2.53c
Water content (g H2O/g dry membrane)
0.10–0.14b 0.275c 0.29d 0.503c
Membrane density (g/cm3)
1.10b 1.19c - 1.13c
2.2. Membrane thickness measurement
Membrane thickness was measured with a Dial Indicator (model 2046S, Mitutoyo, Japan) equipped with a 10 mm diameter flat contact point. Membrane samples were first soaked in a highly concentrated NaCl or KCl solution in order to exchange original membrane counterions with Na+ or K+ (CMX and MK-40 membranes) or Cl- (AMX and MA-41
membranes). Samples were further equilibrated with the measuring electrolyte solution at
room temperature (24 ± 1 °C) for 24 h. Samples were then extracted from the solution and thickness was measured. For each sample, seven measurements were performed at different locations and the average value was considered as the membrane thickness (em).
2.3. Electrical resistance measurement
Membrane electrical resistance were measured with a SurPASS electrokinetic analyzer (Anton Paar GmbH, Austria) after thickness measurements.
The cell we used required two samples of the same membrane materials. Each membrane sample was cut and adjusted to the sample holder dimensions (length (L): 2 cm and width (W): 1 cm) and fixed using double-sided adhesive tape. To prevent any leakage between the membranes and the sample holders, the membranes were firmly pressed against sample holders for 30–60 s.
Measurements were conducted with an adjustable-gap cell inside which both membrane samples face each other (see schematic of the measuring cell shown in Fig. 1). Thanks to micrometric screws the distance between the samples (hch) could be set and varied without
dismounting the cell [48]. The cell was surrounded by two cylindrical Ag/AgCl electrodes through which the measuring solution could flow (Fig. 1).
Since membrane swelling was likely to be modified when fixing the membranes onto the sample holders, circulating the measuring solution through the flow-cell enabled recovering equilibrium conditions prior to electrical resistance measurement. The solution flow was
created by a pair of syringe pumps and the resistance was measured in AC mode ( rcellAC¿
by means of the conductivity meter incorporated in the SurPASS instrument and a pair of reversible Ag/AgCl electrodes with surface area of 10 cm2 each.
Fig. 1. Schematic representation of the adjustable-gap cell used for electrical resistance
measurements (adapted from [48]).
The SurPASS electrokinetic analyzer also allows determining the membrane electrical resistance from electrokinetic measurements, which is equivalent to measuring the electrical resistance in DC mode. In this case, the measuring solution is forced through the streaming channel formed by the two membrane samples facing each other (see Fig. 1). The fluid therefore drives ions within the mobile diffuse layer towards the low-pressure side.
This local ion shifting gives rise to a convective current, defined as the streaming current (Is)
that can be measured by the SurPASS instrument (streaming current mode). If a high-impedance voltmeter is put in the external loop, then the accumulation of ions at the channel end sets up an electric field which drives the counter-ions to move back in the opposite direction to the pressure-driven flow. This back-flow of counter-ions generates an electrical conduction current in the opposite direction to the streaming current (not only between the membranes but also through the membranes). When a steady state is reached, the conduction current and the streaming current balance each other. The resulting electrical potential difference that can be measured between the channel ends is defined as the streaming
potential Δφs. The cell electrical resistance in DC mode
r (¿¿cellDC)
¿ can therefore be
inferred from both streaming potential and streaming current measurements by applying Ohm’s law:
rcellDC=Δφs
Is (1)
Both streaming potential and streaming current were measured by applying pressure differences up to 300 mbar. The pair of syringe pumps used to circulate the measuring solution through the cell allowed reversing the flow direction periodically.This helped to limit electrode polarization during electrokinetic measurements [49].
All rcellAC and rcellDC experiments were performed at room temperature (24 ± 1 °C). The
This latter was determined from volume flow rate (Qv) measurements performed at various
pressure difference (P) and the Hagen–Poiseuille equation, which reads as follows for a channel of rectangular cross-section (with W>>hch) [50]:
QV= 2 W
(
hch 2)
3 3 η L Δ P (2) where is the solution viscosity.From the electrical point of view, the measuring cell consists in an electrical circuit with three parallel connected branches, i.e. membrane / solution-filled channel / membrane (Fig. 2). Consequently, it is suited for characterizing IEMs in diluted electrolyte solutions (at low concentrations, the channel resistance is much greater than that of the membrane) unlike most usual cells for which the membrane is surrounded by two (identical) electrolyte solutions thus forming a series circuit.
Fig. 2. (a) Different electrical current paths through the measuring cell; (b) equivalent
electrical circuit; im is the electrical current flowing through each membrane sample, ich is the
electrical current flowing between membranes, rm is the membrane electrical resistance and rch
The cell resistance that is accessible experimentally (rCell) is then related to both the membrane
resistance (rm) and the solution-filled channel resistance (rch) as follows:
1 rCell= 1 rch+ 2 rm (3)
The membrane resistance can therefore be determined from:
rm=2 rchrCell
rch−rCell (4)
where the channel resistance rch is given by:
rch=¿ L W hchκch (5)
with L, W and hch the channel length, width and thickness, respectively, and κch the electrical
conductivity inside the channel. This latter was considered equal to the measuring solution conductivity since the distance between the membranes samples (100 ± 2 µm unless specified) was always several orders of magnitude greater than the Debye length in the measuring solutions.
The membrane conductivity (κm) can be inferred from the membrane resistance as follows:
κm= L
W emrm (6)
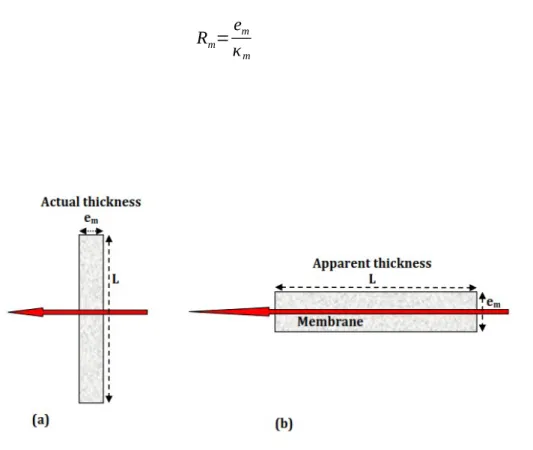
In addition to the electrical conductivity, IEMs are commonly characterized by their specific resistance. The electrical resistance depends on the cell configuration (normal or lateral measurements; see Fig. 3), unlike the membrane conductivity. Although the apparent membrane thickness was L when lateral measurements were performed (see Fig. 3), the specific resistance (Rm) should be computed by considering the actual membrane thickness,
i.e. em:
Rm=em
κm (7)
Fig. 3. Effective membrane thickness for the different cell configurations. a) actual thickness
em in the case of normal measurements, b) apparent thickness L (corresponding actually to the
sample length) in the case of lateral measurements (this configuration was used in the present work).
As mentioned above, electrical resistance measurements were performed in lateral configuration by means of an adjustable-gap cell.
It was then possible to perform a series of measurements by varying the distance hch between
the two membrane samples facing each other in the measuring cell. From Eqs. (3) and (5) it follows that the reciprocal of the cell resistance is expected to vary linearly with hch:
1 rCell =W κch L hch+ 2 rm (8)
Performing measurements for various hch therefore allows determining the membrane
3. Results and discussion
3.1 Validation of lateral measurements
We first demonstrated the reliability of our measurements performed in lateral configuration by comparing the specific resistances of four IEMs reported in the literature with our own measurements. These latter were performed in AC mode with a 0.5 M NaCl solution, which is a standard solution used by IEM membrane manufacturers to characterize their membranes. Specific resistances obtained from our new lateral method were compared with both manufacturer's data and some literature results. All data are collected in Table 2. A very good agreement was obtained between our measurements and manufacturer’s data. Moreover, our results lie in the range of experimental data reported in the literature with different methods based on normal measurements (membrane and measuring solutions in series). This is a strong indication that current lines did flow through the whole membrane matrix during our lateral measurements without contact between membranes and electrodes, and not only along the membrane surfaces. As mentioned above, measurements were carried out with a quite concentrate electrolyte solution (0.5 M NaCl). It should be stressed that lateral measurements are expected to be even more accurate when performed with more dilute solutions because of the parallel association of the membrane samples and the measuring solution (Fig. 2).
Table 2. Specific resistance of AMX, CMX, MK-40 and MA-41 membranes in 0.5 M NaCl. Membrane Rm (Ω.cm²) This work (AC mode) Rm (Ω.cm²) Manufacturer data Rm (Ω.cm²) Literature data
Measurement method Reference
AMX 2.73 ± 0.29 2.4
2.50 DC method,
six-compartment cell with a four-electrode arrangement
[35]
2.65±0.04 DC method,
two-compartment cell with a four-electrode arrangement [37] 3.19 2.6 3.47 3.65±0.01 Difference method with a clip-type cell
[51] [52] [53] [54] CMX 3.04 ± 0.28 3.0 3.45 DC method,
six-compartment cell with a four-electrode arrangement
[35]
3.43±0.16 DC method,
two-compartment cell with a four-electrode arrangement [37] 2.21 3.054 2.98 Difference method
with a clip-type cell [2] [16] [55] MK-40 6.17 ± 0.51 < 10 6.53 7.0 4.69 Difference method
with a clip-type cell [2] [56] [57]
7.5 Mercury-contact
method [56]
MA-41 8.24 ± 0.95 < 10 7.99 Difference method
3.2 Membrane electrical conductivity
Membrane electrical conductivity was determined in KCl solutions of various concentrations ranging from 10-5 to 0.5 M. Fig. 4 shows the variation of the membrane conductivity with KCl
concentration. Overall, the trend of the different curves is similar to that described in literature [1-2, 8-9, 59-66] with a sharp increase in the membrane conductivity observed at low concentrations for all IEMs followed by a less pronounced rise for salt concentrations higher than ca0.01 M (note that most data reported in the literature were obtained for concentrations higher than 0.01 M while our method enables accurate measurements at much lower concentrations). -12 -10 -8 -6 -4 -2 0 -6 -4 -2 0 2 4 AMX MA-41 CMX MK-40 KCl ln c ln m,A C
Fig. 4. Logarithm of membrane conductivity vs. logarithm of electrolyte concentration (KCl
solutions).
Additional measurements were performed by varying the distance between the membrane samples in the lateral measurement cell. Fig. 5 gives an illustration of results obtained with the AMX membrane in a 0.5 M KCl solution.
As expected from Eq. (8) the reciprocal of the cell resistance was found to vary linearly with the distance between the membrane samples. The membrane resistance was then inferred from the y-axis intercept without having to determine the solution conductivity explicitly. The AMX membrane resistance obtained from this extrapolation method was found in good agreement with the value obtained from single-gap measurements (distance between the membrane samples: 100 ± 2 µm) and Eq. (4) as shown in Table 3 (the deviation between the two different methods was about 5%).
0.004 0.005 0.006 0.007 0.008 0.009 0.010 0.011 0.25 0.30 0.35 0.40 0.45 1 /rc e ll , A C , k -1 hc h, c m y = 29 .843 1x + 0.10 39 R2 = 0.99 97
Fig. 5. Reciprocal of the cell resistance vs. gap between membrane samples (hch) in the
lateral-measurement cell (AMX membrane in 0.5 M KCl).
Table 3. AMX membrane resistance measured in 0.5 M KCl by both single-gap and
extrapolation methods.
Method Membrane resistance
rm (kΩ) Membrane specific resistance Rm (Ω.cm2) Single-gap measurement 20.12 2.58 Extrapolation method 19.25 2.46
According to Eq. (8) the solution conductivity inside the channel (κch) can be determined from
the slope of the line shown in Fig. 5. It is worth mentioning that the deviation between κch
determined from Fig. 5 and the experimental solution conductivity (measured outside the cell) was less than 0.3% (κch = 59.68 mS.cm-1 from Fig. 5 and 59.84 mS.cm-1 from direct
measurement), which gives further evidence for the reliability of our measurements performed in lateral configuration.
3.3 Membrane structure and transport properties
The previous sections aimed at validating our new method for IEM characterization. The microheterogeneous model developed by Zabolotsky and Nikonenko [67] was further applied in the present work in order to analyze IEM structure. Hydration of ions and hydrophilic parts of the polymer matrix results in swelling of IEMs, which leads to a substantial reconstruction of their structure [68]. According to the microheterogeneous model, a hydrated IEM can be considered as a combination of two distinct microphases: the gel phase that contains a relatively uniform distribution of ionic groups and counter-ions compensating the fixed charge density, and the inter-gel phase filled with the electroneutral solution [67,69]. The conductivity in the gel phase (1) is due to counterions compensating the membrane
fixed-charge whereas the conductivity of the interstitial solution filling the inter-gel phase (2)
results from both coions and counterions from the measuring solution. In the microheterogeneous model the inter-gel phase conductivity is assumed to be the same as that of the measuring solution, i.e. 2 = ch.
IEM structure is characterized by the gel and inter-gel phase volume fractions referred to as f1
and f2, respectively (f1 +f2 =1). IEMs are usually classified according to the value of f2, namely
homogeneous membranes are characterized by 0 < f2 < 0.15, heterogeneous membranes are
characterized by 0.15 < f2 < 0.25 while membranes are considered as porous if 0.3 < f2 < 0.45
Within the scope of the microheterogeneous model the membrane AC conductivity (m,AC) can
be expressed as follows [67]:
κm , AC=(f1κ1α+f2κ2α)1/ α (9)
where α is a structural parameter reflecting the relative arrangement of the gel and inter-gel
phases ( −1 ≤ α ≤+1 with α=−1 for a series phase connection while α=+1 for a
parallel phase connection).
The isoconductance concentration (ciso) is defined as the electrolyte concentration for which
the membrane conductivity, the gel phase conductivity and the measuring solution conductivity are equal (κm = κ1 = κch = κiso). Isoconductance concentrations (ciso) and
conductivities at the isoconductance point (iso) obtained in the present work for the various
IEMs are given in Table 4. The isoconductance concentration was found around 0.05 mol.L-1
for the different membranes.
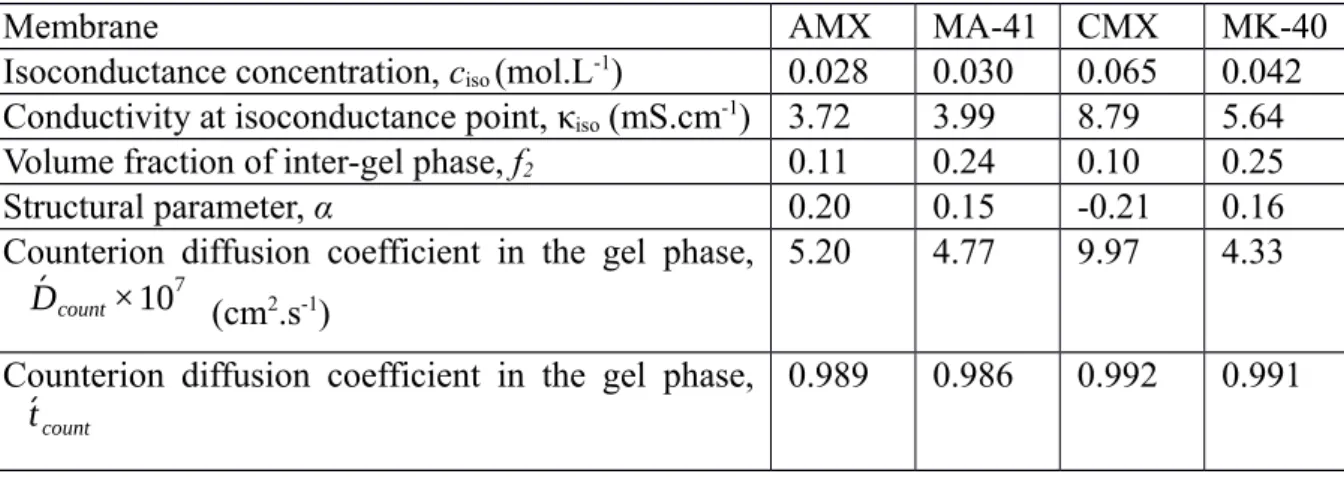
Table 4. IEM parameters determined in the present work from AC resistance lateral
measurements.
Membrane AMX MA-41 CMX MK-40
Isoconductance concentration, ciso (mol.L-1) 0.028 0.030 0.065 0.042
Conductivity at isoconductance point, κiso (mS.cm-1) 3.72 3.99 8.79 5.64
Volume fraction of inter-gel phase, f2 0.11 0.24 0.10 0.25
Structural parameter, α 0.20 0.15 -0.21 0.16
Counterion diffusion coefficient in the gel phase, ´Dcount×107 (cm2.s-1)
5.20 4.77 9.97 4.33
Counterion diffusion coefficient in the gel phase,
Near the isoconductance point Eq. (9) shows that κm depends only slightly on α. When
|
α|
≪1 , which corresponds to a quite random arrangement of gel and inter-gel phases, Eq. (9) can be approximately rewritten as follows [67]:κm , AC=κ1f1κ 2 f2 (10) and then, ln κm , AC=f1ln
(
κ1)
+f2ln (κ2) (11)Zabolotsky and Nikonenko showed that Eq. (11), which predicts a linear variation of ln m,AC
vs. ln 2, is a satisfying approximation in the concentration range ~0.1 ciso < ciso < ~10 ciso up
to
|
α|
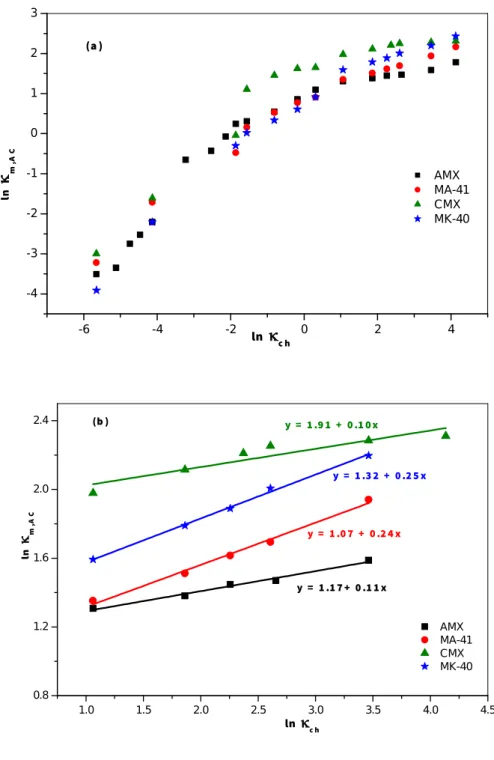
=0.2 .Fig. 6 shows the experimental ln m,AC vs. ln ch dependence for AMX, CMX, MK-40 and
MA-41 IEMs. Measurements were performed in KCl solutions of various concentrations ranging from 10-5 to 5x10⁻¹ M. Results are in good agreement with the microheterogeneous
model since a linear variation of ln m,AC as a function of ln ch (as mentioned above, this
model assumes 2 = ch) was obtained with all IEMs for ~0.5 ciso < ciso < ~10 ciso (Fig.6b).
The volume fraction of the inter-gel phase (f2) of the different IEMs was determined from Eq.
(11) and the slope of lines obtained in the concentration range ~0.5 ciso < ciso < ~10 ciso (Fig.
6b). Results are collected in Table 4. For both AMX and CMX membranes f2 were found to be
less than 0.15, which corresponds to homogeneous membranes. On the other hand, f2 was
found to be 0.24 and 0.25 for the heterogeneous MA-41 and MK-40 membranes, respectively. Our results are in good agreement with f2 values reported in the literature for these membranes
(Table 5), which gives additional evidence for the reliability of our lateral measurements of electrical membrane resistance.
-6 -4 -2 0 2 4 -4 -3 -2 -1 0 1 2 3 AMX MA-41 CMX MK-40 ln c h ln m,A C (a ) 1.0 1.5 2.0 2.5 3.0 3.5 4.0 4.5 0.8 1.2 1.6 2.0 2.4 AMX MA-41 CMX MK-40 ln m,A C ln c h y = 1 .9 1 + 0 .1 0x y = 1 .3 2 + 0 .2 5 x y = 1 .0 7 + 0 .2 4 x y = 1 .1 7 + 0 .1 1 x (b )
Fig. 6. a) Logarithm of membrane conductivity vs. logarithm of KCl solution conductivity. b)
Table 5. IEM parameters inferred from normal measurements (literature results). Membran e f2 α ´Dcount×107 (cm2.s-1) Electrolyte Reference AMX 0.24 0.06 0.099 0.10 ±0.02 0.10 ±0.01 0.06 0.11 0.35 5.1 4.1 4.5 Cl− form NaCl NaCl NaCl NaCl NaCl NaCl [8] [27] [33] [47] [51] [54] [69] CMX 0.06 0.11 ± 0.02 0.11 ± 0.01 0.06 0.04 11.61 NaCl NaCl NaCl NaCl HCl [46] [47] [51] [60] [60] MA-41 0.18 0.22 ±0.02 0.20 ± 0.03 0.17 0.18 0.22 0.23 0.10 0.31 0.24 0.31 0.50 4.7 NaCl NaCl NaCl NaCl NaCl NaCl NaCl LiCl [27] [47] [67] [69] [70] [71] [72] [73] MK-40 0.18 0.19 ±0.02 0.18 0.20 0.23 0.19 0.33 7.35 NaCl NaCl NaCl HCl NaCl LiCl [46] [47] [60] [60] [69] [73]
Knowing f2 and κiso, the structural parameter α was further determined for each membrane by
fitting experimental data shown in Fig. 6a with Eq. (9). We obtained 0.15 ≤∨α∨≤ 0.21 for all membranes (see Table 4), which indicates a rather random connection between gel and inter-gel phases whatever the kind of IEMs (homogeneous or heterogeneous). It should be stressed that data obtained for highly diluted solutions (c ≤ 10-4 mol.L-1) were disregarded in
the fitting procedure since they were found to yield irrelevant α values. The reason might be that the assumption made in the microheterogeneous model that the inter-gel phase is filled with an electroneutral solution having the same conductivity as the external solution is no
Indeed, electrical double layers expand as the electrolyte concentration decreases. At sufficiently low concentration they may overlap inside the inter-gel phase cavities which would then no longer be filled with an electroneutral solution but would contain an excess of counterions (and so 2 would be greater than ch) [74].
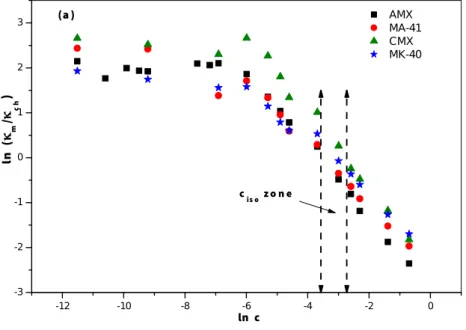
Fig. 7 shows the concentration dependence of ln κm/κch for the different IEMs. At low concentrations the membrane conductivity was found higher than that of the external solution because ion concentration inside the membrane was much higher than the external bulk concentration. Moreover, we observed in the low concentration range that the variation of
κm/κch with the electrolyte concentration was more pronounced for MA-41 and MK-40
heterogeneous membranes than for AMX and CMX homogeneous membranes (Fig. 7b).
-12 -10 -8 -6 -4 -2 0 -3 -2 -1 0 1 2 3 AMX MA-41 CMX MK-40 ln c (a ) ln ( m / ch ) cis o z o n e
-12 -11 -10 -9 -8 -7 -6 -5 1.0 1.5 2.0 2.5 3.0 AMX MA-41 CMX MK-40 ln ( m / ch ) ln c (b )
Fig. 7. a) Logarithm of membrane conductivity to solution conductivity ratio vs. logarithm of
KCl solution concentration b) Enlargement for very low concentrations (10-5 – 5x10⁻³ M).
As discussed above, the conductivity at the isoconductance point (iso) is an essential quantity
to get information on IEM structural properties. It can also be used to determine the
counterion diffusion coefficient ( ´Dcount ) in the gel phase [8, 67]:
´Dcount=RT κiso
F2Q (12)
where R is the ideal gas constant, T the temperature, F the Faraday’s constant and Q is the exchange capacity of the gel phase, which can be obtained from the membrane ion-exchange capacity (Qm) and the volume fraction of the gel phase (f1):
Q=Qm
The counterion diffusion coefficient in the gel phase of the different IEMs was found to lie in the range 4x10⁻⁷ – 10-6 cm2.s-1 (see Table 4), i.e. 20 to 50 times smaller than in the bulk phase,
which results from the strong attractive interaction between counterions and the fixed-charges in the IEM gel phase. These values lie in the range of experimental results obtained from normal measurements (Table 5).
The gel phase conductivity, which can be obtained from Eq. (10), can be expressed as:
κ1= F 2
RT
(
´Dco´Ccozco2 + ´Dcount´Ccountzcount2)
(14)where ´C❑ and ´D
denote ion concentrations and diffusion coefficients in the gel phase,
respectively, z is the ion charge number, and subscripts “co” and “count” stand for coions and counterions, respectively.
The electroneutrality condition in the gel phase reads as follows: zco
❑ ´C
co+zcount
❑ ´C
count+ωQ=0 (15)
with = +1 for an anion-exchange membrane and -1 for a cation-exchange membrane.
The interfacial Donnan equilibrium is given by,
Ki= ´Ci Ci=K
zi
(16)
where Ki is the Donnan partitioning coefficient for ion i, Ci its bulk concentration, and K is the Donnan equilibrium constant.
For mono-monovalent electrolytes Eqs. (15) and (16) lead to: ´Cco=−ωQ 2 +
√
C❑ 2 +(ωQ 2 ) 2 (17) ´Ccount=ωQ 2 +√
C❑ 2 +(ωQ 2 ) 2 (18)where C is the external electrolyte concentration.
The counterion transport number in the gel phase ( ´tcount ) can be determined around the
isoconductance point from the following equation with the help of Eqs. (12), (14), (17) and (18): ´tcount=
|
zcount ❑|
´D count ´Ccount|
zcount❑|
´D count ´Ccount+|
zco ❑|
´D co ´Cco (19)The transport numbers of counterions in the gel phase were found around 0.99 for all IEMs (Table 4).
As mentioned in section 2.3 the SurPASS instrument also allows determining the cell electrical resistance from electrokinetic measurements (hereafter referred to as the DC method), namely streaming current and streaming potential measurements, which is
equivalent to the DC resistance
r (¿¿cellDC)
¿ . Fig. 8 shows the AMX membrane conductivity
determined from both AC and DC methods for KCl solutions of various concentrations. To the best of our knowledge it is the first time that streaming potential and streaming current measurements are combined to determine the electrical conductivity of IEMs. Both methods
led to close values with κm, AC only slightly higher than κm, DC .
The transport number of counterions (Cl−) inside the gel phase of AMX membrane was
estimated to be 0.989 (Table 4). When ´tcount→ 1 and
|
α|
≪1 the DC conductivity and the AC conductivity can be linked by the following approximate equation [67]:κm , DC=κm , ACtcountf2
(20)
where tcount is the transport number of counterions in the external solution, i.e. nearly 0.5 for Cl− in KCl solutions.
According to Eq. (20) the difference between the logarithm κm, AC and that of κm , DC is then approximately equal to -0.69f2. From results shown in Fig. 8 we obtained f2 = 0.11
-4 -2 0 2 4 -3 -2 -1 0 1 2 ln c h ln m D C m e th o d A C m e th o d
Fig.8. Logarithm of the AMX membrane conductivity determined from DC and AC methods
vs. logarithm of the KCl solution conductivity.
4. Conclusion
The electrical conductivity of four commercial IEMs (AMX, CMX, MK-40 and MA-41) was determined by a new method based on lateral resistance measurements without direct contact between electrodes and membranes. It was first demonstrated that the cell configuration permitted probing the entire membrane volume and that conduction did not occur only along the membrane surface. Moreover, the parallel arrangement of the membrane samples and the electrolyte solution inside the measuring cell made it possible to determine membrane conductivity even at very low electrolyte concentration unlike usual non-contact cells. The microheterogeneous model was used to estimate the structural parameters of the different
IEMs from electrical resistance measurements performed in AC mode. Transport parameters
(counterion diffusion coefficients and transport numbers) within the gel phase of IEMs were further determined from the membrane AC conductivity and the combination of the microheterogeneous model with the Donnan-exclusion approach.
Finally, the membrane DC conductivity was determined for the first time from both streaming potential and streaming current measurements. The inter-gel phase volume fraction of AMX membrane inferred from these electrokinetic measurements was found in excellent agreement with AC measurements.
References
[1] S. Nouri, L. Dammak, G. Bulvestre, B. Auclair, Comparison of three methods for the determination of the electrical conductivity of ion-exchange polymers, Europ. Polym. J. 38 (2002) 1907 – 1913.
[2] L.V. Karpenko, O.A. Demina, G.A. Dvorkina, S.B. Parshikov, C. Larchet, B. Auclair, N.P. Berezina, Comparative study of methods used for the determination of electroconductivity of ion-exchange membranes, Russ. J. Electrochem. 37 (2001) 287 – 293.
[3] C.L. Gardner, A.V. Anantaraman, Studies on ion-exchange membranes. II. Measurement of the anisotropic conductance of Nafion®,J. Electroanal. Chem. 449 (1998) 209 – 214.
[4] R.F. Silva, M. De Francesco, A. Pozio, Tangential and normal conductivities of Nafion®
membranes used in polymer electrolyte fuel cells, J. Power Sources 134 (2004) 18 – 26. [5] T. Soboleva, Z. Xie, Z. Shi, E. Tsang, T. Navessin, S. Holdcroft, Investigation of the through-plane impedance technique for evaluation of anisotropy of proton conducting polymer membranes, J. Electroanal. Chem. 622 (2008) 145–152.
[6] V. Subrahmanyan, N. Lakshminarayanaiah, A rapid method for the determination of electrical conductance of ion-exchange membranes, J. Phys. Chem. 72 (1968) 4314 – 4316. [7] M. Périé, J. Périé, Conductance study of the borate form of an anionic homogeneous membrane by impedance spectroscopy, J. Electroanal. Chem. 393 (1995) 17 – 28.
[8] A. Elattar, A. Elmidaoui, N. Pismenskaia, C. Gavach, G. Pourcelly, Comparison of transport properties of monovalent anions through anion-exchange membranes, J. Membr.
[9] N.N. Belaid, B. Ngom, L. Dammak, C. Larchet, B. Auclair, Conductivité membranaire: interprétation et exploitation selon le modèle à solution interstitielle hétérogène, Europ. Polym. J. 35 (1999) 879 – 897.
[10] C. Casademont, G. Pourcelly, L. Bazinet, Effect of magnesium/calcium ratios in solutions treated by electrodialysis: Morphological characterization and identification of anion-exchange membrane fouling, J. Colloid Interface Sci. 322 (2008) 215–223.
[11] J.H. Choi, S.H. Kim, S. H. Moon, Heterogeneity of ion-exchange membranes: The effects of membrane heterogeneity on transport properties, J. Colloid Interface Sci. 241(2001) 120–126.
[12] J.H. Choi, S.H. Moon, Structural change of ion-exchange membrane surfaces under high electric fields and its effects on membrane properties, J. Colloid Interface Sci. 265 (2003) 93– 100.
[13] E. Ayala-Bribiesca, G. Pourcelly, L. Bazinet, Nature identification and morphology characterization of anion-exchange membrane fouling during conventional electrodialysis, J. Colloid Interface Sci. 308 (2007) 182–190.
[14] L. Chaabane, G. Bulvestre, C. Innocent, G. Pourcelly, B. Auclair, Physicochemical characterization of ion-exchange membranes in water–methanol mixtures, Europ. Polym. J. 42 (2006) 1403–1416.
[15] M. Boudet-Dumy, A. Lindheimer, C. Gavach, Transport properties of anion exchange membranes in contact with hydrochloric acid solutions. Membranes for acid recovery by electrodialysis, J. Membr. Sci. 57 (1991) 57 – 68.
[16] M.S. Kang, Y.J. Choi, S.H. Moon, Water-swollen cation-exchange membranes prepared using poly(vinyl alcohol) (PVA)/poly(styrene sulfonic acid-co-maleic acid) (PSSA-MA), J. Membr. Sci. 207 (2002) 157–170.
[17] V. Lindstrand, G. Sundström, A.S. Jonssön, Fouling of electrodialysis membranes by organic substances, Desalination 128 (2000) 91 – 102.
[18] B. Bauer, H. Strathmann, F. Effenberger, Anion-exchange membranes with improved alkaline stability, Desalination, 79 (1990) 125 – 144.
[19] C.M. Oh, C.W. Hwang, T.S. Hwang, Synthesis of a quaternarized poly(vinylimidazole-cotrifluoroethylmethacrylate-co-divinylbenzene) anion-exchange membrane for nitrate removal, J. Environ. Chem. Eng. 2 (2014) 2162–2169.
[20] C.W. Hwang, H.M. Park, C.M. Oh, T.S. Hwang, J. Shim, C.S. Jina, Synthesis and characterization of vinylimidazole-co-trifluoroethylmethacrylate-co-divinylbenzene anion-exchange membrane for all-vanadium redox flow battery, J. Membr. Sci. 468 (2014) 98–106. [21] Y. Kakihana, Y. Ogawa, K. Takamura, N. Kawamura, R. Hara, M. Higa, Characterization of cation-exchange membranes prepared from a graft-copolymer consisting of a polysulfone main chain and styrene sulfonic acid side chains, Electrochim. Acta 129 (2014) 120–126. [22] S.M. Hosseini, S.S. Madaeni, A.R. Khodabakhshi, Preparation and characterization of ABS/HIPS heterogeneous cation exchange membranes with various blend ratios of polymer binder, J. M. Sci. 351 (2010) 178–188.
[23] S. Sang, K. Huang, X. Li, The influence of H2SO4 electrolyte concentration on proton
transfer resistance of membrane/solution interface, Europ. Polym. J. 42 (2006) 2894–2898. [24] V.K. Shahi, A.P. Murugesh, B.S. Makwana, S.K. Thampy, R. Rangarajan, Comparative investigations on electrical conductance of ion-exchange membranes, Ind. J. Chem. A 39 (2000) 1264 – 1269.
[25] X. Tongwen, Y. Weihua, Fundamental studies of a new series of anion exchange membranes: membrane preparation and characterization, J. Membr. Sci. 190 (2001) 159–166. [26] N.P. Berezina, E.N. Komkova, A Comparative study of the electric transport of ions and water in sulfonated cation-exchange polymeric membranes of the new generation, Colloid J. 65 (2003) 1–10.
[27] O.A. Demina, N.P. Berezina, T. Sata, A.V. Demin, Transport–structural parameters of domestic and foreign anion-exchange membranes, Russ. J. Electrochem. 38 (2002) 896–902.
[28] C. Gavach, G. Pamboutzoglou, M. Nedyalkov, G. Pourcelly, AC impedance investigation of the kinetics of ion transport in NAFION® perfluorosulfonic membranes, J. Membr. Sci. 45
(1989) 37 – 53.
[29] G. Pourcelly, A. Oikonomou, C. Gavach, Influence of the water content on the kinetics of counter-ion transport in perfluorosulphonic membranes, J. Electroanal. Chem. 287 (1990) 43 – 59.
[30] G. Pourcelly, A. Lindheimer, G. Pamboutzoglou, C. Gavach, Conductivity of sorbed hydrohalogenic acid in Nafion perfluorosulfonic membranes. J. Electroanal. Chem. 259 (1989) 113 – 125.
[31] L.X. Tuan, M. Verbanck, C. Buess-Herman, H.D. Hurwitz, Properties of CMV
cation-exchange membranes in sulfuric acid media, J. Membr. Sci. 284 (2006) 67–78.
[32] P. Millet, Determination of self-diffusion coefficients from conductivity measurements in perfluorinated ionomer membranes, J. Membr. Sci. 50 (1990) 325 – 328.
[33] L.X. Tuan, Permselectivity and microstructure of anion exchange membranes, J. Colloid Interface Sci. 325 (2008) 215–222.
[34] J.J. Krol, M. Wessling, H. Strathmann, Chronopotentiometry and overlimiting ion transport through monopolar ion exchange membranes, J. Membr. Sci. 162 (1999) 145 – 154. [35] P. Długołecki, B. Anet, S.J. Metz, K. Nijmeijer, M. Wessling, Transport limitations in ion exchange membranes at low salt concentrations, J. Membr. Sci. 346 (2010) 163–171.
[36] P. Długołecki, K. Nymeijer, S. Metz, M. Wessling, Current status of ion exchange membranes for power generation from salinity gradients, J. Membr. Sci. 319 (2008) 214–222. [37] P. Długołecki, P. Ogonowski, S.J. Metz, M. Saakes, K. Nijmeijer, M. Wessling, On the resistances of membrane, diffusion boundary layer and double layer in ion exchange membrane transport, J. Membr. Sci. 349 (2010) 369–379.
[38] L. Maldonado, J.C. Perrin, J. Dillet, O. Lottin, Characterization of polymer electrolyte Nafion® membranes: Influence of temperature, heat treatment and drying protocol on sorption
and transport properties, J. Membr. Sci. 389 (2012) 43– 56
[39] T. Okada, G. Xie, O. Gorseth, S. Kjelstrup, N. Nakamura, T. Arimura, Ion and water transport characteristics of Nafion membranes as electrolytes, Electrochimica Acta. 43 (1998) 3741 – 3747.
[40] A. Lehmani, P. Turq, M. Périé, J. Périé, J.P. Simonin, Ion transport in Nafion® 117
membrane, J. Electroanal. Chem. 428 (1997) 81 – 89.
[41] K. Hongsirikarn, J.G. Goodwin Jr., S. Greenway, S. Creager, Effect of cations (Na+, Ca2+,
Fe3+) on the conductivity of a Nafion membrane, J. Power Sources 195 (2010) 7213–7220.
[42] K. Hongsirikarn, J.G. Goodwin Jr., S. Greenway, S. Creager, Influence of ammonia on the conductivity of Nafion membranes, J. Power Sources 195 (2010) 30–38.
[43] M. Casciola, G. Alberti, M. Sganappa, R. Narducci, On the decay of Nafion proton conductivity at high temperature and relative humidity, J. Power Sources 162 (2006) 141–145. [44] Astom Corporation (Japan); http://www.astom-corp.jp
[45] United Chemical Company Shchekinoazot (Russia); www.n-azot.ru
[46] L.V. Karpenko-Jereb, N.P. Berezina, Determination of structural, selective, electrokinetic and percolation characteristics of ion-exchange membranes from conductive data, Desalination 245 (2009) 587–596.
[47] N.D. Pismenskaya, E.I. Belova, V.V. Nikonenko, C. Larchet, Electrical conductivity of cation- and anion-exchange membranes in ampholyte solutions, Russ. J. Electrochem. 44 (2008) 1285–1291.
[48] Anton Paar GmbH ; http://www.anton-paar.com/corp-en/products/group/surface-analysis/
[49] A. Szymczyk, Y.I. Dirir, M. Picot, I. Nicolas, F. Barrière, Advanced electrokinetic characterization of composite porous membranes, J. Membr. Sci. 429 (2013) 44–51.
[50] A. Szymczyk, N. Fatin-Rouge, P. Fievet, Tangential streaming potential as a tool in modeling of ion transport through nanoporous membranes, J. Colloid Interface Sci. 309 (2007) 245–252.
[51] V. Sarapulova, E. Nevakshenova, N. Pismenskaya, L. Dammak, V. Nikonenko, Unusual concentration dependence of ion-exchange membrane conductivity in ampholyte-containing solutions: Effect of ampholyte nature, J. Membr. Sci. 479 (2015) 28–38.
[52] H.J. Lee, D.H. Kim, J. Cho, S.H. Moon, Characterization of anion exchange membranes with natural organic matter (NOM) during electrodialysis, Desalination 151 (2002) 43 – 52. [53] H.J. Lee, J.H. Choi, J. Cho, S.H. Moon, Characterization of anion exchange membranes fouled with humate during electrodialysis, J. Membr. Sci. 203 (2002) 115–126.
[54] H.J. Lee, M.K. Hong, S.D. Han, S.H. Moon, Influence of the heterogeneous structure on the electrochemical properties of anion exchange membranes, J. Membr. Sci. 320 (2008) 549– 555.
[55] M.S. Kang, S.H. Cho, S.H. Kim, Y.J. Choi, S.H. Moon, Electrodialytic separation characteristics of large molecular organic acid in highly water-swollen cation-exchange membranes, J. Membr. Sci. 222 (2003) 149–161.
[56] V.I. Zabolotskii, S.A. Loza, M.V. Sharafan, Physicochemical properties of profiled heterogeneous ion-exchange membranes, Russ. J. Electrochem. 41 (2005) 1053–1060.
[57] R. Lteif, L. Dammak, C. Larchet, B. Auclair, Conductivité électrique membranaire: étude de l'effet de la concentration, de la nature de l'électrolyte et de la structure membranaire, Europ. Polym. J. 35 (1999) 1187 – 1195.
[58] N. Pismenskaya, V. Nikonenko, E. Volodina, G. Pourcelly, Electrotransport of weak-acid anions through anion-exchange membranes, Desalination 147 (2002) 345-350.
[59] L. Dammak, R. Lteif, G. Bulvestre, G. Pourcelly, B. Auclair, Determination of the diffusion coefficients of ions in cation-exchange membranes, supposed to be homogeneous, from the electrical membrane conductivity and the equilibrium quantity of absorbed
[60] L.V. Karpenko-Jereb, A.M. Kelterer, N.P. Berezina, A.V. Pimenov, Conductometric and computational study of cationic polymer membranes in H+ and Na+-forms at various hydration
levels, J. Membr. Sci. 444 (2013) 127–138.
[61] S. Nouri, L. Dammak, C. Larchet, B. Auclair, Correlation between ion-exchange membranes characteristics for evaluation of the permselectivity and the diffusion coefficients, Desalination 147 (2002) 363 – 368.
[62] O.A. Demina, A.V. Demin, V.I. Zabolotskii, N.P. Berezina, The effect of aprotic solvent on the selectivity of ion-exchange membranes, Russ. J. Electrochem. 47 (2011) 759–767. [63] C. Larchet, B. Auclair, V. Nikonenko, Approximate evaluation of water transport number in ion-exchange membranes, Electrochim. Acta 49 (2004) 1711–1717.
[64] N.P. Gnusin, L.V. Karpenko, O.A. Demina, N.P. Berezin, Calculation of the ion-exchange equilibrium constant for MK-40 Sulfo cation-ion-exchange membranes from conductometric data, Russ. J. Phys. Chem. 75 (2001) 1550 – 1554.
[65] N.P. Berezina, N.A. Kononenko, O.A. Dyomina, N.P. Gnusin. Characterization of ion-exchange membrane materials: Properties vs structure. Adv. Colloid Interface Sci. 139 (2008) 3–28.
[66] V.I. Vasil’eva, E.M. Akberova, V.A. Shaposhnik, M.D. Malykhin, Electrochemical properties and structure of ion-exchange membranes upon thermochemical treatment, Russ. J. Electrochem. 50 (2014) 789–797.
[67] V.I. Zabolotsky, V.V. Nikonenko, Effect of structural membrane inhomogeneity on transport properties, J. Membr. Sci. 79 (1993) 181 – 198.
[68] A.B. Yaroslavtsev, V.V. Nikonenko, Ion-exchange membrane materials: Properties, modification, and practical application, Nanotech. in Russia 4 (2009) 137–159.
[69] E. Volodina, N. Pismenskaya, V. Nikonenko, C. Larchet, G. Pourcelly, Ion transfer across ion-exchange membranes with homogeneous and heterogeneous surfaces, J. Colloid Interface Sci. 285 (2005) 247–258.
[70] N.P. Gnusin, N.P. Berezina, N.A. Kononenko, O.A. Dyomina, Transport structural parameters to characterize ion exchange membranes. J. Membr. Sci. 243 (2004) 301–310. [71] W. Garcia-Vasquez, R. Ghalloussi, L. Dammak, C. Larchet, V. Nikonenko, D. Grande, Structure and properties of heterogeneous and homogeneous ion-exchange membranes subjected to ageing in sodium hypochlorite, J. Membr. Sci. 452(2014) 104–116.
[72] N. Pismenskaya, K. Igritskaya, E. Belova, V. Nikonenko, G. Pourcelly, Transport properties of ion-exchange membrane systems in LysHCl solutions, Desalination 200 (2006) 149 –151.
[73] O.A. Dyomina, N.P. Berezina, A.V. Dyomin, V.I. Zabolotsky, Influence of aqueous-organic solutions containing aprotic solvent on equilibrium and transport properties of ion-exchange membranes, Desalination 240 (2009) 347 – 350.
[74] P. Fievet, B. Aoubiza, A. Szymczyk, J. Pagetti, Membrane potential in charged porous membranes, J. Membr. Sci. 160 (1999) 267 –275.
![Fig. 1. Schematic representation of the adjustable-gap cell used for electrical resistance measurements (adapted from [48]).](https://thumb-eu.123doks.com/thumbv2/123doknet/13887123.447163/9.892.116.769.433.800/fig-schematic-representation-adjustable-electrical-resistance-measurements-adapted.webp)