HAL Id: cirad-00699337
http://hal.cirad.fr/cirad-00699337
Submitted on 20 May 2012HAL is a multi-disciplinary open access archive for the deposit and dissemination of sci-entific research documents, whether they are
pub-L’archive ouverte pluridisciplinaire HAL, est destinée au dépôt et à la diffusion de documents scientifiques de niveau recherche, publiés ou non,
Will simplified modalities and procedures make more
small-scale forestry projects viable under the Clean
Development Mechanism?
Bruno Locatelli, Lucio Pedroni
To cite this version:
Bruno Locatelli, Lucio Pedroni. Will simplified modalities and procedures make more small-scale forestry projects viable under the Clean Development Mechanism?. Mitigation and Adaptation Strate-gies for Global Change, Springer Verlag, 2006, 11 (3), pp.621-643. �10.1007/s11027-006-5274-y�. �cirad-00699337�
Will simplified modalities and procedures make more small‐scale
forestry projects viable under the Clean Development Mechanism?
Bruno Locatelli (1), Lucio Pedroni (2)
1 CIRAD France – CATIE Costa Rica, Apdo 2, Catie, 7170 Turrialba, Costa Rica (∗Author for correspondence: E‐mail: [email protected]; Tel: +506‐5582216, Fax: +506‐5568470) 2 Global Change Group, CATIE Costa Rica, Catie, 7170 Turrialba, Costa Rica Accepted version of: Locatelli B., Pedroni L., 2006. Will simplified modalities and procedures make more small‐scale forestry projects viable under the Clean Development Mechanism? Mitigation and Adaptation Strategies for Global Change 11(3): 621‐643. doi:10.1007/s11027‐006‐5274‐yAbstract
Simplified modalities and procedures (M&P) are expected to increase the viability of small‐scale project activities under the Clean Development Mechanism (CDM). A small‐scale afforestation or reforestation (AR) project is defined as a project removing less than 8 kilotons of carbon dioxide equivalent (CO2e) per year. Depending on the project type and the method for measuring scale, 8 kilotons of CO2e per year correspond to highly diverse areas, possibly ranging from 200 to 6000 ha. Using a model to calculate the minimum project scale above which the CDM is a positive financial incentive for eligible AR project activities, the paper analyzes whether a reduction of transaction costs under simplified M&P will be a sufficient incentive to motivate small‐scale participation in the CDM. Model results show that, even under optimistic assumptions on carbon market conditions and transaction costs, small‐scale project activities will not benefit from simplified M&P. Results also show that project activities removing more than 8 kilotons of CO2e per year and registered as small‐scale would be the ones that could benefit the most from simplified M&P. It is concluded that the participation of small‐scale project activities to the CDM requires more than simplified M&P, the price of expiring Certified Emission Reductions being one of the most critical parameters.Keywords
Afforestation, carbon accounting, carbon dioxide equivalent, clean development mechanism, Kyoto Protocol, modalities and procedures, reforestation, small‐scale project1. Introduction
In Milan (December 2003), the Ninth Conference of the Parties (CoP‐9) decided on modalities and procedures (M&P) for including afforestation and reforestation (AR) project activities under the Clean Development Mechanism (CDM). Like in the energy sector, simplified M&P will be applied to small‐scale CDM project activities, defined as those project activities that are expected to result in net anthropogenic greenhouse gas (GHG) removals by sinks of less than 8 kilotons (kt) of carbon dioxide equivalent (CO2e) per year and that are developed or implemented by low‐income communities and individuals (UNFCCC, 2004a). There are two basic reasons that justify simplified M&P for small‐scale AR‐CDM project activities: transaction costs and equity. In this paper, transaction costs are referred to as those project‐related costs that arise from CDM‐specific activities and do not occur in non‐CDM AR projects. Most of these costs are a consequence of M&P. CDM project design, validation, monitoring and verification, national and CDM levees on the issuance of Certified Emission Reductions (CERs), and the negotiation of CER‐purchase agreements are example of CDM‐related transaction costs (Michaelowa et al. 2003). Project activities that produce only small amounts of CERs will not be able to pay their CDM transaction costs with the revenues from CERs sales. Consequently, countries that have most of their AR‐CDM possibilities in the small‐scale category may have only a marginal participation to the CDM. Furthermore, low‐income communities and individuals that are unable to implement large‐scale project activities would be excluded from the CDM. As the CDM may contribute to alleviate poverty and pursue sustainable development goals, disadvantaged social groups and countries and regions that have most of their potential project portfolio in the small‐scale category should not be discouraged. These arguments explain why the international discussions on CDM considered simplified M&P for small‐scale projects. However, as the goal of the Kyoto Protocol is GHG emission reduction, simplified M&P should not result in doubtful GHG emission removals, as this would violate the principle of environmental integrity of the treaty. In any CDM project activity (small‐scale or full‐scale), there is a risk that bad modalities for baseline, additionality, leakage, and monitoring may overestimate the additional GHG removals, but the risk seems higher for simplified M&P. Equity and environmental integrity generate a difficult dilemma: how much can M&P be simplified without violating the fundamental principle of environmental integrity and, at the same time, how much should they be simplified to induce a reduction of transaction costs that would be effective for allowing small‐scale participation? This paper does not ad‐dress this dilemma, but it provides clear indications on how important the reduction of transaction costs should be to have an effect on small‐scale participation. An assumption of our analysis is that non‐permanence and carbon accounting will not be treated differently under simplified M&P. Non‐permanence refers to the fact that carbon cycles between atmosphere and biosphere, and that its residence time in forest ecosystems is limited. Because of it, carbon storage in forests cannot offset permanent emissions of GHG (Chomitz 2000; Fearnside et al. 2000; Dutschke 2001; IPCC 2000). CoP‐9 addressed this problem by deciding that only expiring units (temporary Certified Emission Reductions, or tCERs; and long‐term CERs, or lCERs) may be issued for AR‐CDM project activities (UNFCCC 2004a). Because these units have to be replaced once they expire, their price will be lower than the one of permanent, not‐expiring units of the Kyoto Protocol GHG accounting system (CERs, AAUs, ERUs, RMUs). This will negatively affect the attractiveness of the CDM as an incentive for AR project activities and increase the project scale at which costs and benefits of the CDM offset each other. The aim of this paper is to study whether simplified M&P may effectively contribute to increase the viability of small‐scale project activities, and what other parameters, such as the ones depending on the carbon market and the capacities of developing countries, could facilitate the participation of small‐scale project activities in the CDM.2. Materials and Methods
The paper evaluates the financial viability of the CDM in AR project activities under simplified and full‐scale M&P, using a model to calculate the minimum viable project scale under various assumptions regarding project activities, CER price, and transaction costs. The analysis considers only the CDM component of a project, i.e. benefits from CERs trading and CDM transaction costs. The financial and socioeconomic viability of AR project activities per se will not be addressed in this paper because they are not relevant in the context of the discussion on M&P. As discussed by Locatelli and Pedroni (2004), the scale in hectares (or in kt CO2e/yr) above which a project may benefit from the CDM depends on several parameters that can be grouped in three main categories: parameters related to physical and management aspects of the project, parameters of the carbon market, and parameters depending on M&P. As this latter group of parameters will be differentiated according to the scale of the proposed project activity (full‐scale or small‐scale), we designed a model to evaluate the effect on the minimum viable project scale under different sets of M&P. The model can also be used to evaluate the effect of each parameter, or group of parameters, separately. To take advantage of this possibility, we wrote a computing routine to run the model several times, each with a different combination of values for the parameters that influence the minimum viable project scale. These parameters are described below. 2.1. Parameters related to physical and management aspects of the project Included in this group are parameters related to the type of activity (e.g. agroforestry or forest plantation), such as growth, wood density, carbon fraction, plantation density, thinning and harvesting, duration of the first planting period, and natural mortality. Parameters related to project management are also included here, for instance project duration and economic discount rate. For this study, a project duration longer than the longest renewed crediting period (60 years) was assumed. For the project discount rate, three values were considered: 6, 9, and 12%, the highest discount rate being adequate for situations where project managers seek quick returns on investment. The discount rate influences the financial analysis of the project, because the main costs occur early and the benefits from carbon trading occur later. To adequately represent the spectrum of possible AR‐CDM project activities being proposed under different circumstances four types of projects were defined: slow‐, medium‐ and fast‐growing forest plantations (5, 15, and 25 m3/ha/yr, respectively) and a coffee agroforestry system in which multipurpose trees are introduced. Pure forest plantations are likely to be the most common project activity under the AR‐CDM. Depending on the objectives (restoration, commercial wood production), species (natives or exotic), and site conditions (degraded or fertile), tree growth and carbon removal rate of these plantations will be slow or fast, which justifies including a broad range of values in the model. The carbon removal of a standard plantation was calculated and multiplied by three different factors to obtain the carbon removal of the three plantations. The standard plantation is characterized by the following parameters: wood density (0.45 t/m3); carbon ratio (0.5); diameter growth (0.018 m/yr during the 25 first years, 0.009 between year 25 and 35, 0.005 after year 35); height growth (1.8 m/yr during the 20 first years, 1.1 between year 30 and 35, 0.4 after year 30); allometric regression (cubic meters of commercial volume = 0.2 × D × H2 where D is the diameter at breast height in meters and H is the height in meters); expansion factor (1.55); initial plantation density (1500 trees/ha); mortality rate (0.02 yr−1); thinning (45% at year 5, 35% at year 10, 25% at year 15). With these parameters, the model calculated an increasing carbon stock curve, with a value of 142 tC/ha (or 522 tCO2e/ha) at age 25 and a mean commercial growth of 16.3 m3/ha/yr during the first 25 years.The growth curve for the standard plantation was multiplied by three adjustment factors to get the curves for slow, medium, and fast growth (in average 5, 15, and 25 m3/ha/yr, respectively, during the first 25 years). These growths were assumed to represent the spectrum of possible project initiatives ranging from forest landscape restoration using slow‐growing native species to commercial plantations using fast‐ growing species. Mead (2001) gives some examples of plantation species with a mean growth rate within this range during a period around 25 years: Eucalyptus robusta in Hawaii (26 m3/ha/yr), Eucalyptus grandis in Australia (16 m3/ha/yr), Pinus caribaea in Trinidad (20 m3/ha/yr), Pinus patula in Tanzania (around 20 m3/ha/yr), Pinus radiata in many countries (25–30 m3/ha/yr), Casuarina equisetifolia in Asia (7–10 m3/ha/yr), Tectona grandis in Costa Rica (15–20 m3/ha/yr). For any species, lower growth rates may occur in less fertile sites or less intensively managed plantations. The net anthropogenic GHG removal by sinks was calculated for projects in which the individual stands are harvested at ages evenly distributed from 20 to 30 years, independently of growth for simplification. Carbon pools in below‐ground biomass and soil organic matter were not considered. All carbon removal by the trees was considered as additional and tradable. This assumption implies no project GHG emission, no negative leakage, and a low baseline, for instance characterized by pastures without tree. This assumption is optimistic from the point of view of the project activity. Six projects were defined with the three different growth rates (slow, medium, and fast) and two different planting periods (short, long). With the short planting period (5 years), 20% of the final project area is planted in each of the first 5 years. With the long planting period (25 years), 4% is planted every year. This assumption was made because real‐world projects usually encompass multiple stands, which are not all established during the first year. As agroforestry systems are eligible AR‐CDM project activities if they fulfill the legal definition of forest adopted in the Kyoto Protocol, a coffee agroforestry system was also included in the model. Coffee agroforestry systems are of particular interest because the coffee price crisis has put many coffee growers in difficulties, for instance in Latin America. Introducing shade trees in coffee plantations for carbon removal and wood production could help them overcoming the crises, while maintaining and improving a crop that has many cultural and social implications in Latin America. Agroforestry systems in general may be particularly appealing to small farmers because they cannot sacrifice agricultural area to pure forest plantations. For the coffee agroforestry system used in the model, a constant baseline characterized by full‐ sun coffee (without shade tree) was assumed, so that only the carbon in the shading trees was considered as additional. Data on biomass in coffee agroforestry systems represent the average value of 70 measurements made in Central America (CATIE, unpublished data from the CASCA project). As the average carbon stock of these measurements is 5.9 tC/ha for coffee and 20.7 tC/ha for shaded coffee, an average value of 14.8 tC/ha was assumed for the additional carbon stock (or 54.3 tCO2e/ha). Parameters for tree growth were chosen similar to the ones defined for plantation activities. Management was defined as harvesting and replanting of 30% of the trees at each rotation period. Rotation period was evenly distributed between 8 and 16 years. An adjustment parameter was used to get an average carbon stock of 14.8 tC/ha. Two agroforestry projects were modeled with the same two different planting periods (short, long) as in the case of plantation projects. The curves representing the net anthropogenic GHG removal by sinks of the projects used in the model are shown in Figures 1 and 2.
Figure 1. Average net anthropogenic GHG removal by sinks, quick start (total project area afforested or reforested in 5 years) Figure 2. Average net anthropogenic GHG removal by sinks, slow start (total project area afforested or reforested in 25 years) High fluctuations in Figure 1 are due to the assumption that trees are introduced in the entire project area in 5 years and harvested at an age between 20 and 30 years. When trees would be introduced during a longer period (for instance 25 years in Figure 2), fluctuations are smaller, but net anthropogenic GHG removal by sinks is slower. For the coffee agroforestry system, fluctuations are smaller because multi‐ purpose trees are not harvested all at once and at the same age. In the model calculations only projects with quick start (5 years) were considered, though slow start will be used later to show the relation between project area and the scale of 8 kt CO2e/yr. Even‐aged plantations (with all stand ages equally represented in the project area) are not what can typically be found in tropical
plantation projects. Trees are usually introduced faster than what would be required to achieve an even‐ aged plantation. In even‐aged plantations, a proportion of the total project area equal to the inverse of the duration of the stand rotation would have to be reforested each year. At that planting speed, net anthropogenic GHG removal by sinks is slow, and the minimum project area above which the CDM is a positive incentive would be larger than the one estimated in this study. 2.2. Parameters related to the carbon market CER price, transaction costs (project design, validation, registration, monitoring, and verification) and national and international levee on CDM credits (share of proceeds) are included here. As there is only incipient AR‐CDM project experience and scarce literature on this subject matter (e.g. Michaelowa et al. 2003), the value to be used for these parameters are still speculative. In absence of project specific assessments of validation, monitoring and verification costs, or market signals on the price of expiring CERs, several more and less conservative values for each parameter were used. Transaction costs were estimated with experts interview and literature (Michaelowa et al. 2003), with certification agency data and with existing projects case studies (SGS). For instance, the model used three values for design costs, from US$ 20 000 to 100 000. The same range was used for validation costs, including initial registration fees that the CDM Executive Board defined between US$ 5 000 and 30 000 according to project scale (UNFCCC 2004c). The current price of 3 US$ per tCO2e and two higher prices (6 and 9) were assumed for CERs. The price of the expiring CERs (tCERs or lCERs) was calculated using Equation (1): where $eCER is the price estimated for expiring credits, $CER1 is the current market price of permanent CERs, $CER2 is the future market price of permanent CERs when eCERs expires, i is the discount rate applicable to the economic context of the buyer in Annex I countries, and j is the evolution rate of the market price of permanent CERs (Locatelli and Pedroni 2004). Equation (1) shows that the price of eCERs decreases when the evolution rate j of permanent CERs increases and is null when the discount rate i equals the evolution rate j. Expiring CERs will have a value only if the price of permanent CERs increase at a rate lower than the discount rate in Annex I countries. In this study, since the evolution rate of the market price of permanent CERs cannot be known, we assumed three scenarios: constant CER price ( j = 0), and increasing or decreasing CER price (j = plus or minus 5% annually). For all scenarios, 7% was assumed to be the share of proceeds, including national taxes on carbon credits. 2.3. Parameters depending on modalities and procedures for AR‐CDM project activities The model considers two sets of M&P: those defined at CoP‐9 for full‐scale ARCDM project activities and those that are expected to be defined for small‐scale project activities at CoP‐10.
Full‐Scale M&P. According to Decision 19/CP.9 of CoP‐9 (UNFCCC 2004a), two alternative carbon accounting methods can be used in AR‐CDM project activities: tCERs or lCERs (see Figure 3). The method chosen remains fixed during the whole project duration, including when the crediting period is renewed. tCERs may be used by an Annex I country for achieving compliance during the commitment period during which tCERs are issued. They expire at the end of the commitment period following the one in which they were issued and must be replaced by other valid units of the Kyoto Protocol accounting system (AAU, ERU, CER, RMU, tCER). The quantity of tCERs issued for the project at each verification is equal to the verified net anthropogenic GHG removals by sinks since the beginning of the project (see Figure 3, left part). Figure 3. Difference between tCERs and lCERs. By contrast, lCERs expire at the end of the crediting period. As their validity is longer, their price is supposed to be higher. However, the quantity of issued lCERs is limited to the verified net anthropogenic GHG removals by sinks since the last verification (see Figure 3, right part). There are also two options for the duration of the crediting‐period (20 years with two renewal options, or 30 years without renewal option), and several options for the date of the first verification. The interval between verifications, however, is fixed (5 years). In the model calculations, all these options were considered, including three values for the first verification (year 5, 7, or 9, respectively). Crediting period and first verification affect the timing and amount of CERs and transaction costs (e.g. each renewal of crediting period causes validation costs). Small‐Scale M&P. As these M&P are not yet defined, the model considers four aspects of them that are relevant for the question of minimum viable project scale: the quantitative limit for a project activity being considered as small‐scale, the method for measuring this quantitative limit, the possibility for a medium‐ scale project activity to work under simplified M&P, and the consequences of simplified M&P on transaction costs.
Decision 19/CP.9 defines small‐scale project activities as follows: “Small‐scale afforestation and reforestation project activities under the CDM are those that are expected to result in net anthropogenic greenhouse gas removals by sinks of less than 8 kilotons of CO2 per year and are developed or implemented by low‐income communities and individuals as determined by the host Party. If a small‐scale afforestation or reforestation project activity under the CDM results in net anthropogenic greenhouse gas removals by sinks greater than 8 kilotons of CO2 per year, the excess removals will not be eligible for the issuance of tCERs or lCERs.” (UNFCCC 2004a) In this definition the quantitative limit is clear, the method for measuring it is unclear, and the possibility of a medium‐scale project activity to work under the small‐scale M&P is given, but without trading of tCER or lCER above the 8 kt CO2e/yr limit. However, the technical paper FCCC/TP/2004/2 says that “this definition requires projects to demonstrate compliance with the ceiling of 8 kt of CO2 per year at two stages. First, at the design stage, project participants must demonstrate, ex ante, that the net anthropogenic greenhouse gas removals by sinks to be achieved by the project will not be more than 8 kt of CO2 per year. Second, during the implementation phase, project participants must demonstrate, ex post, that the net anthropogenic greenhouse gas removals by sinks achieved by the project were less than 8 kt of CO2 per year. If the net anthropogenic greenhouse gas removals by sinks by the project, as monitored and verified, exceed 8 kt of CO2 per year, the excess removals will not be eligible for the issuance of temporary certified emission reductions (tCERs) and long‐term CERs (lCERs).” (UNFCCC 2004b) If project participants will have to demonstrate ex ante that net anthropogenic GHG removal by sinks is expected to be less than 8 kt CO2e/yr, the possibility of a medium‐scale project activity to work under simplified M&P may be limited. As ex ante demonstration implies that project emissions and leakage shall also be estimated ex ante, project proponents may tend to overestimate leakage and emissions to register medium‐scale project activities as small‐scale. As the CoP decisions do not help to assess the reduction in transaction costs that will be achieved under simplified M&P, the model assumes three scenarios: 20, 50, and 80% cost reduction compared to full‐scale M&P. The highest assumption was based on values around 80% mentioned by De Gouvello and Coto (2003) for energy projects. We think that the cost reduction will not be higher for forestry projects than for energy projects, as forestry projects require some specific tasks, potentially costly, such as the monitoring of tree growth and the assessment of socioeconomic impacts. The definition is also unclear on how the limit of 8 kt CO2e/yr shall be measured. We therefore considered three measurement methods (Figure 4).
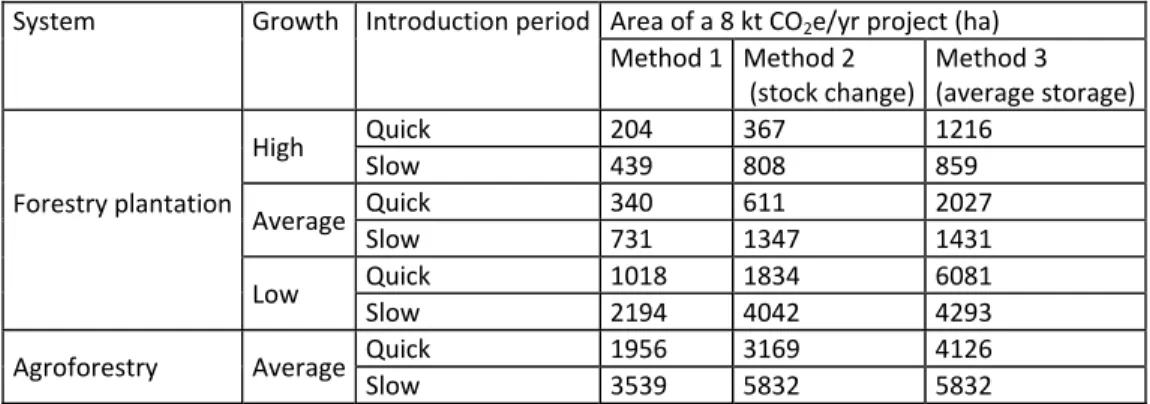
Figure 4. Three methods for evaluating the project scale in kt CO2e/yr. The first method calculates the maximum removal of CO2e between two successive verifications. Accordingly, a small‐scale project activity shall not remove more than 40 kt every 5 years. The second method assumes that a small‐scale project activity must show at any moment an average removal rate of less than 8 kt CO2e/yr since the beginning of the project. In the technical paper prepared by the UNFCCC secretariat for the Twentieth SBSTA meeting, this method is called the stock change method and defines small‐scale project activity as “any project whose net anthropogenic greenhouse gas removals by sinks are expected to be less than the threshold value of8ktofCO2 at any point in time during its crediting period” (UNFCCC 2004b). The third method considers that a small‐scale project activity must have an average removal rate of less than 8 kt CO2e/yr between the beginning of the project and the end of the crediting period. In the UNFCCC technical paper, this method is called the average storage method and defines small‐scale project activity as “any project whose net anthropogenic greenhouse gas removals by sinks are expected to be, over the total crediting period, less than 8 kt of CO2 on average” (UNFCCC 2004b). In Figure 4, the scales in kt CO2e/yr are shown graphically. The scale calculated by method 1 is the value of the highest slope of all line segments joining two successive verification points. The scale calculated by method 2 is the value of the highest slope of all line segments joining the leftmost point and a verification point. The scale calculated by method 3 is the slope value of the line segment joining the leftmost and the rightmost verification point. The highest scale is given by method 1 and the lowest by method 3. Accordingly, the project area of an activity removing 8 kt CO2e/yr will be the smallest with method 1 and the largest with method 3. The area of a 8 kt CO2e/yr project varies from 204 to 6081 ha, depending on the project and the method used for measuring scale (see Table I). Even for a same project, the area may vary by a factor of 6 between methods. As the second method results in intermediate values, our model will use it.
TABLE I Project area in hectares according to the three methods for assessing the 8 kt CO2e/yr limit of the small‐scale definition
System Growth Introduction period Area of a 8 kt CO2e/yr project (ha)
Method 1 Method 2 (stock change) Method 3 (average storage) Forestry plantation High Quick 204 367 1216 Slow 439 808 859 Average Quick 340 611 2027 Slow 731 1347 1431 Low Quick 1018 1834 6081 Slow 2194 4042 4293
Agroforestry Average Quick 1956 3169 4126
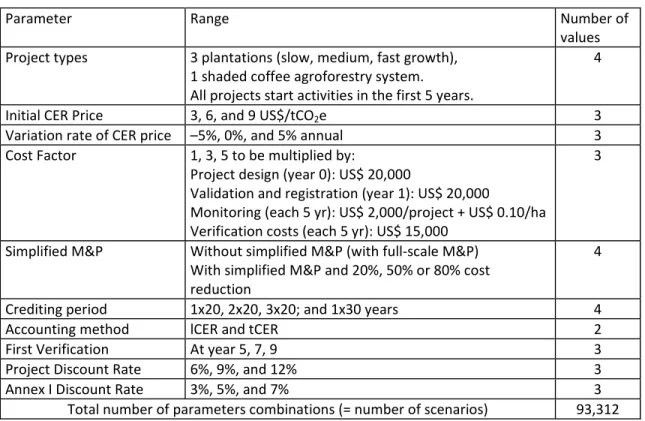
Slow 3539 5832 5832 2.4. Modeling various scenarios Instead of case studies, we choose a modeling approach to evaluate the effect of simplified M&P on the minimum project scale above which AR project activities would benefit from the CDM incentive. This is because only few, if any, well‐documented AR‐CDM project initiatives exist. Furthermore, carbon sink projects that were implemented before 2003 (such as those of the “Activities Implemented Jointly” phase) are not representative of full‐scale or simplified M&P. An advantage of the modeling approach is that it allows representing a broad spectrum of circumstances that may exist under forthcoming AR‐CDM project initiatives. The minimum viable project scale estimated by our model is defined as the number of kilotons of CO2e at which the present value of CDM costs would be equal to the present value of the revenues from CER sales. This definition means that a project with the minimum scale would not receive any financial benefits from the CDM. This minimum scale is smaller than the one needed for a project to really benefit from the CDM. As AR costs are highly variable according to project type and location, it would be more complex to define the minimum viable project scale as the number of kilotons of CO2e at which the CDM would cover, say, 10% of the normal project costs. This definition would increase the number of simulations and is beyond the scope of this paper. Our definition of minimum scale raises some important questions about additionality. As a project with the minimum scale would not receive any financial benefits from the CDM, it may be seen as “business‐as‐ usual” and not additional at all. In this paper, we assume that the AR projects under consideration have demonstrated their additionality, independently from financial issues. For instance the CDM may help removing technical or cultural barriers or attracting investors, so that the project would not have been possible without the CDM. Through a MatLabTM program written in‐house, we calculated 93 312 project scenarios using all combinations of parameter values presented in Table II. The minimum scale was calculated using a dichotomy procedure as nonlinearity occurred for simplified M&P.
TABLE II Parameters used in the model
Parameter Range Number of
values Project types 3 plantations (slow, medium, fast growth),
1 shaded coffee agroforestry system. All projects start activities in the first 5 years.
4
Initial CER Price 3, 6, and 9 US$/tCO2e 3
Variation rate of CER price –5%, 0%, and 5% annual 3 Cost Factor 1, 3, 5 to be multiplied by: Project design (year 0): US$ 20,000 Validation and registration (year 1): US$ 20,000 Monitoring (each 5 yr): US$ 2,000/project + US$ 0.10/ha Verification costs (each 5 yr): US$ 15,000 3 Simplified M&P Without simplified M&P (with full‐scale M&P) With simplified M&P and 20%, 50% or 80% cost reduction 4 Crediting period 1x20, 2x20, 3x20; and 1x30 years 4 Accounting method lCER and tCER 2 First Verification At year 5, 7, 9 3 Project Discount Rate 6%, 9%, and 12% 3 Annex I Discount Rate 3%, 5%, and 7% 3 Total number of parameters combinations (= number of scenarios) 93,312
3. Results
3.1. Effect of small‐scale M&P on chosen projects To examine the effect of simplified M&P on minimum viable project scale, we consider as an example plantation projects with a 30‐year crediting period, using the lCER accounting method and implemented under favorable market conditions: low transaction costs (factor = 1) and high CER price (US$ 9/tCO2e) used to calculate lCER price. In this example, simplified M&P are assumed to reduce transaction costs of small‐scale project activities by 50% compared to full‐scale. The other parameters take the median value indicated in Table II. The effect of M&P on the Net Present Value (NPV) of projects with these characteristics and parameter scale is shown in Figure 5.Figure 5. Effect of simplified M&P on a specific project under favorable market conditions. The example of Figure 5 indicates that smaller project activities have a higher NPV under simplified M&P than under full‐scale M&P. However, larger project activities benefit more from full‐scale M&P because they can sell more tCERs or lCERs. If projects could choose under which set of M&P to operate, they will opt for the rules with higher benefits. Under the circumstances of the above example, projects under 14.2 kt CO2e/yr (S3 in Figure 5) will choose the simplified M&P. This limit is equivalent to 1080 ha for this example. Under full‐scale M&P, only projects larger than 12.3 kt CO2eyr, or 940 ha, will receive a benefit from the CDM (S2). With simplified M&P, the limit decreases down to 7.4 kt CO2e/yr, or 560 ha (S1). In this case, very few small‐scale project activities as defined by the CoP‐9 decision (smaller than 8 kt CO2e/yr) will benefit from the CDM. This example shows that under the conditions specified above (which represent favorable market circumstances) simplified M&P for small‐scale project activities will facilitate those medium‐scale projects with scale between 8 and 14.2 kt CO2e/yr and will have effects on few small‐scale projects between 7.4 and 8 kt CO2e/yr. If medium‐scale project activities expected to remove more than 8 kt of CO2e per year were allowed to register under small‐scale, they would be allowed to trade a maximum of 8 kt CO2e/yr. As can be seen in Figure 5, the net benefits from the CDM for a medium‐scale project are still increasing under simplified M&P up to a scale of 10 kt CO2e/yr. Actually, the 8 kt CO2e/yr limit is constraining only at some verifications in an 8 kt CO2e/yr project. At other verifications, the project can increase the amount of CERs up to 8 kt CO2e/yr if it increases its scale. Under less favorable market conditions (US$ 6 as price of permanent CERs) the minimum viable project scale increases considerably (Figure 6).
Figure 6. Effect of simplified M&P on a specific project under less favorable market conditions than the example in Figure 5 Under full‐scale M&P, only projects larger than 18.3 kt CO2e/yr (S2 in Figure 6), or 1400 ha, will receive a positive benefit from the CDM. Projects under 17.7 kt CO2e/yr (S3), or 1350 ha, will be better off with the simplified M&P for small‐scale project activities. However, the advantage of simplified M&P is not sufficient to generate a positive net benefit for these projects, due to the 8 kt CO2e/yr restriction on the quantity of tCERs or lCERs that can be issued from these projects. This example shows that simplified M&P may not have any effect on small‐scale or medium‐scale projects implemented under the circumstances described above. Although these circumstances include an optimistic CER price assumption (US$ 6/tCO2e) and transaction costs (Factor 1), the minimum viable project scale is the same under simplified or full‐scale M&P. 3.2. When do simplified M&P change the game for small‐scale project activities? To answer this question we classified the results of the modeled project scenarios into three classes: 1. “No effect”: scenarios where the simplified M&P do not have any effect on the minimum viable project scale (see example in Figure 6). This situation is characterized by S1 > S2. 2. “Effects on medium‐scale only”: scenarios where simplified M&P decrease the minimum viable project scale of project removing more than 8 kt CO2e/yr and operating under simplified M&P, but do not have any effect on small‐scale project activities (see example in Figure 5). This situation occurs when S1 < S2 and S1 > 8ktCO2e/yr. If medium‐scale are not permitted to register under simplified M&P, these scenarios will be “no effect” scenarios. 3. “Effects on small‐scale”: scenarios where simplified M&P do have a positive effect on small‐scale projects. This only occurs when S1 < S2 and S1 < 8kt CO2e/yr.
On the basis of all 93 318 scenarios calculated with our model, Figure 7 illustrates the relative frequency of scenarios where the M&P have no effect, effect on medium‐scale only, and effect on small‐scale project activities. Because of the high number of scenarios, these relative frequencies can be interpreted as probabilities within the ranges of values assumed for model parameters. Figure 7. Frequency of scenarios where simplified M&P have an effect on the minimum viable project scale. Simplified M&P allowing a transaction cost reduction of 20% or 50% have an effect on small‐scale project activities in less than 2% of the scenarios, and an effect on medium‐scale in 25% of the scenarios. If simplified M&P allow a 80% reduction of the transaction costs, small‐scale project activities would be favored in less than 11% of the scenarios, and medium‐scale ones in 29% of the scenarios. These results show that medium‐scale project activities above the small‐scale definition will be the ones that are more likely to benefit from the simplified M&P. Scenarios where simplified M&P have an effect on the minimum viable project scale have in common to occur in favorable CDM context (high CER price and low transaction cost). Moreover, the projects favored by simplified M&P have generally a 60‐year long crediting period (20 years renewed twice). 3.3. Factors that facilitate the access of small‐scale project activities to the CDM Figure 8 shows effects of market, M&P and project type on the probability that a small‐scale project activity will benefit from the CDM.
Figure 8. Effect of market, M&P, and project type on the probability of small‐scale participation, with small‐scale defined as 8 kt CO2e/yr. External factors, such as transaction costs and initial CER price, are those that appear to have the greatest effect on the viability of small‐scale project activities. With low CER prices (US$ 3/tCO2e) or high transaction cost (Factor 3 or 5), less than 0.4% of the scenarios are viable for small‐scale project activities, even with simplified M&P. Of critical importance appears to be the rate at which simplified M&P will reduce transaction costs. If the reduction is around 20% or 50%, compared to full‐scale M&P, small‐scale project activities will not be much favored: the probability of viable scenarios increases from 2.8% with full‐ scale M&P to 3.5% with simplified M&P. Transaction cost must reduce substantially to have an effect on the probability of small‐scale participation: in Figure 8, the probability increases up to 10.7% when the reduction is 80%. Additional calculations showed that the probability would be 25.4% for a 90% reduction and 53.4% for a 95% reduction. Whether these cost reductions can be achieved without violating the principle of environmental integrity requires careful analysis. Some factors related to the CDM and decided by the project proponent have little effect on small‐scale participation, such as the carbon accounting method (lCER or tCER). In theory, if the discount rates used to calculate lCER and tCER prices (Annex I discount rate) and the NPV of the project (project discount rate) are the same, the two accounting methods are equivalent. Other factors may change this figure in concrete project circumstances. For instance, the project discount rate is generally higher than the Annex I discount rate. In this case, lCERs would generate higher present benefits than tCERs, but the difference does not affect much the probability of small‐scale participation (3.5% for tCERs and 4.6% for lCER). Similarly, the year of the first verification has low effect on small‐scale project participation. A first verification at year 7 is slightly more advantageous than at year 5 or 9 (this is not shown in Figure 8). By
contrast, a longer crediting period may favor small‐scale project participation (though the risk associated to longer crediting periods has not been taken into account in our study). Project internal factors, such as the type of activity and growth, do not change small‐scale participation when scale is defined in kt CO2e/yr. With a similar average net anthropogenic GHG removal curve, the minimum viable project area will be more or less inversely proportional to growth. As the minimum scale (in kt CO2e/yr) is proportional to the product of growth and minimum area, it presents little sensibility to the growth rate. The difference between pure forest plantation projects and agroforestry projects in Figure 8 is because the GHG removal curves of these two categories have different shapes (see Figure 1). Figure 9 shows the effects of project type on small‐scale participation but with small‐scale defined in terms of area (projects smaller than 500 ha). Faster growth facilitates the participation of small‐scale projects. Even with simplified M&P, almost no low‐growth plantation or agroforestry CDM project will be viable under 500 ha. Figure 9. Effect of project type on the probability of small‐scale participation, with small‐scale defined as 500 ha.
4. Discussion
In this paper, we used two examples of CDM‐AR projects to show different effects of simplified M&P on small‐scale and medium‐scale projects. In the first example, medium‐scale project activities and few small‐ scale benefited from simplified M&P. In the second one, simplified M&P did not have any effect on small‐ scale or medium‐scale projects. Taking into account all scenarios used in our model, we showed that the probability for a small‐scale project being favored by simplified M&P is less than 2% if the transaction cost reduction is 20 or 50%, and 11% if the reduction is 80%. Therefore, simplified M&P must allow a substantial reduction of transaction cost (e.g. for 80%) to have an effect on small‐scale participation.The effect of simplified M&P is significant for medium‐scale projects registered as small‐scale and operating under simplified M&P in at least 23% of the scenarios. Therefore, medium‐scale project activities above the small‐scale definition would be the ones that are more likely to benefit from simplified M&P. This demonstrate the interest of letting a project choose between full‐scale and simplified M&P. However, scenarios where simplified M&P have an effect on small‐scale or medium‐scale projects occurred in favorable CDM context with high CER price and low transaction costs, indicating that current CDM market conditions must improve to allow small‐scale and medium‐scale participation. Among CDM parameters to be decided by project proponents, a longer crediting period is likely to increase the viability of small‐scale projects, whereas the carbon accounting method (lCER or tCER) will have few effects, unless the price differentiation between tCERs and lCERs will be greater than assumed in our study. The results of our calculations are dependent on the parameter values used in the model. We believe that the range of values we used covers realistically the spectrum of possible project circumstances. Would we have used a different range of values to represent more optimistic or more pessimistic circumstances, the probabilities of small‐scale project viability would have changed, but the effect of simplified M&P and other parameters on the minimum viable project scale would have shown similar patterns to the ones identified in this study. The model results can be considered as conservative because the assumptions made about baseline, leakage and greenhouse gas emissions within the projects were conservative and because the definition of minimum scale was optimistic. Moreover, our model did not consider risk and measures associated to risk mitigation (buffers, insurances), particularly in the case of lCERs. With these factors taken into account, the minimum scale of viable projects would be higher, and the simplified M&P may not have any effect on small‐scale viability.
5. Conclusion
The definition of small‐scale projects refers to very different field situations. Our analysis suggests that the maximum area of a small‐scale project may vary from 200 to 6000 ha, depending on the project type and method used for measuring the scale of 8 kt CO2e/yr. Our analysis shows that simplified M&P are expected to have little effect (if any) on the viability of small‐ scale AR project activities in the CDM. Substantial reductions of transaction costs (e.g. 80%) and improvements of the price of expiring CERs are required for these simplified M&P to have an effect on small‐scale participation. A balanced trade‐off between simplifying M&P while maintaining environmental integrity will therefore be particularly difficult to find. If current market conditions persist, only large‐scale project activities will be able to participate to the CDM, even with simplified M&P for small‐scale project activities. If at least medium‐scale project activities shall be encouraged, the CoP‐9 definition of small‐scale should not be interpreted in a way that would require ex ante demonstration that net anthropogenic GHG removal by sinks will be less than 8ktCO2e/yr. As our calculations suggest, project activities removing more than 8ktCO2e/yr but selling tCERs or lCERs equivalent to 8 kt CO2e/yr are those that are more likely to benefit from simplified M&P. As net anthropogenic GHG by sinks of such project activities would be larger than what will be credited to them, the atmospheric GHG balance will benefit from these projects. Although this paper deals with forestry projects, a parallel may be made with energy project: we wonder whether simplified M&P will have an effect on the viability of small‐scale project activities in the energy sector. However, because the quantitative limit for small‐scale is higher for energy projects (15 kt CO2e/yr)than for forestry project and because energy project are not disadvantaged by the non‐permanence issue, simplified M&P may have more effects on energy projects than on forestry projects. Some estimates of transaction costs for small‐scale CDM energy projects given by Ellis et al. (2004) mean that a project will need to generate between 8 and 37 kt CO2e during its whole crediting period in order to cover its transaction costs, or between 0.8 and 3.7 kt CO2e/yr for a 10‐year long crediting period.
6. Policy Implications
From the point of view of environmental integrity, it may be better to let medium‐scale project activities to register as small‐scale, than to simplify M&P too much. In the context of the international discussion on M&P for small‐scale projects, it is prudent to remind that equity in the chance of participating to the CDM will not necessarily be achieved by simplifying M&P. Equity, poverty alleviation, and sustainable development will be achieved, first of all, by fair tCER or lCER prices, fair bills for international services that non‐Annex I countries have to pay to Annex I countries, fair CERs‐purchase agreements, and effective technology transfer and capacity building in developing countries. If all countries and regions as well as poor individuals and communities are to be given a chance to participate to the AR‐CDM with small‐scale project activities, complementary measures are necessary. Among others, these measures should focus on how to improve carbon‐trade relations between developing and developed countries. There is a big gap between the CER price and the cost of reducing the emission of 1 ton of CO2e in Annex I countries. This suggests that the demand and the price of CER could be quite above current values if adequate policy measures to regulate the market are taken. As transaction costs and CER price are the two most important factors affecting the possibility of small‐scale project activities to participate to the CDM, two alternatives can be considered for improving small‐scale participation: reducing transaction costs and improving the price of CERs. In addition to simplified M&P, a way to reduce transaction costs is to increase the participation of national consultants and firms in the design, validation, monitoring, and verification of CDM project activities, as the honoraries of international consultants and firms are usually more expensive. This could be achieved by an increase in national capacities through a greater commitment of Annex I countries to support capacity building in developing countries. For improving the price of CERs, supply must organize itself and broke the monopoly of the demand. Moreover, projects may look for market niches if they can demonstrate high quality, i.e. strong positive effects on livelihoods and biodiversity, though the size of such niche markets and their capacity to improve the price of CERs are still unknown. Demonstrated project quality may have a positive effect on the price of CERs if the investor can benefit from a positive public image. Another important criterion of good quality will be how the risk of reversing CO2 removals will be assessed and addressed at the project level, particularly in the case of lCER accounting. If lower transaction costs or higher CER prices can not be achieved, small‐scale AR‐CDM project activities will have to be bundled, registered under full‐scale M&P, and managed under an umbrella organization. The advantage of collectively dealing with small‐scale AR activities under an umbrella project is that technical, financial, and knowledge barriers can be overcome more easily, as they are addressed through and organization instead of through several individual farmers or small communities. New small‐scale plantations joining the umbrella project may also buffer the risk of failure of individual plantations, thus increasing the probability of permanent carbon storage in a region. However, this option may resultFor an Annex I credit buyer looking at credits from a pure business perspective, intrinsic permanence and low risk are important investment criteria. This may help umbrella projects to improve the price of tCERs or lCERs. While less dependent on the permanence of individual forest plots, the success of a CDM umbrella project is critically dependent on the long‐term viability of the umbrella institution. Project participants are required to commit to the umbrella project for a period of time not less long than the crediting period. The umbrella organizations must be capable to manage a number of small activities with low transaction costs. This requires good organization and management capacity, as well as good knowledge of both the local context and the international carbon market and its regulations. Such capacities are scarce in the developing world and stress again the need to reinforce the commitment of Annex I countries to support capacity building.