HAL Id: hal-03212290
https://hal.inrae.fr/hal-03212290
Submitted on 29 Apr 2021
HAL is a multi-disciplinary open access
archive for the deposit and dissemination of
sci-entific research documents, whether they are
pub-lished or not. The documents may come from
teaching and research institutions in France or
abroad, or from public or private research centers.
L’archive ouverte pluridisciplinaire HAL, est
destinée au dépôt et à la diffusion de documents
scientifiques de niveau recherche, publiés ou non,
émanant des établissements d’enseignement et de
recherche français ou étrangers, des laboratoires
publics ou privés.
Distributed under a Creative Commons Attribution - NonCommercial - NoDerivatives| 4.0
Flax shives-PBAT processing into 3D printed fluorescent
materials with potential sensor functionalities
Claire Mayer-Laigle, Laurence Foulon, Clément Denoual, Miguel Pernes, Eric
Rondet, Anthony Magueresse, Cécile Barron, Anouck Habrant, Alain
Bourmaud, Gabriel Paës
To cite this version:
Claire Mayer-Laigle, Laurence Foulon, Clément Denoual, Miguel Pernes, Eric Rondet, et al.. Flax
shives-PBAT processing into 3D printed fluorescent materials with potential sensor functionalities.
Industrial Crops and Products, Elsevier, 2021, 167, pp.1-11. �10.1016/j.indcrop.2021.113482�.
�hal-03212290�
Industrial Crops & Products 167 (2021) 113482
Available online 12 April 2021
0926-6690/© 2021 The Authors. Published by Elsevier B.V. This is an open access article under the CC BY-NC-ND license (http://creativecommons.org/licenses/by-nc-nd/4.0/).
Flax shives-PBAT processing into 3D printed fluorescent materials with
potential sensor functionalities
Claire Mayer-Laigle
a, Laurence Foulon
b, Cl´ement Denoual
c, Miguel Pernes
b, Eric Rondet
d,
Anthony Magueresse
c, C´ecile Barron
a, Anouck Habrant
b, Alain Bourmaud
c, Gabriel Pa¨es
b,*
aIATE, Universit´e de Montpellier, CIRAD, INRAE, Montpellier SupAgro, 2 Place Pierre Viala, 34060, Montpellier Cedex 02, France bUniversit´e de Reims Champagne Ardenne, INRAE, FARE, UMR A 614, 51097, Reims, France
cUniversit´e de Bretagne-Sud, IRDL, CNRS UMR 6027, BP 92116, 56321, Lorient Cedex, France
dUMR QUALISUD, University of Montpellier, CIRAD, Montpellier SupAgro, Universit´e d’Avignon, Universit´e de La R´eunion, 34090, Montpellier, France
A R T I C L E I N F O Keywords: 3D printing Flax Shives Milling X-ray microtomography Fluorescence A B S T R A C T
Incorporation of unused agricultural by-products into materials is a relevant strategy in developing biosourced and economically competitive products that limits the environmental impacts of plastics. Development of 3D printing techniques offers the possibility to design such biomaterials while bringing new functionalities, how-ever, it is critical to characterize and control both the plant material properties and the interactions between the plant material and the polymeric matrix during the whole process, from filament production to 3D printing. In this study, flax shives were selectively milled and then used as a starting material to be grafted to a fluorophore whose fluorescence varies under pH. The resulting fluorescent shives were processed with poly-(butylene-tere-phthalate) (PBAT) by extrusion to produce a filament reinforced with 10 %-wt of flax shives, which was the subsequently 3D printed. Extensive microstructural characterization (particle size and shape analysis, X-ray microtomography) demonstrated that the flax particles were homogeneously distributed into the 3D printed material. Despite the relatively low content of fluorescent flax shives in the final 3D printed material (1%-wt) and successive heating stages (during extrusion and 3D printing), a strong fluorescent emission could still be measured. This work paves the way for using fluorescent flax shives as reinforcements into composites, thus making 4D materials with potential applications as sensors depending on the fluorophore used.
1. Introduction
Reducing the environmental impact of human activities is one of the main challenges for the transition to a bioeconomy. In particular, effi-cient use of natural resources, reducing post-harvest losses and decreasing the quantity of plastic materials have been identified as le-vers for this transition.. In this context, the use of additive manufacturing of thermoplastic polymers reinforced with plant mate-rials represents a relevant alternative which has been recently
investi-gated (Badouard et al., 2019; Bahçegül et al., 2020; Kariz et al., 2018; Le
Guen et al., 2019; Zeidler et al., 2018). This technique not only allows for the design of new materials that would be impossible to obtain using subtractive approaches but also contributes to the reduction of plastic
waste (Le Guen et al., 2016; Montalvo Navarrete et al., 2018). One of the
remaining challenges is to controlling the functionalities and durability of the resulting products. It has been recently demonstrated that such
composites can be used in a variety of 3D printing techniques such as
Fused Deposition Modelling (FDM) (Le Duigou et al., 2016; Montalvo
Navarrete et al., 2018) or jet binding (Zeidler et al., 2018).
By combining the properties of plant materials and the printing orientation, 4D printing makes it possible to add new product
func-tionalities, such as hydromorphic properties (Bi et al., 2018; Le Duigou
et al., 2016), electrical conductivity (Shao et al., 2018) or even the
degradation of a polymer (Le Guen et al., 2017; Muniyasamy et al.,
2013; Ndazi and Karlsson, 2011). One key point in building a well-designed object via additive manufacturing with high precision is the small printing nozzle size (generally about 0.4 mm) that requires the use of fine particles. In this case, reinforcing particles with a median size
(d50) less than 20 μm and a maximum size (d90) below 200 μm are
targeted (Kukla et al., 2017). This means that an intense milling step is
required to obtain particles generally below the cellular scale (ca.
50 μm). In particular, a greater reactivity can be obtained through
* Corresponding author.
E-mail address: [email protected] (G. Pa¨es).
Contents lists available at ScienceDirect
Industrial Crops & Products
journal homepage: www.elsevier.com/locate/indcrop
https://doi.org/10.1016/j.indcrop.2021.113482
intense particle size reduction, and can be exploited for the grafting of molecules. Previously, the grafting of biofibres has been explored to enhance the compatibility between plant fibre and the polymeric matrix
in biocomposite materials (Müller et al., 2019). Grafting could also be a
way to improve the performance of the biomass powder for different
applications, such as the improvement of adsorption capacity for Cd2+
and Pb2+by grafting biomass powder with polyamic acid (Yu et al.,
2007). In a similar way, a plant biomass powder grafted with
fluo-rophore could react to a mechanical or environmental stress (tempera-ture or pH variation). By incorporating it into a polymeric matrix and using additive manufacturing techniques, this could pave the way for
the design of specific sensors (Bosch et al., 2005).
Performance and functionalities of the biocomposite materials also
depend on the type and proportion of added biomass particles (Ndazi
and Karlsson, 2011). Mechanical properties of the printed object can be affected by the weak compatibility between the polymer matrix, the plant particle-polymer interface, low pressure during 3D printing extrusion stage and possible printing defects related to the quality of the
dispersion of the plant particles in the matrix (Montalvo Navarrete et al.,
2018). These defects generally increase with the biomass content, so a
higher porosity is often observed in the materials compared to standard
manufacturing techniques such as injection moulding (Badouard et al.,
2019). This porosity could be seen either as a limitation if mechanical
properties similar to those obtained by injection are targeted or rather as an asset, when it is controlled, to manage the response of the object to an environmental stimulus (e.g. humidity, temperature). For example, a high porosity will favour the reaction of a sensor to an environmental variation and could accelerate the degradation of the polymeric matrix by the activation of the biomass reinforcement due to water sorption (Ndazi and Karlsson, 2011).
Among the plant biomass previously explored for 3D printing
fila-ment manufacturing, flax has proved its technical interest (Badouard
et al., 2019; Le Duigou et al., 2016), by using scutched fibres or shives. Shives, which are the plant woody core removed during flax processing, are especially interesting due to their very low cost and large availability (Bourmaud et al., 2018). Flax shives come from the xylem tissue of the plant, and ensures both sap conduction and mechanical stability of the
flax stem (Goudenhooft et al., 2019). Their biochemical composition
differs from fibres, as they are high in both xylan and lignin and have a reduced cellulose content. But interestingly, they offer a strong potential for mechanical reinforcement when they are mixed with thermoplastic
polymers (Nuez et al., 2020). Previously, our group incorporated milled
flax shives in biodegradable matrices for 3D printing filament
manufacturing.,(Badouard et al., 2019; Le Duigou et al., 2016).
In this article, we focus on preparing fluorescent flax shives to confer new functionalities to biocomposite materials. The overall goal was to prepare fluorescently-grafted flax shives and turn them into a filament suitable for 3D printing. Deep structural characterization was performed along the different process steps to ensure that the fluorescence and structural properties of the materials could be controlled and designed, so that it could serve as a sensor to indicate variations of pH by selecting an appropriate fluorophore.
2. Materials and methods
2.1. Materials 2.1.1. Polymer
For this study, poly-(butylene-terephthalate) (PBAT) Ecoflex® F Blend C1200 (BASF, Germany) was used. It exhibits a density of 1.21 g/
cm3, a glass transition temperature (Tg) of 30 ◦C and a melt temperature
of 110− 115 ◦C. The processing temperature of this polymer is 150 ◦C
and its melt flow index (MFI at 2.16 kg and 190 ◦C) is 2.7–4.9 g/10 min.
2.1.2. Flax shives
The flax shives used in this study were provided in bulk by the flax
scutching company Van Robaeys Frères (France) following the scutching of the 2018 flax harvest year. Compared to bast fibres, flax shives composition mainly differs by xylose (16.2 ± 0.6 %), lignin (27.6 ± 1.1 %) and glucose (31.3 ± 1.1 %) content, this latter being representative of the sample’s content in cellulose which is around 70 % for flax bast
fi-bres (Nuez et al., 2020). The flax powder used was prepared with a
milling process including three milling steps. First, raw flax shives were milled with a knife mill SM 300 rotating at 3000 rpm (Retsch Mühle, Germany) equipped with a grid with a mesh size of 2 mm. Then they were subjected to a second milling step in an UPZ100 (Hosokawa Alpine,
Germany) rotating at 18 000 rpm with a mesh size of 300 μm. The
powder obtained was subsequently dried in an oven at 60 ◦C for 24 h in
order to reach a water content of 2.4 % (w/w). Finally, the dried powder was subjected to a third milling step in an attrition beads mill. This powder of flax shives is therefore mentioned as FS.
The equipment employed is a laboratory prototype, composed of a milling chamber of 3 L in which 200 g of the powder and 7.5 kg of small steel beads (6 mm) are put in motion by a rotor at 300 rpm. The milling time (80 min) was determined such that at least 90 % of micronized
particles had a diameter below 50 μm (d90 <50 μm). Four batches of
200 g were realized and pulled to produce 800 g of FS powder.
2.2. Grafting of flax shives
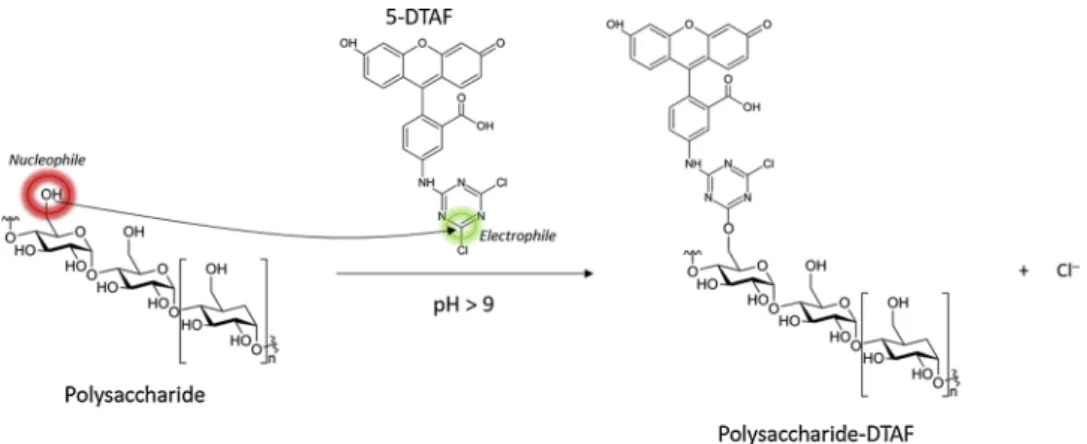
Flax shives contain ca. 47 % of glucose and xylose moieties (con-tained in cellulose and hemicelluloses, respectively, see composition above), which means that there is a large quantity of free hydroxyl groups accessible. FS could then be grafted to 5-(4,6-dichlorotriazinyl)- aminofluorescein (5-DTAF) (Life Technologies, Saint-Aubin, France), a fluorescein-isothiocyanate (FITC) derivative that can react covalently
with hydroxyls found in polysaccharides at pH > 9 (Abitbol et al., 2013;
Helbert et al., 2003; Pa¨es et al., 2013) following the reaction in Fig. 1. The detailed reaction mechanism involves nucleophilic aromatic sub-stitution by an addition-elimination pathway. Briefly, pH > 9 allows ionization of the most acidic hydroxyl groups of polysaccharides which then behave as nucleophilic groups that can attack the electrophilic carbon bearing a chlorine, which is a good leaving group in a triazine ring. This finally leads to the formation of a covalent ether bond. The same reaction might occur on phenolic hydroxyl groups in lignin.
FS were mixed with 5-DTAF at different ratios in 100 mM carbonate buffer at pH 10.0. The reaction mixture was left for 24 h under magnetic stirring at room temperature, extensively centrifuged (4 times during 5 min at 16,994 × g) and washed against triple-distilled water to get rid
of 5-DTAF in excess, oven dried at 40 ◦C overnight and stored at room
temperature. This material is designated thereafter as fluorescent rafted flax shives (FG-FS). As a control, composition of FS was evaluated when in contact with carbonate buffer in the same conditions as those of the
grafting reaction: in comparison to native FS (see section 2.1.2), glucose,
xylose and lignin content evolved by + 2.3 %, + 3.1 % and − 2.1 %, respectively, which is not significant given the measure uncertainty, indicating the absence of modifications.
Nitrogen content determination was performed with milled samples
oven-dried overnight at 80 ◦C, and 5–7 mg were weighted in tin capsule.
Capsules were analysed using a EURO EA elemental analyser (Euro-vector, Milan, Italy) equipped with a thermal conductivity detector. The
samples were fully oxidised and nitrogen was converted into N2 and
quantified using the Eager 200 software (Carlo Erba, Italy).
2.3. Preparation of filament and FDM
2.3.1. Preparation of filament and tensile specimens
FS, FG-FS and raw PBAT were dried for 15 h at 50 ◦C and 30 ◦C,
respectively, prior to extrusion to remove water. Two formulations were prepared: PBAT with 10 %-wt FG-FS and PBAT with 10 %-wt FS. For the first one, FG-FS was previously mixed manually with FS with a ratio of 1:9. First, all batches were compounded with a twin screw extruder
(TSA, Italy) at 20 rpm and 165 ◦C for PBAT composites; both polymer
and FS powder were introduced at the beginning of the extrusion screw. The extruded composites were then granulated to make pellets, which
were then dried for 15 h at 50 ◦C prior to being extruded. To produce the
filament, a single screw extruder (L/D = 20, D = 20 mm, die diameter = 4 mm) was used (Scamex, France) with process conditions of
20 rpm and 165 ◦C. Filament thickness was controlled and adjusted to
2.85 ± 0.1 mm with a controlled diameter using an ODAC® 18XY dual axis laser measuring head (Zumbach, Switzerland) with correcting ac-tion on the pulling speed. In addiac-tion, after the compounding stage, the
extruded raw PBAT and PBAT-FS pellets were dried one night at 50 ◦C
and then injected to produce tensile specimens with a Battenfeld HM 80/ 210 injection press.
2.3.2. 3D printing of pieces by FDM
All processing steps are summarized in Fig. 2 from compounding to
3D printing. Objects were then printed with filaments prepared with both formulations (PBAT-10 %-wt FS and PBAT-10 %-wt FG-FS) on a Ultimaker 3 extended fused deposition modelling printer (Ultimaker, The Netherlands) fitted with a 0.8 mm die nozzle. The printer was controlled by the Ultimaker cura 4.6.1 software. The platform
temper-ature was set at 55 ◦C and the nozzle temperature at 190 ◦C based on
0.2 mm layers thickness and no strand overlap. The filling rate was set to
100 % with an octahedral pattern. Two simple-geometry samples were printed: a right parallelepiped (20 mm × 10 mm × 5 mm) and a hollow
right parallelepiped (15 mm × 5 mm × 2 mm) (Fig. 2a & b). Complex
objects (articulated wings of a dragon and dragonflies) were also printed for testing more challenging shapes in order to highlight the potential of
these filaments (Fig. 2c & d). Then, tensile specimens made of PBAT-FS
were printed with a rectilinear filling pattern (100 %) oriented at 0◦with
respect to the tensile orientation. The printing surface temperature was
maintained at 55 ◦C for all aforementioned prints.
2.4. Characterization of samples 2.4.1. Mechanical properties
Tensile specimens were conditioned at room temperature (23 ◦C and
48 % relative humidity) and characterized using MTS Synergie RT/1000 tensile machine with a 10 kN sensor according to the ISO 527 standard. These tests were realized using an extensometer (gauge length = 25 mm) and at crosshead speed of 1 mm/min and 50 mm/min for PBAT-FS and raw PBAT specimen, respectively. Five dog bone specimens (180 × 10 × 4 mm) were analysed for each batch and average values of Young’s modulus and strength at max were calculated.
Fig. 1. Chemical reaction occurring during grafting between 5-DTAF and polysaccharides contained in FS.
2.4.2. Fluorescence properties
FG-FS were characterized as disks (circular tablets) and prepared with 150 mg of material pressed for 5 min under a pressure of 10 tonnes. Fluorescence emission was measured for a range of fluorescent excita-tions using spectrofluorometer (Jasco FP-8300, Lisses, France). 3D spectra acquisition parameters were as follows: range (precision) for excitation and emission were 350–550 nm (2 nm) and 450–610 nm (0.2 nm), respectively; excitation and emission bandwidth were 2.5 nm; scan speed was 1000 nm/min; response was 0.2 s; voltage was 380 V. Spectra acquisition was performed using Jasco Spectra Manager soft-ware. For ageing measurements, disks were kept in a dark room under
control temperature (22 ◦C) and analysed when necessary. Impact of
temperature on fluorescence intensity was performed by placing the disk between heating plates at the desired temperature and time, then by measuring directly after its fluorescence emission intensity.
Fluorescence of 3D printed materials was measured with Axio Zoom V16 microscope (Zeiss, Goettingen, Germany) using LED source with 450− 490 nm fluorescence excitation filter and 500− 550 nm fluores-cence emission filter, exposition time was 850 ms. For native or mixed particles fluorescence analysis, exposure time was 400 ms using similar filters.
2.4.3. Particle size distribution
The particle size distribution (PSD) of the FS and FG-FS powder was measured by a laser diffraction granulometer Mastersizer 2000 (Mal-vern, UK) equipped with the Hydro 2000S system. First direct mea-surement was carried out on the powder dispersed in ethanol (96 % v/v) to evaluate the apparent size of the powder. Then, 3 min of ultrasonic treatment was applied using the ultrasonic deagglomeration system of the Mastersizer Hydro 2000S. The probe power was set to 100 % (75 W). The suspension was then stirred at 3000 rpm during 5 min to remove remaining bubbles prior to the measurement of the desagglomerated size of the powder. The refractive index of wood sawdust (1.53) was used to proceed with the data and results are expressed in volume. The
mean particle size (dm), the 10th (d10), 50th (d50) and 90th (d90)
percentile, and the Specific Surface Area (SSA) were extracted from the PSD. All measurements were carried out in triplicates. Mean value and standard deviation were determined.
2.4.4. Shape factor
A granulomorphometer MORPHOLOGI 4 (Malvern, UK) was used to measure the particle shapes by image analysis. The analysis consists in an automatic acquisition of particle pictures thanks to specific optical lenses which are selected according to the size of the particles to analyse. After defining a threshold, several shape factors may be calculated by the related software. For their analysis, the powders were dry dispersed on a glass plate using the SDU module with an air pressure of 4 bar and an injection time of 10 ms. Measurements were made with a magnifi-cation of 10 × . A Z-stack of 3 images was acquired (corresponding to a
total height of 24.4 μm). This method involves taking images at 3
different levels and rebuilding a sharp image of each particle, even in the case of polydisperse particle size distribution and thick particles. Only
particles with a diameter greater than 1.5 μm were considered. Indeed,
for smaller particles, the number of pixels by particles analysed, with a magnification of 10×, does not allow the determination of precise shape factor. For each powder sample, at least 80,000 particles were analysed in order to have a statistically representative sample. The aspect ratio and high sensitivity (HS) circularity were calculated according to the Eqs. (1) and (2):
aspect ratio =W
L (1)
where W and L are the maximum width and length of the particle respectively and
HS circularity =4π×area
perimeter2 (2)
where the area and perimeter refer to particles characteristics. A perfect circle has an HS circularity of 1.0 while a narrow rod has an HS circu-larity close to 0. The mean aspect ratio and mean HS circucircu-larity were calculated for the whole set of particles analysed by the software and are taken as indicators.
2.4.5. Scanning electron microscopy
Powder observations were also performed using a SEM (JSM- IT500HR) from JEOL (Tokyo, Japan) at an acceleration voltage of 3 kV and a gold sputter coating was applied using a sputter coater (Scan-coat6) from Edwards company (Stockholm, Sweden).
2.4.6. X-ray microtomography (μCT) scanning, reconstruction and
parameters analysis
2.4.6.1. Sample preparation. X-ray microtomography was performed on
the 3D printed FS and FG-FS right parallelepipeds. In order to use the best possible resolution and to reduce the scanning time, the parallele-piped was not scanned through in its entirety. A 2 mm thick slice was cut frontally along the longest axis of the sample. The size of the sample
analysed by X-ray microtomography was therefore
2 mm × 5 mm × 10 mm.
2.4.6.2. Image acquisition. The samples were scanned in the SkyScan
1272 X-rays microtomograph (Bruker μCT, Kontich, Belgium) without
filter at a pixel size of 1.5 μm with an applied X-ray tube voltage of 34 kV
or 38 kV and a source current of 227 μA or 242 μA for PBAT-10 %-wt FG-
FS objects and PBAT-10 %-wt FS objects, respectively. Camera pixel
binning was set to 1 × 1. The scan orbit was 180◦with a rotation step of
0.2◦.
2.4.6.3. Image reconstruction. Reconstruction was carried out with a
modified Feldkamp algorithm (Feldkamp et al., 1984), using the
Sky-ScanTM NRecon software accelerated by GPU (Yan et al., 2008).
Gaussian smoothing, ring artefact reduction and beam hardening correction were applied.
2.4.6.4. Image analysis. Volume of interest selections (sample volume),
segmentations to binary and morphometric analysis of the samples were all performed using SkyScan CT-Analyser (“CTAn”) software. Image segmentation to binary was carried out thanks to a global segmentation algorithm. Morphometric parameters in 3D (porosity, pores and
parti-cles size) were based on analysis of a Marching Cubes (Lorensen and
Cline, 1987) type model with a rendered surface. Particle and pore size in 3D were calculated using the local thickness or “sphere-fitting”
(double distance transform) method (Borgefors, 1996; Remy and Thiel,
2002). Note that for the porosity, this analysis makes it possible to
distinguish between closed porosity and open porosity. Contrary to open porosity, closed porosity is the porosity embedded in the polymer with no contact with the environment.
2.4.6.5. 3D model construction. Surface-rendered 3D models were
con-structed for 3D viewing analysed regions, using SkyScan CTVolume (“CTVox”) software. Model construction was carried out by the “Double
time cubes” method (Bouvier, 2000), a modification of the Marching
cubes method (Lorensen and Cline, 1987).
3. Results
3.1. Grafting of flax shives and characterization
flax samples (fibres or shives) has been previously carried out. Due to the abundance of hydroxyl groups present in the polysaccharides contained in the shives and based on our previous experience on grafting proteins
and hemicelluloses (Fong et al., 2016; Pa¨es et al., 2013, 2015), a ratio
range of 100–2000 (w/w) between flax shives (FS) and 5-DTAF was tested over a 24 h reaction time. Such a large ratio was selected because it represents a sufficiently large range to assess the impact of grafting ratio on the fluorescence emission for the resulting fluorescent grafted flax shives (FG-FS). Also, these conditions were proposed because due to the presence of insoluble flax shives, reaction is due to happen hetero-geneously and could occur more slowly and efficienly than with soluble polymers. In order to demonstrate the grafting of the fluorophore, FT-IR was used. But given the relative very small ratio between the fluo-rophore and polysaccharides, bands corresponding specifically to 5-DTAF could not be detected. Elemental analysis was thus performed to quantify nitrogen (Supplementary Table 1) since 5-DTAF contains 4 nitrogen atoms and could be a marker of the presence of the fluorophore. Results indicate that nitrogen content is increased by at least 70 % be-tween FS and grafted FS. Importantly, colour and fluorescence analysis was evaluated. The visible colour of flax samples as disks are presented in Supplementary Fig. 1 and shows a more intense orange hue with increasing 5-DTAF content. Fluorescence emission was measured for a range of excitation wavelengths from 350 to 550 nm (representative
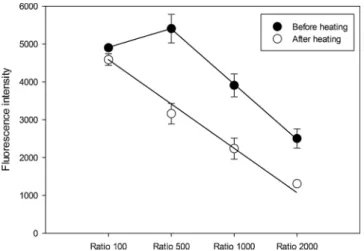
fluorescence spectra are presented in Supplementary Fig. 2). Fig. 3
shows how fluorescence emission intensity varies depending on the FS / 5-DTAF ratio: intensity is maximal for a ratio of 500, is similar for ratios of 100 and 1000 and decreases by only two-fold for ratio of 2000. Ungrafted FS have a negligible fluorescent emission (data not shown). Interestingly, fluorescence intensity is not proportional to the ratio. A hypothesis is that for a higher ratio than 500 (100), quenching of fluo-rophores might decrease the fluorescence emission, while for lower ra-tios (1000 and 2000), lower fluorophore content decreases fluorescence emission.
To mimic the impact of the extrusion stage, an 8-min heating cycle was applied to the samples; this duration being representative of the cumulative extrusion time of compounding, filament manufacturing and
3D printing step. A temperature of 165 ◦C was chosen to be consistent
with the conditions of compounding and filament manufacturing. One can notice that the 3D printing extrusion temperature is slightly higher, but due to the very short residence time (estimated at a few seconds) of the material in the printer screw, this small temperature difference is considered negligible. Results show that fluorescence intensity is largely
decreased, except at a lower ratio of 100 (Fig. 3). In this case,
fluores-cence intensity seems to have a linear relationship with respect to
grafting ratio.
Ageing experiments were performed on the same FS and FG-FS
samples after 3 and 6 months (Fig. 4): in comparison to native
ples, results indicate a good stability of fluorescence intensity for sam-ples with ratio 100 while average losses of 40 % intensity after 3 months and of 45 % after 6 months are observed for higher ratio values. Importantly, the decrease in intensity occurs mainly after a few months and does not seem to evolve much after 3 months.
Overall, both a moderate heating and ageing lead to a fluorescence decrease of FG-FS, but a strong fluorescence signal is still present. Also, selecting a high ratio of 100 does not result in an important fluorescence loss. Given these results, only one ratio was conserved for subsequent characterization, extrusion and FDM. Ratio 500 was considered as the most relevant choice, having a good balance between fluorescence in-tensity (needed for final material sensitivity) and a pretty low grafting ratio (proposing a process with a realistic cost).
3.2. Impact of grafting on physical properties of flax shives
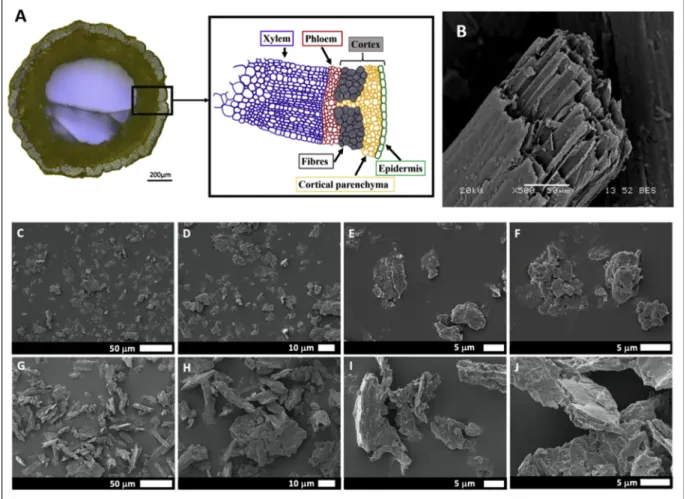
Fig. 5 shows scanning electron microscope (SEM) images of FS before and after fluorophore grafting. First, it appears that the milling intensity
of FS was very high and led to a particle size of about 20− 30 μm
(Fig. 5C). The initial structure of the xylem (Nuez et al., 2020) (Fig. 5A, B) is no longer visible at all and the corresponding cells have been
destructured by intensive milling (Fig. 5D to F). The only remaining
particles that can be assimilated to fines have reduced shape factors. These particles seem to be some fragments of cell walls. After grafting, the SEM highlights that the FG-FS particles are bigger than the ungrafted particles (FS). This could be explained by agglomeration phenomena, probably induced by modifications of surface properties and surface deposition of fluorescein, which can potentially increase interactions between particles through hydrophobic interactions. This phenomenon is visible whatever the degree of magnification or the areas of the sample
considered (Fig. 5G to J).
FS and FG-FS samples were also analysed through particle size
dis-tribution by measuring several indicators (Fig. 6). As observed by SEM
(Fig. 5), the milling process effectively reduced the size of raw flax shives. Before deagglomeration, in the case of FS, the apparent median
particle size was approximately 13 μm and the d90, giving indication
about the size of the coarser particles, was less than 50 μm. Thus, the size
of FS powder seems to be compatible as a reinforcement for composite
intended to FDM which requires particle size below 200 μm. However,
as observed in the SEM analysis, the apparent size of FG-FS is
signifi-cantly greater than that of FS: indeed, dm and d90 are nearly doubled
Fig. 3. Fluorescence intensity of FG-FS at different grafting FS / fluorophore
ratios, in native conditions (filled circles) and after heating (165 ◦C for 8 min; empty circles). All measurements are done in triplicate, some standard de-viations are weak and so not visible.
Fig. 4. Fluorescence intensity of flax shives at different grafting flax shives /
fluorophore ratios, in native conditions (filled circles), after 3-month ageing (empty squares) and 6-month ageing (empty diamonds). All measurements are done in triplicate.
(Fig. 6). When an ultrasonic treatment is applied prior to the particle size
measurement, a significant decrease of the d90 was observed: − 36 % and
− 61 % for FS and FG-FS, respectively, reflecting a strong trend to
agglomeration for both powder but reinforced in the case of FG-FS (Fig. 6). Agglomeration of powder appears when the interparticle forces (capillarity, van der Waals and electrostatic forces) are higher Fig. 5. Cross section of a flax stem with details of the internal structure (A), xylem tissue where FS originates is highlighted. SEM observations of a raw flax shives
(B), FS (C, D, E & F) and FG-FS (G, H, I & J) for a range of magnifications. (A) is adapted from Baley et al. (Baley et al., 2018).
than gravity force. Lignocellulosic powders have a strong tendency to agglomeration phenomena due to their complex chemical composition and high water sensitivity which reinforces the intensity of interparticle
forces, related to their low density (Karinkanta et al., 2018;
Mayer--Laigle et al., 2018). Previous work has demonstrated that several types of agglomeration may be observed: soft agglomeration, which can be evidenced using simple ultrasonic treatment as realized in this work, and
hard agglomeration leading to strong clustering of powder (
Rajaonar-ivony et al., 2019). In the case of FS and FG-FS, deagglomeration after the ultrasonic treatment demonstrates an important soft agglomeration. This one is more marked in the case of FG-FS and might be reinforced by the presence of the fluorescein-based fluorophore. Such an aromatic
molecule (Fig. 1) could favour hydrophobic interactions through π-π
stacking, thus attracting polysaccharide (cellulose and hemicelluloses) chains where they are grafted. Van der Waals forces could also be significantly reinforced leading to a higher agglomeration. The persis-tent difference between the size of FS and FG-FS could be explained either by the loss of very fine powder during the grafting process or by a hard agglomeration in the case of FG-FS that cannot be revealed by the ultrasonic treatment applied in this case.
The mean aspect ratio measured for FS and FG-FS was
0.678 ± 3.10−3 and 0.65 ± 5.10-4 respectively (Supplementary Table 2).
These values are consistent with the work of Domokos et al. (Domokos
et al., 2015) who demonstrated by numerical simulation that the aspect ratio towards which particles from isotropic materials are tending dur-ing the comminution process is 0.66. Thus the three milldur-ing steps employed for FS preparation reduced significantly the anisotropic properties of raw FSs. The values of HS circularity (Supplementary Table 2), which expresses the deviation of the particles from a sphere,
were measured at 0.781 ± 4.10-4 and 0.798 ± 5.10−3 for FS and FG-FS
respectively. The higher value obtained for FG-FS confirmed that higher agglomeration of FG-FS favoured an increased particle circularity (Rajaonarivony et al., 2019).
3.3. FDM manufacturing and characterization of compounds and FDM samples
Previous work from our group (Badouard et al., 2019) has evidenced
that low fibre content, such as experienced in this study may be a po-tential issue when a soft matrix such as PBAT is used. Nevertheless, the choice of PBAT is here justified by the use of stiff particles reinforce-ment. Indeed, the incorporation of FS enables to significantly reduce the softness of the filament, making it well suited to 3D printing, without being too brittle or inducing irregularities during filament extrusion which can penalize automatic diameter monitoring during the extrusion stage. Potential induced porosities can also have a strong impact on 3D printing process and filament deposition but also on in-service proper-ties of the designed part and especially mechanical behaviour. To improve the compound quality and especially the homogenisation and dispersion of milled shives within the polymer matrix, a task has been dedicated to the FS dosing stage. A specifically designed dosing system, equipped with two large thread depth screws, was used and carefully calibrated.
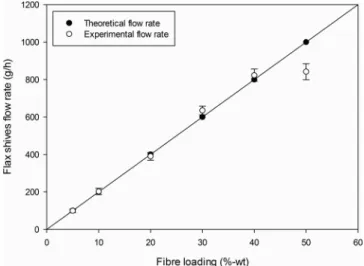
Fig. 7 provides a comparison between the theoretical FS flow rate and the use of the automatic dosing system, with a precise monitoring of incorporated FS weight. This experiment was done with a constant compound flow rate of 2 kg/hr. It clearly evidences a strong correlation between theoretical and experimental flow rate until a fibre weight fraction of 20 %. After this threshold, cavitation was observed in the dosing screws and does not enable a good stabilization of the FS feeding. However, the preliminary extrusion step in twin screw extruder, the optimization of the dosing method improving the homogenisation and the relatively low filament extrusion speed (18 rpm), contributed to a
stable and regular process (Fig. 2). Filaments obtained exhibited few
defects, but some variations in their diameters were observed. In addi-tion, despite the low 10 % FS and FG-FS content, the filaments were still
soft due to PBAT properties. These two observations led to some issues for regularly feeding the extrusion nozzle during the 3D printing pro-cesses, especially in the case of FS filaments. During the FDM process, a cracking sound could be heard, and a slight odour was smelt. These were
attributed to the passage in the nozzle at 190 ◦C of FS and FG-FS particles
which can be slightly torrefied on the surface, even if the residence time is very short. This torrefaction could generate a small gas release of biomass extractables and could induce a micro porosity. To address the efficiency of our manufacturing process, mechanical properties of the injected raw PBAT (PBAT-INJ) and of the compound containing shives (PBAT-FS-INJ) were assessed and compared with the performances of the 3D printed compound (PBAT-FS-I3D).
Fig. 8 shows the tensile Young’s modulus and strength at max values. Interestingly, a significant reinforcement is achieved when FS are added in comparison to raw PBAT, whenever injected or printed specimen are considered. When injected and printed parts are compared, Young’s modulus and strength exhibit a moderate decrease for printed samples, of − 17.8 % and − 5.2 %, respectively, probably due to the porosity level. This point is addressed and discussed in the next section.
3.4. Microstructural characterization
Volume reconstruction of sections of 3D printed FS (Fig. 9A) and FG-
FS (Fig. 9B) right parallelepiped were imaged by tomography and evi-denced the presence of particles within the PBAT polymeric matrix. From a qualitative point of view, images show a homogeneous distri-bution of FS or FG-FS within the polymeric matrix. The process pa-rameters selected for the extrusion, granulation and 3D printing process did not generate segregation as it can sometimes be observed when granular materials are processed. These observations validate the suc-cessful dispersion of the powder inside the polymeric matrix during the
compounding and the filament preparation (steps 2 and 3 in Fig. 2) and
confirm that a regular feeding was obtained despite the difficulty
generally observed for such fine powder (Barletta et al., 2015). Thus
FG-FS led to a homogeneously distributed fluorescence into the com-posite material.
From a quantitative point of view, Table 1 highlights only slight
differences between FS or FG-FS regarding the diameter measured with
laser diffraction and μCT measurements. The mean size measured for FS
and FG-FS are 15.7 μm and 15.4 μm respectively. As FG-FS have been
previously blended to FG with a ratio of 1:9 before being introduced in PBAT, it seems rational that the value of the mean diameters measured for FG and FG-FS are very close. Furthermore, these values are very
similar to the mean diameter of FS measured by laser diffraction (Fig. 6,
apparent dm = 20.1 μm; deagglomerated dm = 14.5 μm). More
Fig. 7. Comparison between experimental and theoretical FS flow rate during
information on the particle size distribution of FS or FG-FS within the PBAT matrix can be found in Supplementary Fig. 4. Concerning FS or FG-FS content within the matrix, X-ray microtomography acquisitions make it possible to measure a massic percentage of FS and FG-FS of 7 % when the FS or FG-FS really introduced is 10 %.
In the volumic images (Fig. 9), colour bars on the left indicate the
size range of particles measured. In both cases, FS and FG-FS are well scattered in the matrix whatever their size is. Some coarser particles are evidenced (in red) and may be related to agglomerates of particles as discussed previously.
Slight differences between physical measurements (particle size
distribution and mass content) and μCT characterization of FS or FG-FS
lie in the fact that μCT is a method that relies on the difference in density
between phases. The higher the density difference, the more easily the
grey level between phases can be segmented by the threshold algorithm. In our experiments where organic materials are considered, the value of FS (1.48) or PBAT (1.26) density are really close and some grey levels belong indiscriminately to the two phases making the composite. The threshold algorithm fails in segmenting more precisely the two phases to reach the values obtained after FS or FG-FS physical measurements. Moreover, the difference observed is negligible when considering the
pixel size of 1.5 μm. Thus, the mean diameter measured by X-ray
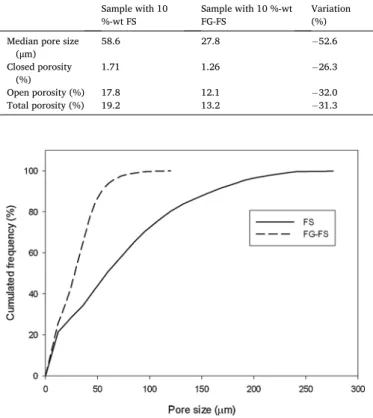
microtomography and the mass content of FS and FG-FS are in the same order of magnitude. This underlines the potential of this methodology to follow the dispersion of plant reinforcements inside a polymeric matrix. The closed, open and total porosity and median pore size were also
measured using X-ray microtomography and are summarized in Table 2.
The total porosities are 19.2 % and 13.2 % for FS and FG-FS objects, respectively, the open porosity taking an important part in the total porosity. However, as the objects observed with tomography are cross sections, this open porosity has been partly created by the sample cutting.
Similarly, the median pore size of FS is twice that of FG-FS. Such a higher value can be mainly explained by the higher proportion of coarser pores as evidenced in the cumulative distribution of pore size in
Fig. 10. Porosity seems to be quite high. However, it is in the same range Fig. 8. Tensile Young’s modulus and strength at max values for injected raw PBAT, injected PBAT-FS and 3D printed PBAT-FS.
Fig. 9. Volumic distribution of particles in FS (A) and FG-FS (B) samples according to their size. Table 1
μCT characterization of FS or FG-FS within PBAT matrix.
μCT measurements Laser diffraction
Mean diameter (μm) FS 15.7 20.1
as other values of fibre composite objects obtained by 3D printing. For example 3D printed composite samples reinforced with 30 % of short carbon fibre showed significant void formation (~20 %), as shown by
Wang et al. (Wang et al., 2017). Similarly, a porosity content between
27.1 % and 47 % was observed for thermomechanical pulp fibres (from fibre wood) fibre varying from 10 % to 20 % by weight in a BioPE matrix (Wang et al., 2017).
In the literature, the open porosity is sometimes related to processing defects during filament deposition. This can be most probably related to some factors such as the thermal mismatch during filament deposition (linked in turn to printing speed), surface roughness of the printed part, lack of adhesion among layers which becomes more critical when printing in z direction and conduct to larger dimension of pores, etc. (Rinaldi et al., 2018). In our case, the important variation observed between FS and FG-FS objects concerning the open porosity (variation of 32 %) may be explained by the issues experienced during the 3D printing
process described in section 3. The coarser pores observed in case of FS
could be assimilated to lack of adhesion among layers for the FS-filament.
The closed porosity is more related to the intrinsic properties of the
materials and in case of plant fibre reinforced composite may be strengthened by lack of interfacial adhesion between plant powders and
the polymeric matrix (Le Duigou et al., 2016). In this work, it also can be
related to the cracked sound heard during the 3D printing process and the formation of small bubbles related to the release of extractives components from fibres. Overall, we can hypothesize that the variation in closed porosity between FS and FG-FS may be explained by a better compatibility of FG-FS with the PBAT due to the grafting process.
3.5. Fluorescence properties of the materials along the processing steps
After the microstructural analysis of the materials, the fluorescence intensity was measured, first on the samples along the full process (Fig. 11) then on the 3D printed samples (Fig. 11). For the native FG-FS
sample (Fig. 11A), the fluorescence emission intensity is maximal (value
of 5407), then divided by nearly 10 when FG-FS is mixed with FS (Fig. 11B), which is consistent with the 1:9 dilution ratio. A rather limited fluorescence intensity reduction (− 55 %) was observed after the
first extrusion with PBAT to produce the compound (Fig. 11C). One
could have expected that heating at 165 ◦C during several minutes
would easily destroy the 5-DTAF fluorescent molecule, which was
actually not severely altered. After the filament extrusion (Fig. 11D), the
intensity was unchanged (235), indicating that a second heating step at
165 ◦C and moderate residence time (approx. 35 s) had no impact on FG-
FS fluorescence. It is also important to note that compounding and
extrusion steps favour an optimal dispersion of FG-FS particles (Fig. 11C
and D) in comparison with manual mixing (Fig. 11B) where small
fluorescent dots are visible.
In addition, fluorescence emission intensity was measured on the 3D
printed materials, with and without FG-FS (Fig. 12). In comparison to
Fig. 11D, exposure time was increased in order to visually differentiate
both samples on Fig. 12. It is clear that the presence of only 1% FG-FS
brings a strong fluorescence signal to the sample, while only back-ground fibre autofluorescence is observed for the other sample only containing FS. Thus a fluorescence signal can still be measured on the 3D printed material.
The 5-DTAF molecule (Fig. 1) was selected as the fluorophore to be
grafted on FS based on its relative low price and known fluorescein
fluorescence dependence on pH (Lakowicz, 2006), that is why some
Table 2
μCT structural characterization of 3D printed samples.
Sample with 10
%-wt FS Sample with 10 %-wt FG-FS Variation (%) Median pore size
(μm) 58.6 27.8 −52.6 Closed porosity (%) 1.71 1.26 −26.3 Open porosity (%) 17.8 12.1 −32.0 Total porosity (%) 19.2 13.2 −31.3
Fig. 10. Tomographic pore size distribution of FS and FG-FS samples.
Fig. 11. Evolution of fluorescence of FG-FS (ratio 500) material along the process. A: native FG-FS particles. B: FG-FS particles mixed (10 % w/w) with FS particles. C
and D: compound and filament FG-FS material (fluorescence measurement with LED light power: 100 %, exposure time: 400 ms).
Fig. 12. Comparison of fluorescence of 3D printed material made of PBAT-10
%-wt FS (left, nearly invisible) and PBAT-10 %-wt FG-FS (right) (fluorescence measurement with LED light power: 100 %, exposure time: 850 ms).
trials were performed to evaluate the capacity of the 3D printed material to serve as a pH sensor. After placing the samples in buffered solutions with a pH ranging from 5 to 8 for 24 h, fluorescence emission was measured (Supplementary Fig. 4). Even if a small fluorescence differ-ence was observed between samples, it was far from the multi-decade fluorescence difference that was expected from pH 5 to 8 based on the fluorescein properties. Actually, this could come from different causes. Once grafted to polysaccharides contained in shives, numerous non-covalent interactions are likely to occur between the polymer chain and/or between the fluorescent molecules, leading to the masking of the fluorescent molecules and also possibly to a quenching phenomenon (Lakowicz, 2006). Also, the relative high hydrophobicity of the 3D printed material is a strong limitation for imbibition with a liquid, thus preventing chemical interactions of 5-DTAF with the buffer to highlight pH sensitivity. Overall, even if the 3D printed material as itself remains fluorescent, the manufacturing process steps making a dense material might limit some interactions with its environment, requiring some adjustments to use as a sensor.
4. Conclusion
The objective of this study was achieved since we were able to 3D print a material containing fluorescent industrial by-products of flax. Despite the different heating and mixing steps to prepare successively the compound, filament and 3D material, a significant fluorescence emission was still present in the final material, even if it was not possible to determine whether the fluorophore was covalently grafted or only adsorbed in the flax shives. Microstructural characterization demon-strated a homogenous distribution of the flax particles into the PBAT matrix: the presence of the fluorophore probably contributes to an even lower open porosity in comparison to the material with no fluorescent flax shives. But this rather low open porosity might prevent liquid penetration and limit the use of such a dense material as a pH sensor. So it might be attractive to adapt the 3D printing process to bring a larger open porosity. Despite this observation, the possibility of adding a fluorescent molecule in such a 3D printed composite is attractive: many fluorescent molecules can respond to various stimuli (mechanical, thermal, chemical) and 3D printing process can contribute to the incorporation of such sensors in materials with complex shapes and containing biomass by-products.
Data availability
The raw/processed data required to reproduce these findings cannot be shared at this time as the data also forms part of an ongoing study.
Funding
Project SMARTPOP funded by Marie Skłodowska-Curie Actions, Grant number 893040.
CRediT authorship contribution statement
Claire Mayer-Laigle: Conceptualization, Methodology, Validation,
Formal analysis, Investigation, Writing - original draft, Funding acqui-sition. Laurence Foulon: Methodology, Validation. Cl´ement Denoual: Investigation, Methodology, Validation. Miguel Pernes: Methodology, Validation. Eric Rondet: Methodology, Formal analysis, Writing - re-view & editing. Anthony Magueresse: Investigation, Validation. C´ecile
Barron: Writing - review & editing. Anouck Habrant: Methodology,
Validation. Alain Bourmaud: Conceptualization, Methodology, Inves-tigation, Writing - original draft. Gabriel Pa¨es: Conceptualization, Methodology, Investigation, Writing - original draft.
Declaration of Competing Interest
The authors declare that they have no known competing financial interests or personal relationships that could have appeared to influence the work reported in this paper.
Acknowledgements
The authors want to acknowledge the French National Institute for Agricultural, Food and Environment Research (INRAE) for funding this work through the collaborative project FLUOFLAX4D. Amandine Defonte is also thanked for her technical contribution in compounding and filament manufacturing. Authors would like to thank Angelique Green for thorough proofreading of the manuscript.
Appendix A. Supplementary data
Supplementary material related to this article can be found, in the
online version, at doi:https://doi.org/10.1016/j.indcrop.2021.113482.
References
Abitbol, T., Palermo, A., Moran-Mirabal, J.M., Cranston, E.D., 2013. Fluorescent labeling and characterization of cellulose nanocrystals with varying charge contents. Biomacromolecules 14, 3278–3284. https://doi.org/10.1021/bm400879x. Badouard, C., Traon, F., Denoual, C., Mayer-Laigle, C., Pa¨es, G., Bourmaud, A., 2019.
Exploring mechanical properties of fully compostable flax reinforced composite filaments for 3D printing applications. Ind. Crops Prod. 135, 246–250. https://doi. org/10.1016/j.indcrop.2019.04.049.
Bahçegül, E.G., Bahçegül, E., ¨Ozkan, N., 2020. 3D printing of hemicellulosic biopolymers extracted from lignocellulosic agricultural wastes. ACS Appl. Polym. Mat. 2, 2622–2632. https://doi.org/10.1021/acsapm.0c00256.
Baley, C., Goudenhooft, C., Gibaud, M., Bourmaud, A., 2018. Flax stems: from a specific architecture to an instructive model for bioinspired composite structures. Bionspir. Biomim. 13, 026007 https://doi.org/10.1088/1748-3190/aaa6b7.
Barletta, D., Berry, R.J., Larsson, S.H., Lestander, T.A., Poletto, M., Ramírez-G´omez, ´A., 2015. Assessment on bulk solids best practice techniques for flow characterization and storage/handling equipment design for biomass materials of different classes. Fuel Process. Technol. 138, 540–554. https://doi.org/10.1016/j.
fuproc.2015.06.034.
Bi, H., Xu, M., Ye, G., Guo, R., Cai, L., Ren, Z., 2018. Mechanical, thermal, and shape memory properties of three-dimensional printing biomass composites. Polymers 10, 1234. https://doi.org/10.3390/polym10111234.
Borgefors, G., 1996. On digital distance transforms in three dimensions. Comput. Vis. Image Underst. 64, 368–376. https://doi.org/10.1006/cviu.1996.0065. Bosch, P., Catalina, F., Corrales, T., Peinado, C., 2005. Fluorescent probes for sensing
processes in polymers. Chem.-Eur. J. 11, 4314–4325. https://doi.org/10.1002/ chem.200401349.
Bourmaud, A., Beaugrand, J., Shah, D.U., Placet, V., Baley, C., 2018. Towards the design of high-performance plant fibre composites. Prog. Mater. Sci. 97, 347–408. https:// doi.org/10.1016/j.pmatsci.2018.05.005.
Bouvier, D.J., 2000. Double Times Cubes: a Fast Surface Construction Algorithm for Volume Visualization. Unpublished report. University of Arkansas, 313 Enginneering Hall, Fayetteville, AR 72701, USA.
Domokos, G., Kun, F., Sipos, A.´A., Szab´o, T., 2015. Universality of fragment shapes. Sci. Rep. 5, 9147. https://doi.org/10.1038/srep09147.
Feldkamp, L.A., Davis, L.C., Kress, J.W., 1984. Practical cone-beam algorithm. J. Opt. Soc. Am. A 1, 612–619. https://doi.org/10.1364/JOSAA.1.000612.
Fong, M., Berrin, J.G., Pa¨es, G., 2016. Investigation of the binding properties of a multi- modular GH45 cellulase using bioinspired model assemblies. Biotechnol. Biofuels 9, 12. https://doi.org/10.1186/s13068-016-0428-y.
Goudenhooft, C., Bourmaud, A., Baley, C., 2019. Flax (Linum usitatissimum L.) fibers for composite reinforcement: exploring the link between plant growth, cell walls development, and fiber properties. Front. Plant Sci. 10 https://doi.org/10.3389/ fpls.2019.00411.
Helbert, W., Chanzy, H., Husum, T.L., Schulein, M., Ernst, S., 2003. Fluorescent cellulose microfibrils as substrate for the detection of cellulase activity. Biomacromolecules 4, 481–487. https://doi.org/10.1021/bm020076i.
Karinkanta, P., ¨Amm¨al¨a, A., Illikainen, M., Niinim¨aki, J., 2018. Fine grinding of wood – overview from wood breakage to applications. Biomass Bionerg. 113, 31–44.
https://doi.org/10.1016/j.biombioe.2018.03.007.
Kariz, M., Sernek, M., Obu´cina, M., Kuzman, M.K., 2018. Effect of wood content in FDM filament on properties of 3D printed parts. Mater. Today Commun. 14, 135–140.
https://doi.org/10.1016/j.mtcomm.2017.12.016.
Kukla, C., Gonzalez-Gutierrez, J., Duretek, I., Schuschnigg, S., Holzer, C., 2017. Effect of particle size on the properties of highly-filled polymers for fused filament fabrication. AIP Conf. Proc. 1914, 190006 https://doi.org/10.1063/1.5016795.
Lakowicz, J.R., 2006. Principles of Fluorescence Spectroscopy, third edition. Springer, New York, NY, USA.
Le Duigou, A., Castro, M., Bevan, R., Martin, N., 2016. 3D printing of wood fibre biocomposites: from mechanical to actuation functionality. Mater. Design 96, 106–114. https://doi.org/10.1016/j.matdes.2016.02.018.
Le Guen, M.-J., Newman, R.H., Fernyhough, A., Hill, S.J., Staiger, M.P., 2016. Correlations between the Physiochemical Characteristics of Plant Fibres and Their Mechanical Properties. Springer Netherlands, Dordrecht, pp. 35–47.
Le Guen, M.-J., Thoury-Monbrun, V., Castellano Rold´an, J.M., Hill, S.J., 2017. Assessing the potential of farm dairy effluent as a filler in novel PLA biocomposites. J. Polym. Environ. 25, 419–426. https://doi.org/10.1007/s10924-016-0824-1.
Le Guen, M.-J., Hill, S., Smith, D., Theobald, B., Gaugler, E., Barakat, A., Mayer- Laigle, C., 2019. Influence of rice husk and wood biomass properties on the manufacture of filaments for fused deposition modeling. Front. Chem. 7 https://doi. org/10.3389/fchem.2019.00735.
Lorensen, W.E., Cline, H.E., 1987. Marching cubes: a high resolution 3D surface construction algorithm. SIGGRAPH Comput. Graph. 21, 163–169. https://doi.org/ 10.1145/37402.37422.
Mayer-Laigle, C., Blanc, N., Rajaonarivony, R.K., Rouau, X., 2018. Comminution of dry lignocellulosic biomass, a review: part I. From fundamental mechanisms to milling behaviour. Bioeng. 5, 41. https://doi.org/10.3390/bioengineering5020041. Montalvo Navarrete, J.I., Hidalgo-Salazar, M.A., Escobar Nunez, E., Rojas Arciniegas, A.
J., 2018. Thermal and mechanical behavior of biocomposites using additive manufacturing. Int. J. Interact. Des. Manuf. 12, 449–458. https://doi.org/10.1007/ s12008-017-0411-2.
Müller, K., Zollfrank, C., Schmid, M., 2019. Natural polymers from biomass resources as feedstocks for thermoplastic materials. Macromol. Mater. Eng. 304, 1800760
https://doi.org/10.1002/mame.201800760.
Muniyasamy, S., Anstey, A., Reddy, M.M., Misra, M., Mohanty, A., 2013.
Biodegradability and compostability of lignocellulosic based composite materials. J. Renew. Mater. 1, 253–272. https://doi.org/10.7569/JRM.2013.634117. Ndazi, B.S., Karlsson, S., 2011. Characterization of hydrolytic degradation of polylactic
acid/rice hulls composites in water at different temperatures. Express Polym. Lett. 5, 119–131. https://doi.org/10.3144/expresspolymlett.2011.13.
Nuez, L., Beaugrand, J., Shah, D.U., Mayer-Laigle, C., Bourmaud, A., D’Arras, P., Baley, C., 2020. The potential of flax shives as reinforcements for injection moulded
polypropylene composites. Ind. Crops Prod. 148, 112324 https://doi.org/10.1016/j. indcrop.2020.112324.
Pa¨es, G., Burr, S., Saab, M.-B., Molinari, M., Agui´e-B´eghin, V., Chabbert, B., 2013. Modeling progression of fluorescent probes in bioinspired lignocellulosic assemblies. Biomacromolecules 14, 2196–2205. https://doi.org/10.1021/bm400338b. Pa¨es, G., von Schantz, L., Ohlin, M., 2015. Bioinspired assemblies of plant cell wall
polymers unravel affinity properties of carbohydrate-binding modules. Soft Matter 11, 6586–6594. https://doi.org/10.1039/c5sm01157d.
Rajaonarivony, K., Rouau, X., Lampoh, K., Delenne, J.-Y., Mayer-Laigle, C., 2019. Fine comminution of pine bark: how does mechanical loading influence particles properties and milling efficiency? Bioeng. 6, 102. https://doi.org/10.3390/ bioengineering6040102.
Remy, E., Thiel, E., 2002. Medial axis for chamfer distances: computing look-up tables and neighbourhoods in 2D or 3D. Pattern Recogn. Lett. 23, 649–661. https://doi. org/10.1016/S0167-8655(01)00141-6.
Rinaldi, M., Ghidini, T., Cecchini, F., Brandao, A., Nanni, F., 2018. Additive layer manufacturing of poly (ether ether ketone) via FDM. Compos. Part B-Eng. 145, 162–172. https://doi.org/10.1016/j.compositesb.2018.03.029.
Shao, Y., Guizani, C., Grosseau, P., Chaussy, D., Beneventi, D., 2018. Use of lignocellulosic materials and 3D printing for the development of structured monolithic carbon materials. Compos. Part B-Eng. 149, 206–215. https://doi.org/ 10.1016/j.compositesb.2018.05.035.
Wang, X., Jiang, M., Zhou, Z., Gou, J., Hui, D., 2017. 3D printing of polymer matrix composites: a review and prospective. Compos. Part B-Eng. 110, 442–458. https:// doi.org/10.1016/j.compositesb.2016.11.034.
Yan, G., Tian, J., Zhu, S., Dai, Y., Qin, C., 2008. Fast cone-beam CT image reconstruction using GPU hardware. J. Xray Sci. Technol. 16, 225–234.
Yu, J., Tong, M., Sun, X., Li, B., 2007. Biomass grafted with polyamic acid for enhancement of cadmium(II) and lead(II) biosorption. React. Funct. Polym. 67, 564–572. https://doi.org/10.1016/j.reactfunctpolym.2007.03.010.
Zeidler, H., Klemm, D., B¨ottger-Hiller, F., Fritsch, S., Le Guen, M.J., Singamneni, S., 2018. 3D printing of biodegradable parts using renewable biobased materials. Proc. Manuf. 21, 117–124. https://doi.org/10.1016/j.promfg.2018.02.101.