Computational and Biological Studies of Mechanical
Prophylaxis against Deep Venous Thrombosis
by GUOHAO DAI
B.S. Mechanics and Engineering Science Peking University, 1992
M.S. Biomechanics
Peking University, 1995
Submitted to the Harvard-MIT Division of Health Sciences and Technology in partial fulfillment of the requirements for the Degree of
DOCTOR OF PHILOSOPHY IN MEDICAL ENGINEERING
at the
MASSACHUSETTS INSTITUTE OF TECHNOLOGY
June 2001
© 2001 Massachusetts Institute of Technology. All rights reserved.
Signature of Author
Harvard-MIT Division of Health Science and Technology
May, 2001 Certified by Roger D. Kamm Professor of Bioengineering Thesis Supervisor Accepted by
Edward Hood Taplin Professor of Co-director, Harvard-MIT Division
-
~ ' Ma
thaL. Gray
Medical and Electrical ngineering
of Health Sciences and echnology
MASSACHUSETTS INSTITUTE OF TECHNOLOGY
Computational and Biological Studies of Mechanical
Prophylaxis against Deep Venous Thrombosis
by
Guohao Dai
Submitted to the Harvard-MIT Division of Health Sciences and Technology On May, 15, 2001 in partial fulfillment of the requirements for the Degree of
DOCTOR OF PHILOSOPHY IN MEDICAL ENGINEERING ABSTRACT
Deep vein thrombosis (DVT) of the lower extremity and induced pulmonary embolism are common complications resulting from prolonged periods of bed-rest or immobilization of the limbs. One of the most effective methods of prophylaxis against DVT is external pneumatic compression (EPC). In spite of its wide acceptance as an effective means of prophylaxis, its mechanism remains poorly understood and optimal compression conditions have not been defined. Understanding the biological consequences of EPC is an important goal for optimizing the performance of compression device and providing guidance for clinical use. In the first part of this thesis, a computational model of the leg was developed to simulate hemodynamic conditions under EPC and the influence of different modes of compression were analyzed and compared. Then, a new in vitro cell culture system was developed that can be used to examine the effect of hemodynamic conditions during EPC on endothelial cell (EC) function. The biologic response was assessed through changes in cell morphology and the expression of various pro-thrombotic and anti-thrombotic factors related to EC. The results show that intermittent flow associated with EPC up-regulates EC fibrinolytic potential and vasomotor function. Using DNA microarray technology, the data of thrombo-regulatory factors indicates that EC gene expression shifts toward anti-thrombotic vs. pro-thrombotic under EPC. Finally, Nitric Oxide (NO), an important regulator of vasomotor and platelet functions was studied in detail under various cycles of EPC. The results show that NO production and eNOS mRNA respond differentially to modes of EPC. Further exploration using the system can potentially reveal the optimum combination of forces to better regulate thromboresistant effects desired for DVT prophylaxis.
Thesis Supervisor: Roger D. Kamm
Title: Professor of Bioengineering Thesis Committee
Acknowledgements
When this thesis is approaching to be finished, I cannot begin to think how much I have learned during my years at MIT. My advisor, Prof. Roger Kamm, is my primary
teacher during these years. I am grateful for his guidance throughout my graduate education from engineering skills, scientific thinking, teaching methods to independent research. I have benefited from his insight, experience, and support for
these years. It would be an honor to continue working with him.
Thanks to my thesis committee members. I am indebted to Dr. Roslyn Orkin who
taught me the cell culture and molecular biology techniques. I still remember how little I knew when I started. But with her patience and guidance, I was able to enter a
new field quickly. I am also deeply grateful for Dr. Jonathan Gertler who introduced me to the realities of clinical research. I begin to get truly exited about vascular medicine by working with him. Thanks also go to Prof. Forbes Dewey for his insightful suggestions and scientific guidance.
Many members of the Vascular Research Division at Mass General Hospital have
helped to make my experirirents possible and the work enjoyable at the same time.
Without them, this thesis would not have been realized. Olga Tsukurov worked side
by side with me and taught me a lot of molecular biology techniques. Michael Chen
helped me greatly at essentially all the stages of the experiments. Nancy Conroy and
Phil Petteruti provided me with endothelial cell cultures too numerously to count. I am grateful for their help and friendship.
I have been amazed at the personal support I have received from many friends throughout my graduate school experience. I am thankful for the students at Fluid
Mechanics Lab who made life enjoyable and unforgettable over the years. Constantine
Hrousis helped with the ABAQUS when I started. Michael Capland provided me
keep me looking forward during some long work days and boosting my spirits with sense of humor.
The most important education I received is from HST MEMP program. I enjoyed all
the courses and activities I have taken at HST and thanks to all of the administration,
faculties and my fellow HST students who made this journey most memorable. I must
thank Prof. Roger Mark for his advice and encouragement for my decision to pursue medicine in the future. I must also thank Dr. Valerie Stelluto, course director of Introduction to Clinical Medicine, who guided me through the overwhelmed period
and taught me the compassionate care in medicine.
The work was funded by Aircast Inc. I thank them for their financial and technical support which made all my research possible. Special thanks to Jack McVicker and
Bill Conte. They helped greatly with the VenoFlow system and made our experiments go smoothly.
Thanks also go to Claire Sasahara. I am grateful for her diligence in helping me with
all of the administrative assistance.
My family members have always provided unconditional love and support for me. I owe my parents an enormous debt of gratitude. They have done their best to provide me every opportunity to get better education and have remained my greatest cheerleaders throughout my life.
Finally and most importantly, I would like to thank my wife, Maggie, for making these
years the most wonderful time in my life with her love, support and understanding.
Table of Contents
ACKNOWLEDGEMENTS ... 5 TABLE OF CONTENTS ... 7 LIST OF FIGURES ... 9 LIST OF TABLES ... 11 CHAPTER 1 INTRODUCTION ... 13BACKGROUND: DEEP VENOUS THROMBOSIS ... ... 13
PATHOGENESIS OF VENOUS THROMBOSIS ... ... 14
DVT PROPHYLAXIS ... ... 15
MECHANISMS OF EPC ... 17
GOAL OF THESIS . ... 20
THESIS ORGANIZATION ... 20
CHAPTER 2 DEVELOPMENT OF FINITE ELEMENT MODEL . ... 23
FINITE ELEMENT MODEL (FEM) OF THE LOWER LEG ... 23
MODES OF EXTERI AL COMPRESSION ... 25
EXPERIMENTS TO MEASURE THE ELASTIC MODULUS OF THE HUMAN LEG ... 27
RESULTS OF THE FEA ... 30
SIMULATION OF VENOUS FLOWS GENERATED BY EXTERNAL COMPRESSION ... 35
RESULTS OF BLOOD FLOW SIMULATION ... 39
DISCUSSION ... 50
CHAPTER 3 ENDOTHELIAL CELLS IN THROMBOSIS AND HOMEOSTASIS ... 57
ROLE OF THE ENDOTHELIAL CELL IN REGULATING 'THROMBOSIS ... 57
ENDOTHELIAL FUNCTIONS REGULATED BY FLUID SHEAR STRESS AND CYCLIC STRAIN ... 64
CANDIDATE GENES ... ... 67
CHAPTER 4 DEVELOPMENT OF AN IN VITRO CELL CULTURE SYSTEM ... 69
INTRODUCTION ... 69
DEVELOPMENT OF THE VENOUS FLOW SIMULATOR (VFS) ... 69
PHYSICAL DESCRIPTION AND CHARACTERISTICS OF THE VFS ... 71
EXPERIMENTAL DESIGN ... 74.
ESTABLISHMENT OF VFS CELL CULTURES ... 77
RESULTS ... 79
DISCUSSION ... 87
CHAPTER 6 SCREENING COAGULATION RELATED GENES USING AFFYMETRIX GENE ARRAY ... 95
INTRODUCTION TO DNA MICROARRAY ... ... 95
MATERIALS AND METHODS ... 98
POSITIVE CONTROL ... 100
RESULTS ... 101
DISCUSSION ... 104
SUM M ARY ... 106
CHAPTER 7 NITRIC OXIDE PRODUCTION BY ENDOTHELIAL CELLS UNDER EPC ... 109
INTRODUCTION ... 109
NITRIC OXIDE AND NITRIC OXIDE SYNTHASE ... 109
NO CHESMITRY ... ... 112
NITRITRE/NITRATE DETERMINATION ... 113
EXPERIMENT SETUP ... ... 1 14 STATISTICAL ANALYSIS ... 116
RESULTS ... 116
CONCLUSION AND DISCUSSION ... ... 123
CHAPTER 8 SUMMARY ... 129
SUMMARY ... 129
FUTURE DIRECTIONS ... ... 133
List of Figures
Figure 1-1 Sketch of External Pneumatic Compression ... 16
Figure 2-1 Finite element model of a cross-s.ection of the lower leg showing ... 25
regions of bone, tissue, vein, fascia and skin.
Figure 2-2 Three types of compression modes used in the simulation ... 26 Figure 2-3 Verify FEM by comparing to analytic solution of compression of a ... 27
thick wall tube.
Figure 2-4 Apparatus used to measure the Young's modulus of the lower leg ... 28 Figure 2-5 Finite element simulation of the experiment . ... 29 Figure 2-6 Comparison of experiment data to results from the FEA with... 29
different values of the Young's modulus for tissue.
Figure 2-7 Tissue deformation caused by external pneumatic compression ... 30 Figure 2-8 The relation between venous cross-sectional area and compression ... 31
pressure for the two distributions of pressure.
Figure 2-9 Maximum principal strain along the vessel wall after compression ... 33 Figure 2-10 Maximum principal stain distribution along the inner circumference ... 34
of the vein.
Figure 2-11 (a) Axially-uniform pressure along the leg ... 38 (b) Graded-sequential pressure along the leg
Figure 2-12 Normalized venous cross-sectional area following the application ... 40 of external pressure as a function of distance from the "ankle".
Figure 2-13 Calculated blood flow velocity at the thigh ... 43 Figure 2-14 Calculated wall shear stress as a function of distance from the "ankle" 45 Figure 3-1 Endothelial thromboregulation by secreting or expressing ... 64
variety of molecules.
Figure 4-1 (a) Schematic drawing of venous flow simulator (VFS) ... 72 (b) Test chamber used to produce tube compression.
Figure 5-1 Measured pressure, flow rate, and calculated shear stress in the VFS ... 80 Figure 5-2 Color contour map showing calculated tube wall strain ... 81
after 6 hours experiment period at peak shear of 10 dyn/cm2.
Figure 5-5 Northern blot analysis of mRNA expression of candidate genes ...84
after 1 hour experiment period at peak shear of 40 dyn/cm2. Figure 5-6 Northern Blot of mRNA expression of tPA, PAI-1, Annexin II ...85
eNOS, ET-1 and GAPD. Figure 5-7 Densitometric analysis of mRNA expressio of tPA, PAI-I ... 86
and Annexin II. Figure 5-8 Densitometric analysis of mRNA expression of eNOS and ET-1 ...87
Figure 6-1 Schematic view of Affymetrix GeneChip ... 97
Figure 6-2 Each gene is identified by 20 perfect match oligonucleotides ...99
and 20 mismatch oligonucleotides. Figure 6-3 Affymetrix gene chip hybridization protocol. ... 100
Figure 6-4 Northern blot analysis of eNOS and tPA mRNA expression ... 101
Figure 7-1 Nitrite calibration curve ... 114
Figure 7-2 Cumulative nitrite production in conditioned media ... 117
Figure 7-3 Kinetics of NO production in response to resting period ... 118
Figure 7-4 Nitrite production after 6 hours experimental period with and ... 119
without 100mM NG-amino-L-arginine (L-NAA). Figure 7-5 Cumulative nitrite levels in flow only group (F) in presence of ... 120
1 mM S-Methyl-L-thiocitrulline, I mM dexamethasone and I mM N'-Nitro-L-arginine Methyl Ester. Figure 7-6 (a) Northern blot analysis of mRNA expression of eNOS ... 121
(b) Densitometric analysis of eNOS mRNA expression. Figure 7-7 NO production rate between 0 and 1 hour (left), between ... 122
1 and 6 hour (right) under different EPC cycles. Figure 7-8 eNOS mRNA expression under different cycles of EPC ... 123
List of Tables
Table 2-1 Wall shear stress under different flow conditions ... 36
Table 2-2 Percent of vessel wall subjected to certain level of shear stress (Young's modulus of muscle = 1.2x 10⁴Pa) ... ... 49
Table 2-3 Percent of blood left in the lower leg ... ... 49
Table 2-4 Percent of vessel wall subjected to certain level of shear stress (Young's modulus of muscle = 0.6x 10⁴Pa) ... . ... 50
Table 2-5 Percent of blood left in the lower leg ... 50
Table 3-1 Summary of endothelial cell response to hemodynamic shear stress ... 65
Table 4-1 Conditions in each of the four flow circuits. ... 70
Table 4-2 Conditions used in the present experiments ... 70
Table 4-3 Comparative compliance of human saphenous vein and silastic tube ... 73
Table 6-1 Changes of mRNA expression in endothelial pro-thrombotic genes ... 102
Table 6-2 Changes of mRNA expression in endothelial anti-thrombotic genes ... 103
Table 7-1 Three isoforms of nitric oxide synthase (NOS) ... 110
Chapter 1 Introduction
Background: Deep Venous Thrombosis
Deep Venous Thrombosis (DVT) is the development and growth of thrombi in the deep veins of the leg. In the slower moving blood of the veins, the thrombi have a much richer admixture of erythrocytes and are therefore known as red, coagulative thrombi [1]. Venous thrombosis, once formed, is almost invariably occlusive. Thrombi are important for two reasons: (1) they cause obstruction of veins which leads to localized pain, inflammation and edema, (2) they provide possible sources of emboli. Venous thrombi may cause congestion and edema in dependent parts, but a far graver consequence is that thrombi may dislodge from distal sites in the vascular tree, travel to the lung and cause Pulmonary Embolism (PE), one of the most common causes of death in hospitalized patients [2]. Depending on the size and location of the embo!ic mass, it may cause pulmonary infarction, acute right heart failure, cardiovascular collapse or even sudden death [].
DVT and PE constitute major health problems that result in significant morbidity and mortality. It is estimated that they are associated with 300,000-600,000 hospitalizations a year and as many as 50,000 deaths each year as a result of pulmonary embolism [2]. DVT and PE are common in many medical and surgical conditions. For example, the incidence of DVT in trauma has been found to be 65% in
autopsy studies [3] and 58% in patients studied by venography [4]. Furthermore, DVT
accounts for peri-operative morbidity and death in up to 30% of orthopedic, trauma and neurosurgical procedures and has a significant morbidity in all aspects of surgical
Pathogenesis of Venous Thrombosis
Thrombosis reflects a disturbance of normal homeostatic balance. In health, the blood remains free from clots, yet allows for the rapid formation of a solid plug to repair any type of injury to the blood vessels. This process is referred to as normal homeostasis. Thrombosis, on the other hand, is a pathological process in which a clotted mass of
blood is formed within the non-injured vascular system; it represents, to a considerable
extent, a pathologic extension of normal homeostasis.
Several groups of patients, for example, those undergoing various types of surgery are at high risk of developing venous thromboembolic disease. Other common causes of DVT include trauma, obesity, malignancy, immobilization, cardiac disease and stroke. Virchow [6] was the first to summarize the following factors which are thought to influence thrombus formation: (1) Vessel wall damage, (2) Blood hypercoagulability,
(3) Alterations in blood flow.
Vessel wall damage
When the endothelium of a vessel is damaged, exposing the subendothelium to blood, platelet adhesion and aggregation are triggered and tissue factor is activated, thereby promoting blood coagulation. Damage to vessels contributes to venous thrombosis as a result of trauma or in patients undergoing surgery.
Blood coagulability
Changes in the blood itself can affect coagulability and thereby promote thrombus formation. With increasing age, we all have increased blood coagulability. Some
thromboembolism. Changes in blood coagulability also occur secondary to a variety of medical conditions [1].
Alterations in blood flow
Changes in blood flow (e.g. venous stasis) have been shown to increase the risk of thrombosis. In subjects with competent venous valves, venous return from the legs is enhanced by contraction of the calf muscles, which helps to propel blood towards the heart. But stasis can occur in states of immobility when the blood is allowed to pool in the intramuscular sinuses of the calf that become dilated during prolonged bed rest. Autopsy studies have revealed that the prevalence of DVT is high in patients confined
to bed for a week or more prior to death [2]. Patients are exposed to these same risks
when confined to bed either before or after surgery. Elderly, bedridden patients, especially those with varicose veins and incompetent valves have a tendency to suffer from venous dilation in the legs, and this can also lead to venous pooling and stasis. Venous obstruction is another cause of stasis as in patients with pelvic tumors or proximal vein thrombosis. It is thought that when blood flow slows, there is more time for the accumulation of clotting factors and the small thrombi formed can not been washed away if there is insufficient flow. Therefore, venous stasis is often associated with DVT.
DVT prophylaxis
The prevalence of DVT and PE is sufficiently high that prophylactic procedures are typically used in patients considered to be at risk. There are basically two methods of prevention: pharmacological (e.g., heparin, warfarin) and mechanical (e.g. elastic stockings, external pneumatic compression, early ambulation etc.). Systemic anticoagulants can be effective but often are contra-indicated in situations such as
major trauma, neurological and radical pelvic surgery where risk of hemorrhage is of particular concern.
Of the mechanical interventions, one of the most effective methods of prophylaxis against DVT is external pneumatic compression (EPC) (Figure 1-1). An EPC device usually consists of an inflatable cuff and a pressure control unit. The cuff is placed around the patient's lower legs and is inflated and deflated periodically. The pressure and time cycle varies among different design. Typically, the cycle consists of a rapid pressure rise from zero to 40~50mmHg, after which the pressure is held constant for about 810 seconds.
Figure 1-1 External Pressure is then released and a rest period of about 50
Pneumatic Compression second follows before the next pressure pulse is applied.
The compression collapses the veins, enhances blood flow in the deep veins. Therefore, it discourages stasis and venous pooling of blood in the lower extremities. The efficacy of EPC has been well documented in medical literature. Intraoperative and postoperative intermittent pneumatic compression was found to be highly effective in the prevention of DVT in abdominal surgery [7], neurosurgery [8] and is highly effective following various orthopedic procedures [9, 10].
Compared to traditional anti-coagulant therapies, EPC has been shown not cause major bleeding complications [11 ] and is particularly useful in patients at high risk of bleeding, e.g. those undergoing neurosurgery and major orthopedic surgery or in situations where pharmacological agents are contraindicated as in multiple trauma.
Intermittent compression devices are inexpensive and should be considered in all at-risk surgical patients. On the other hand, they can be somewhat cumbersome and inconvenient, potentially leading to less than optimal compliance rates by patients and
nursing staff. The cumbersome nature of these devices has been overcome by the more
modern versions. Because of all the benefits, NIH consensus statement [2] recommends wider use of EPC prophylaxis except in certain situations where the
devices can not be applied, such as in patients with lower leg fractures.
Mechanisms of EPC
The use of intermittent pneumatic leg compression to reduce the frequencies of thromboembolic complications is based on sound physiological rationale. The prevention of venous thrombosis is associated with the observation that high flow
pulsatility helps to empty the deep veins periodically, thus overcoming venous stasis.
Increased blood flow velocity can dilute local coagulation factors, break up small thrombi and prevent the aggregation of platelets. These hemodynamic effects are thought to be the primary mechanisms of EPC. However, the exact nature of the
biologic response is not well understood. In the following, we will review our current
understanding of those factors that thought to contribute to the efficacy of EPC. These include enhanced fibrinolytic activity, stimulated nitric oxide production and increased tissue factor pathway inhibitor.
Enhancedfibrinolytic activity
Previous investigations have demonstrated the ability of external compression to
via production of tissue type plasmnogen activator (tPA) by the vascular endothelium. However, whether or not EPC can enhance fibrinolytic activity is still under debate. In other studies, no changes of tPA or plasminogen activator inhibitor (PAI-1) antigens were observed [15]. These studies indicated that the antithrombotic effect of
mechanical prophylaxis is probably due primarily to its ability to increase venous peak
velocity and flow but not due to enhanced fibrinolytic activity. Furthermore, in those studies that demonstrated enhanced fibrinolytic activity, the mechanism by which this occurs has not been clearly identified. Comerota et al showed [i6] that the mechanism of increased fibrinolytic activity is due to a reduction in PAI-I in the absence of changes in tPA with a resulting increase of tPA activity. However, in other studies
[ 17], increased tPA production is thought to be the cause of enhanced fibrinolysis.
Stimulated Nitric Oxide production
In addition to its use as prophylaxis against deep venous thrombosis, compression of the limbs has several beneficial effects in treatment of venous ulcers, chronic venous hypertension and chronic venous insufficiency [18-20]. Under these situations, vasodilation and improved microcirculation were thought to be contributing factors. Experiments have shown significant vasodilation in arteries and veins during the application of intermittent pneumatic compression, and have shown that the vasodilation could be completely blocked by nitric oxide synthase (NOS) inhibitor [21]. These findings demonstrate that the production of nitric oxide (NO) may be involved in the positive influence of intermittent pneumatic compression on peripheral circulation.
NO, as the primary endothelial derived relaxation factor (EDRF), is not only is a potent vasodilator, but also plays an important role in preventing thrombosis
synthesis and activity [24, 25], as well as to increase tissue plasminogen activator (tPA) release [26]. All of these effects contribute to the anti-thrombotic properties of
NO. It is likely that hemodynamic changes caused by EPC increase production of NO
by endothelial cells [21], this may be one of the factors in DVT prophylaxis and treatment of venous insufficiency.
Increased tissue factor pathway inhibitor
Compared to the large number of studies that focus on fibrinolytic activity, there is relatively little data on the effect of EPC in the early events of blood coagulation, specifically, the tissue factor pathway that initiates the coagulation process when tissue is damaged. The tissue factor dependent pathway is regulated primarily by tissue factor pathway inhibitor (TFPI), which is synthesized primarily in the
endothelial cells [27]. Chouhan et al [28] showed that EPC results in an increase in
plasma TFPI and a decline in Factor VIIa. The observed increases in TFPI with decrease in Factor VIIa suggest that EPC induces an inhibition of the earliest events in the activation of blood coagulation by the tissue factor pathway. Inhibition of the tissue factor pathway, the major physiological initiating mechanism of blood coagulation, may be an important mechanism for the antithrombotic effect of intermittent pneumatic compression.
In summary, there is increasing evidence that external pneumatic compression affects Virchow's triad in three ways: it eliminates stasis and alters blood coagulability through regulating endothelial functions. While Virchow's triad remains true, we
propose that it may be considerably more complex than previous thought in that there
exists an intricate relationship between hemodynamic factor, endothelial thromboregulatory functions and coagulation factors.
Goal of thesis
There have been many studies aimed at improving the performance of EPC in terms of hemodynamic conditions [ 12, 26, 29, 30]. However, the biological correlations of EPC are still unknown in spite of its wide acceptance as an effective means of prophylaxis
against DVT. Understanding the biological consequences of EPC can potentially lead to an optimization of the EPC and the device used to produce it and provide guidance for clinical use. In this thesis, we investigate the biological correlations of EPC
hemodynamics in the following ways,
1. A finite element model of the leg was developed and used to study the influence of
different modes of EPC on venous. In this part of the work, we also determined the hemodynamic conditions to be used in the follow-up in vitro cell culture experiments.
2. Endothelial cells are known to play an important role in maintaining the homeostasis, and many of the functions are influenced by shear stress and cyclic strain. This thesis explores the hypothesis that hemodynamic changes caused by EPC
could change endothelial antithrombotic properties, which contribute to the efficacy of
EPC. This does not preclude that hemodynamic factors, by themselves, decrease the risk of thrombus formation. An in vitro cell culture system which can mimic the hemodynamic conditions of EPC is developed. Cell culture and molecular biology
techniques are used to study the changes of various coagulation related genes under
EPC.
Thesis organization
In chapter 2, a computational model of the leg is developed and used to study the influence of different EPC modes on venous hemodynamics. The effects of different
types of compression modes are compared. Typical hemodynamic conditions from the simulation were used in the follow-up in vitro cell culture experiments.
In chapter 3, the role of endothelial cells in thromboregulation and the influence of shear stress on those functions are reviewed. We then discuss the candidate genes selected for study in our in vitro cell culture experiment.
In chapters 4 and 5, we describe the development of the in vitro cell culture system to mimic the hemodynamic conditions of EPC, then investigate the influences of pulsatile flow and vessel compression on endothelial fibrinolytic and vasomotor functions.
In Chapter 6, broader aspects of endothelial thromboregulation are discussed and studied using Affymetrix gene array technology. A couple of coagulation related genes are identified that respond to EPC hemodynamic conditions.
Finally we consider nitric oxide and nitric oxide synthase in chapter 7. We explore their regulation under various hemodynamic conditions in more detail. Finally, in chapter 8 we summarize the conclusions developed in the thesis, and presente
Chapter 2 Development of Finite Element Model
The purpose of this chapter is to simulate venous blood flow and vessel collapse conditions caused by external compression in order to predict the distribution of wall strain and wall shear stress produced in the veins by various modes of external compression. Venous blood flow has been studied extensively using one-dimensional unsteady flow through a network of collapsible tubes [31, 32]. My thesis extends previous studies by developing a finite element model of the leg. Combined with the unsteady fluid dynamics model, it thus allows us to investigate the different distributions of EPC pressurization, and the prediction of shear stress and vessel wall strains at the level of the venous endothelium. These predictions will be used as reference values for our in vitro cell culture experiment. Ultimately, it could be used in conjunction with biological experiments to optimize the mode of compression with respect to endothelial thromboregulation and thereby produce a more effective clinical procedure for preventing venous thrombosis.
Finite Element Model (FEM) of the Lower Leg
Model assumption
The intent of these simulations is not to produce a precise anatomical model of the venous tree, which is both complex and highly variable between subjects, but rather to simulate a 'typical' system of muscular veins emptying into the deep venous system and draining primarily via the popliteal and deep femoral veins.
In order to simulate venous blood flow, it is necessary to first determine the dependence of venous cross-sectional area on venous pressure and externally-applied
stiff membranes that separate the different muscular regions). These were arranged as
indicated in Figure 2-1.
The decision to assume a two-dimensional structure is based on several factors. While it would be more realistic to take three-dimensional effects into account, to do this in a realistic manner would be prohibitively difficult and computationally expensive. The purpose of these calculations was to improve upon previous studies [31, 32] by replacing a tube law loosely based on venographic data, by one computed based on an approximation of the leg structure. In doing so, the effects of non-uniform circumferential distributions of pressure and non-homogeneous composition can be studied. Several additional assumptions have been made in the course of the FEA of
this structure:
* The plane strain approximation is used.
* Skin and fascia are treated as thin membranes, capable of transmitting in-plane forces but not moments. So-called 'truss elements' are used for this purpose. The
elastic (Young's) modulus used for skin is 2 x 10⁶ Pa [33], and for fascia, 3.4 x 10⁸ Pa [34].
* The Young's modulus of the vein is taken to be 1.33 x 10⁵ Pa [35], the wall thickness-to-radius ratio, 0.2, and the diameter, 1 cm at the popliteal vein.
* All materials are assumed to have a Poisson's ratio of 0.5 on the assumption that compression takes place on a time scale too small to permit much redistribution of
interstitial fluid.
* Bone is taken as rigid and incompressible. The tissue elements surrounding the
bone are assumed to be fixed in space.
* Pressure load is imposed on the inside surface of the vein to simulate venous blood pressure.
Vein
3 , 8s
1 2 3
3-node quadratic truss 8-node biquadratic
(for skin and fascia)
Figure 2-1 Finite element model of a cross-section of the lower leg showing regions of bone, tissue, vein, fascia and skin.
Modes of External Compression
Three different distributions of external compression are applied to the leg using the
FEM: Circumferentially-symmetric (C) and asymmetric (A): either Anterior-Posterior
function of external and internal pressure. All calculations were performed using a commercial finite element analysis (FEA) code (ABAQUS Version 5.2, HKS, Inc. Pawtucket, RI).
Circumferential Collateral Anterior-Posterior
Figure 2-2 Three types of compression modes used in the simulation
As a means of validation, initial simulations were performed using a circumferentially -symmetric compression of a thick-walled tube (Figure 2-3). Using the mesh shown in the figure, excellent agreement was found between the FEA and the result obtained from application of the analytic solution in a series of small, step-wise load
L.U 0.8 0.6 0.4 0.2 00 Young's Modulus=2x04 Poisson Ratio=0.49
U.U U.," U.4 U. U. I.U
Outside compression pressure (from 0-50 mmHg)
Figure 2-3 Verify FEM by comparing to analytic solution of compression of a thick-walled tube.
Experiments to measure the elastic modulus of the human leg
As no value for the elastic modulus of relaxed skeletal muscle could be found in the literature, a simple experiment was conducted to obtain an estimate for this parameter. The approach used was to apply a known force to the lower leg, measure the resulting displacement, then simulate the experiment with the FEA using the methods described above, but with different values for the Young's modulus of muscle. The value for modulus that produced the closest agreement with the measurement was subsequently used in the calculations of venous collapse.
e ram
cm) was positioned against the mid-calf with its long axis parallel to the axis of the
leg, and a force was applied via a low-friction pulley and weight as shown in Figure
2-4. Displacements were measured directly. Healthy volunteers between the ages of 21
and 30 were asked to sit on a chair and to relax their leg. The cylinder was carefully
brought in contact with the mid-portion of the calf with minimal force and weights were gradually added. Approximately 5 measurements were made during increasing force, the entire experiment lasting approximately 5 minutes. The measured
force-displacement relationship was found to be nearly linear and the slope of the line was
associated with the elastic modulus of the leg.
I -*- Block
Lower leg
::'1----
WeightFigure 2-4 Apparatus used to measure the Young's modulus of the lower leg.
The FEM simulation of this experiment is also done with different modulus parameter.
As shown in the Figure 2-5, the model leg is under the load as the same condition as the experiment and the dimension is also set to the same size as the volunteer's leg.
Figure 2-5 Finite element simulation of the experiment. 1 0.9 0.8 0.7 0.6 -E 0.5 .. 0.4 0.3 0.3 0.2 0.1 0 Experimental Data / E=l.xl 04 E=l .2x1 04 E=1.5x10⁴ E=2.0x 10⁴ / /
i,'
0 25 50 Pressure (mmHg)Figure 2-6 Comparison of experiment data to results from the FEA with different values of the Young's modulus for tissue. Each symbol represents data from a
From such a comparison, the elastic modulus of the muscle was determined to be 1.2 x
104Pa. This value for the elastic modulus was used in most simulations. However, in the expectation that older or less healthy subjects might have less muscle tone and therefore a lower Young's modulus, additional simulations were performed with the
modulus reduced by half.
Results of the FEA
Figure 2-7 Tissue deformation caused by external pneumatic compression. (left) Symmetric compression, (right) Asymmetric compression
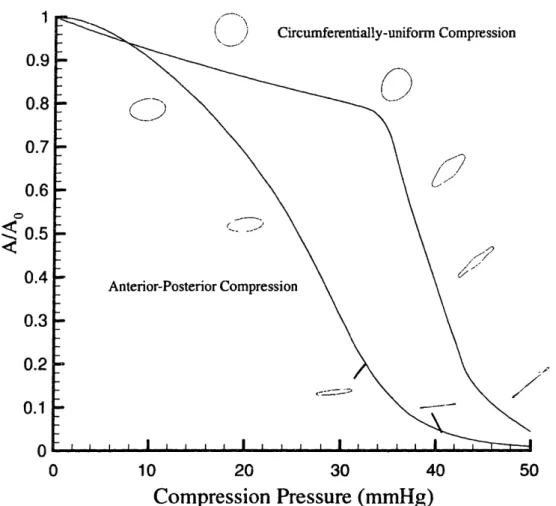
The elastic modulus of the leg obtained experimentally was used in the FEA to determine the degree of collapse produced by the different compression. As shown in the Figure 2-7, collateral and anterior-posterior compression both generate greater collapse than does circumferential compression. The results shown in Figure 2-8 illustrate how the cross-sectional area of the vein is influenced by the mode of compression. When external pressure is small, circumferentially-symmetric (C) compression produces somewhat greater area changes than does asymmetric (A)
compression. The greater reduction in cross-sectional area achieved with A compression derives from the tendency to promote asymmetric vessel collapse as opposed to a more symmetric area reduction found with C compression.
1 0.9 0.8 0.7 0.6 0.5 0.4 0.3 0.2 0.1 0 0 Circumferentially-uniform Compression 10 20 30 40
Compression Pressure (mmHg)
50Figure 2-8 The relation between venous cross-sectional area and compression pressure for the two distributions of pressure, asymmetric (A) and circumferentially symmetric (C). Also shown are th, corresponding vessel cross-sectional shapes at several levels of compression.
The results of Figure 2-8 were obtained with venous pressure set to zero. Normally, however, venous pressure varies and can become significantly elevated during external compression. With C compression, the area is simply a function of the difference between external and venous pressures (Pe-P,), and the results of the FEA
can be expressed by the single curve in the figure.
With A compression, A/Ao is not a function of (P,-Pv) alone; rather, it depends upon
the two pressures individually. The following formula was found to fit the FEA results,
A
= (1 + ip,2 )
oo
Where la,=3.43x10l-', act2=6.33, 3=0.0314, a4=1.92, P,=2.55x 1 0 3, 3,B=1.46, with all pressure specified in mmHg (1 r..,nHg=133 Pa).
The strain field of the vessel wall is shown in Figure 2-9 and the magnitude of stains at the internal vessel lumen is shown in Figure 2-10 for both C and A compressions. The
patterns are different in that circumferential compression produces significantly greater strains at lower pressures than A compression, but eventually leads to less
strain over most of the vessel circumference when fully-collapsed. The patterns of strain are similar, though, at maximal compression, with the largest (negative) strains
being found near the edges of the buckled vein with lower and more uniform strains along the rest of the wall.
8P3 VALUE -INPIITY -2.00E-01 -- 1.64E-01 - -1.27E-01 -- 9.09e-02 -5. 45R-02
Figure 2-9 Maximum principal strain along the vessel wall after compression
C
I
J
Maximum principal strain (from 0-0.2) Asymmetric compression
Maximum principal strain (from 0-0.21) Symmetric compression
Figure 2-10 Maximum principal stain distribution along the inner circumference of the vein as determined from the FEA shown at three levels of compression for (upper panel) asymmetric (A) compression and (lower panel) circumferentially-symmetric (C) compression. Inner curve represents the contour of vessel wall. Outer curve indicates the maximum principal strain, the distance to the inner contour represents the magnitude of the strain.
c-=s--Simulation of Venous Flows Generated by External Compression
The one-dimensional equations governing flow in a collapsible tube are used to calculate the blood flow in the model venous network. This formulation is valid when the longitudinal gradient in area is small, (1/A)(aA/ax) << 1. This is generally true
except possibly in the immediate vicinity of the knee where gradients can be relatively
steep. Following the approach used in a previous study [37], these are the equation of mass conservation:
dA d(uA)
-+
-o0dt dx
and the momentum theorem:
(du du dP n ,.
at ax dx A
where u is flow velocity, A is vessel cross-sectional area, I is wetted perimeter, 'L is wall shear stress. P is the local venous pressure, a function of Pe, and A, according to
the results of FEA,
P = f(P,,,,A)
Wall shear stress Trw is expressed as a function of the local flow characteristics and is
approximated as either fully-developed laminar flow or fully-developed turbulent
flow. The formulae are based on the expressions appropriate for vessels that are either
circular in cross-section, elliptical, or collapsed. Shear stress used in the computation
Table 2-1 Wall shear stress under different flow conditions
Flow condition Cf
Fully developed laminar flow
a> 1 84 PA/2 (ha'2 )1
0.36 <
a
< 1 8J 2 (ia)-' 70 !L (iiaI2)' a < 0.36 7 pC i 11 Turbulent flowa--
0725
0.25
a
> 0.27
0.079 -7)
It
((a
-o." 2. 025 0.25 1)25a< 0.27 0.079(2 ( Aol ) lu(l (a )- 25
vw__ A 12 P
whereC pu 2
a
. '/ pU 22, AO co
These approximate equations for shear stress are used during the computation. At each computational time and location, the Reynolds number based on hydraulic diameter is checked to determine whether the flow is laminar or turbulent and the corresponding formula is used. It turns out that in this study, the Reynolds number is always below
the critical value, so only the laminar flow expressions are used. Unsteadiness can also
influence the shear stress. To determine if this needs to be considered, we can estimate the time required for the Stokes boundary layer thickness, 6 4V- to become
period of elevated flow is approximately 1-2 sec and (iii) any estimate of shear stress that takes account of unsteadiness, short of a full solution of the Navier-Stokes equation, will be subject to error, we have decided not to attempt any correction to the quasi-steady shear stress calculations.
The MacCormack two step, predictor-corrector scheme is used to solve the equations. The network used in an earlier study [31] was used here to simuiate the veins extending from the 'ankle' to the 'thigh'. The network is described by the distributions of total cross-sectional area, wave speed (both at zero stress), and total number of
vessels in parallel, all expressed as functions of axial distance along the leg.
External compression is applied between the ankle and the knee using two different axial pressure distributions characteristic of those currently used in clinical devices
and that can be produced using a two-segment compression sleeN e or cuff.
Axially-uniform -- a time-varying pressure is applied uniformly between the ankle ,nd
knee. Pressure application is rapid, reaching its maximum value of 50 mmHg in 0.5 s,
then held constant for 4 s, consistent with previous estimates of pressure and timing to produce maximal flows and vessel collapse Circumferential distributions are either C
Uniform Pressure
t
LIIf
t t t
tii
Ankle Knee Thigh
O Flow direction
Figure 2-11 (a) Axially-uniform pressure along the leg
Graded-sequential -- the region between the ankle and knee is divided into two equal
segments. The distal half is compressed first, attaining a maximum pressure of 55 mmHg in 0.5 s; the proximal half is compressed following a 0.3 s delay to a slightly smaller pressure of 45 mmHg. Once attained, maximal pressures are held in the
respective regions for 4 s (Figure 2-1 1 (b)).
p
Two compartment, graduated, sequential
I T T
t
.1.1..
Ankle Knee Thigh
_W Flow direction
Figure 2-11 (b) Graded-sequential pressure along the leg
I 1
t
1 1 ' 1 1 · · · · ·i -· - --LI
-pIIn these simulations, parameter values have been chosen to mimic those currently employed in the Aircast VenaFlow unit (Aircast, Inc., Summit, NJ). Slower rise times are typically used in other commercial units; however, these have previously been shown to be less effective in terms of generating high flow rates and high shear stresses throughout the lower leg [29, 31]. It was assumed that a two-compartment device was used to generate graded-sequential compression as a practical matter, again consistent with units currently in clinical use. Peak pressures are similar to those used in all commercially-available systems. Thus, to limit the parameter space, only rapid compressions to pressures sufficient to produce maximal venous emptying were simulated.
Results of blood flow simulation
The flow simulation results are presented in three formats to highlight the effectiveness of the method in producing vessel collapse, to generate high flow velocities, and to enhance the level of shear stress throughout the veins of the lower leg. Figure 2-12 shows the vein at several stages during compression by each of the four combinations of circumfere, .ially-symmetric (C) and asymmetric (A) compressions, and axially-uniform and graded-sequential distributions along the leg axis. By a time of 1-2 s, the vessels in each case have essentially reached a steady, collapsed configuration. The degree of collapse with C compression is less than with A compression, consistent with the earlier results of the FEA. With axially-uniform compression, collapse occurs first near the knee, producing a localized constriction through which the blood in the rest of the lower leg must empty, thereby reducing both the rate of emptying, and the degree of collapse at the end of compression.
8 X (m) Figure 2-12(a) 0.2 0.4 0.6
X (m)
0.8 Figure 2-12(b) 1 0 0.5 1 0 0 01 0.5 0.2 x (n) 0.6 8 Figure 2-12(c)
0.5
0.5
0.2 0.4 0.6X (m)
0.8 Figure 2-12(d)Figure 2-12 Normalized venous cross-sectional area following the application of external pressure as a function of distance from the "ankle"; time interval between the curves is 0.2 s. (a) C compression with uniform longitudinal pressure application. (b) C compression with two-compartment, graded-sequential pressure application, (c) A compression with the uniform longitudinal pressure application. (d) A compression with the two-compartment, graded-sequential pressure
The calculated flow velocity at the end of the simulated vein (near the "thigh") is plotted with different compression modes and pressure applications in Figure 2-13. It is seen that regardless of the axial distribution of pressure, A compression generates significantly higher blood flow velocities than circumferential compression. Since the duration of elevated flow is about the same for all three methods, the difference in peak flow velocity is apparently due to the greater degree of collapse that results from non-uniform circumferential pressurization. The differences in peak flow rate between axially-uniform and graded-sequential compressions are relatively small in these comparisons; however, graded-sequential is clearly superior to uniform compression at points within the calf due to the surge of blood flow produced by the initial compression of the lower segment that propagates throughout the upper calf region.
Symmetric compression Asymmetric compression Time (s Figure 2-13(a) ) U.L 0.7 0.6 cn 0.5 'u 0.4 0.3 0.2 0.1 0 II 4
0.7 0.6
i 0.5
._ o 0.4 3 0.3 0.2 0.1 n----
-
- Symmetric compression "0 1 2 3 4 Time (s) Figure 2-13(b)Figure 2-13 Calculated blood flow velocity at the thigh. (a) Uniform pressure application. (b) Two-compartment, graded-sequential pressure application.
Figures 2-14 show the distribution of shear stress along the veins at several times during compression. These plots show somewhat greater differences between C and A
compression than the flow rate plots, reflecting the combined effect of higher flow rate
and greater venous collapse with the latter (compare peak values during uniform axial
compression of less than 50 dyn/cm2 in C compression to values over 200 dyn/cm2
AA U.6
in that there are two spatial peaks in shear stress at the proximal ends of the two independent compression zones, one of which lies within the muscular region of the calf. EU 200 150 CA c(
100
50 n () 0.2 0.4 0.6 X (m) 0.8 Figure 2-14(a) Ae·· v_250 200 C-,-50
I100
00 0.2 0.4 0.6 0.8X (m)
Figure 2-14(b)250 200 "150 r./ 100 50 A 0 0.2 0.4 0.6 u.
X (m)
Figure 2-14(c)'OU 200
;150
co I 100 50 0 BX (m)
Figure 2-14(d)Figure 2-14 Calculated wall shear stress as a function of distance from the "ankle"; time interval between the curves is 0.2 s. (a) C compression with uniform pressure application. (b) C compression with the two compartment, graded-sequential pressure application. (c) A compression with the uniform pressure application. ( d) A compression with the two compartment, graded-sequential pressure application.
Also of potential importance is the total endothelial surface area exposed to elevated shear stress since the cells respond to shear only when it exceeds a certain threshold. As discussed below, various studies have shown this threshold value to be in the range of about 10-20 dynes/cm2. In Table 2-2 are presented the computed surface areas
differences are seen between C and A compression, with A proving to be generally more effective in increasing the level of shear stress.
Table 2-2 Percent of vessel wall subjected to certain level of shear stress (Young's modulus of muscle = 1.2x1O4Pa)
Symmetric Asymmetric
Uniform Graded Uniform Graded
tw > Iodynlcm 2 57% 64% 6 64% 79%
rw> 20dyn/cn12 14% 6% 55% 60%
r., > 40dyn /cm2 1% 0% 10%
9%
Table 2-3 presents a comparison of the percent of blood remaining in the lower leg (x
< 0.4 m) at different stages during compression as a measure of the effectiveness of each mode of compression in preventing the pooling of venous blood. At the end of compression, A is seen to be more effective in eliminating blood than C, but the differences between uniform and graded compression are generally small and without consistent trend.
Table 2-3 Percent of blood left in the lower leg Young's modulus of muscle = 1.2xlO4Pa
Symmetric Asymmetric
Uniform Graded Uniform Graded
at 1 s 55% 56% 45% 35%
at 2 s 45% 43%0 35% 26%
at 4 s 42% 42%o 31% 24%7
2-reducing the Young's modulus of muscle tends to reduce the differences between C and A compression modes, it increases the differences seen between uniform and graded compression with graded becoming significantly more effective by both measures .
Table 2-4 Percent of vessel wall subjected to certain level of shear stress (Young's modulus of muscle = 0.6xl04Pa)
Symmetric Asymmetric
Uniform Graded Uniform Graded
r z> Odyn/cm 2 57% 75% 59%0 77%
z, > 20dyn /cm2 537% 65%o 53%o 66%
tw> 40dyn/cm2 9% 9% 13%o 11%
Table 2-5 Percent of blood left in the lower leg Young's modulus of muscle = 0.6xlO4Pa
Symmetric Asymmetric
Uniform Graded Uniform Graded
at 1 s 54% 36% 48% 31%
at 2 s 43%o 27% 38%o 24%
at 4 s 35% 23% 32%o 21%
Discussion
currently available that differ in terms of the extent of coverage (foot only, calf only, calf and thigh), the number of separate cuffs (1, 2, or 4) and the timing and rate of compression. The lack of consensus likely is due to several factors. One is that the different approaches to EPC have not been rigorously tested against each other. Another is the lack of a fundamental understanding of the mechanism by which the protection is conferred. Early studies focused on the prevention of stasis and the potential role of fluid shear stress in dislodging incipient thrombi. This notion, however, neglects the biological factors such as fibrinolysis which are strongly influenced in endothelial cell cultures by fluid shear stress. Other antithrombotic and prothrombotic aspects of the vascular wall cell response to mechanical stress have been minimally investigated. It is reasonable to assume, given the complex scheme of thrombosis regulation by the vascular wall, that other antithrombotic endothelial functions are also affected by mechanical stimulus.
Previous studies [12, 29, 31] have investigated the effects of pressure level, rate of pressurization, and, in the case of multi-segmented compression devices, the relative pressure levels and timing of compression. These were studied and optimized with respect to the objectives of producing the greatest degree of vessel emptying, the highest flow velocities, and the highest shear stresses throughout the venous network of the lower leg. These previous investigations led to the conclusions that graded-sequential methods of compression were hemodynamically superior to uniform compression, that pressures of about 45 mmHg should be applied as rapidly as possible (reaching maximum pressure in less than 0.5 s), and that the sequence of compression should be such that the delay between segmental inflations should be no
more than about 0.25 s.
fibrinolytic function of the endothelium in the prevention of DVT. This raises the
question as to whether the previously defined "optima" are indeed optimal with regard
to cellular antithrombotic function. In addition, other modalities of leg compression involving asymmetric circumferential pressures have recently been introduced with the potential for greater flow enhancement with the same or lower levels of pressurization. The focus of the present study was therefore on the potential role of tissue deformations and fluid dynamic shear stress to then better direct studies of endothelial function relating to fibrinolysis and thrombosis regulation. A secondary consideration was the influence of non-uniform distributions of pressure around the leg circumference that might better promote vessel collapse.
Flows generated by external compression are characterized by a rapid rise to peak velocities, as measured in the popliteal or femoral veins, of nearly 1 m/s. At these velocities, wave speed flow limitation (flow speed equaling the local speed of wave propagation [38] prevents further acceleration of the blood. The flow acceleration is associated with collapse of the vessels at the proximal end of the compression zone that impedes subsequent emptying. It was the formation of the restrictive throat, and the desire to minimize its deleterious effects, that led to the introduction of graded, sequential, and graded-sequential compression modalities. Following the period of
elevated flow that typically lasts about I s, the vessels reach a state of near maximal
collapse which, even in steady-state, decreases distally due to the pressure drop in the collapsed veins associated with the much lower baseline flow through the capillary
bed.
In comparing the A and C distributions of pressure, the former was found to be superior by most measures. This difference is primarily attributable to the fact that A
for all but the very smallest pressure levels (Figure 2-8). Thus even though the total force (pressure integrated over the surface area) applied to the leg is less with A than C, the effectiveness in producing vessel collapse is greater. While peak flow rates are roughly the same with the two methods, the greater collapse produced by A compression (Figure 2-12) leads to considerably higher shear stresses (Figure 2-14), and greater collapse for both uniform and graded-sequential pressure applications.
Shear stress likely affects DVT in two ways; by dislodging incipient thrombi before they are large enough to significantly compromise respiratory function, and through their effect on the production and release of fibrinolytic agents by the venous endothelium. It is difficult to estimate the level of stress needed to dislodge a small aggregate from the wall of the vessel, but it is likely the peak shear stress that is of greatest consequence. The highest shear stresses, approaching 250 dyn/cm2, are
produced with A uniform compression. However, these high levels are concentrated at the knee and affect primarily the popliteal vein rather than the muscular veins where most thrombi are thought to originate. For this reason, graded-sequential compression
is likely to be more effective with regard to dislodging small thrombi because, despite
the lower peak shear stresses generated at the knee, the level of shear in the mid-calf region, where most thrombi are thought to originate, is considerably higher (Figure 2-14). If account for the amount of blood been removed from the leg (Table 2-2,3,4,5), graded, sequential compression empty the veins more completely than uniform compression. These results suggest that sequential gradient compression produces the type of hemodynamic alterations needed to reduce the risk of DVT by achieving a sustained increase in venous blood flow and more completely emptying of the veins in
the leg.
elevation is highest with uniform and A compression modes. However, what might be more important is to increase shear throughout the leg veins. Although the graded response to shear has not yet been studied, if the response were to saturate either due to finite cellular stores for secretion or limits to the rate of synthesis of hew product, it might be more important to elevate shear above some threshold level in many cells rather than elevate it to even higher levels in a relatively small number. In this thesis,
our in vitro cell culture studies (chapter 4 and 5) support this view. From the results,
there exist a threshold of shear that endothelial cell can response to. If the peak shear stress is below 10 dyn/cm2, there are no changes of mRNA expression in all the
candidate genes. Therefore, elevating peak shear stress above certain threshold in relatively large area of endothelial cells is important in terms of overall thromboregulation. Because of the venous architecture of the lower leg, the many muscular veins empty primarily through a single vessel, the popliteal vein. Therefore, the region of highest shear stress in Figure 2-14 corresponds to a relatively small endothelial surface area. By contrast, the lower region (x < 0.3) represents many parallel vessels with total circumference, according to the network characteristics used
in the calculation, 4 times as great as at the level of the knee. In view of this, the shear
distribution of Figure 2-14(d) corresponding to graded-sequential compression might well elicit a greater biologic response than the localized increase of uniform compression (Figure 2-14(c)). A comparison of Figure 2-14 (a), (b) and (c), (d) demonstrate that A compression is significantly more effective at all locations than C compression, for the reasons discussed above.
Another factor to consider is the potential for damage to the endothelium due to high shear stresses, or the activation of platelets, either of which could promote thrombus formation. It is difficult to extrapolate from the present calculations to predict either of these events. In particular, platelet activation involves a complex interaction of local
the present work. The present studies, however, point to possible deleterious effects of certain types of compression that deserve further study.
In contrast to the situation in arteries that are normally distended by positive transmural pressures, venous collapse produces strains that vary widely around the vessel circumference (Figure 2-9 and 2-10). Further, the magnitude of strain is a function not only of the pressure difference acting across the vessel, but also the distribution of pressure around the limb. Interestingly, both compression modes, C and A, produce strains of comparable magnitude, up to about 20%. The distributions differ, however, as does the dependence on level of external pressure. Because of this complex behavior, it is difficult to identify conditions that might optimize fibrinolytic or antithrombotic vascular wall cell response. But since the levels of strain are comparable to those that elicit a tPA response in endothelial cultures [39], the deformation of the wall needs to be considered in terms of the overall response of the venous endothelium. Whether intermittent vessel collapse elicits endothelial gene expression will be studied in the following chapters (chapter 4 and 5).
Chapter 3 Endothelial cells in thrombosis and homeostasis
It has been recognized for over 150 years that abnormalities in blood flow, vessel wall
and coagulation factors may contribute to thrombosis (Virchow's triad). EPC devices increase blood flow and eliminate venous stasis in the lower leg, therefore, decrease the risk of thrombosis. This simplified view is now modified by the recognition that the process of thrombus formation (thrombogenesis) and thrombus inhibition (thromboresistance) requires complex interactions involving the vascular endothelium, platelet aggregation and clotting factors. In this complex process of thrombus regulation, the vascular endothelium plays a critical role. It produces many substances which are closely associated with thrombosis, homeostasis and fibrinolysis [40]. It is now well known that changes of hemodynamic conditions can regulate endothelial cell function [41]. These findings suggest that many mechanisms of EPC can be further understood from how endothelial cell thromboregulatory function is influenced by hemodynamic forces. In this chapter, we review the role of endothelial cells in thrombosis and homeostasis, and then examine the influence of hemodynamic forces on endothelial cell functions. Finally, we present the candidate genes related to
coagulation that we will investigate in this thesis.
Role of the endothelial cell in regulating thrombosis
Endothelial cells modulate several aspects of the homeostasis-coagulation sequence. On the one hand, they possess anti-platelet, anti-coagulant, and fibrinolytic properties; on the other hand, when injured or activated they exert procoagulant function. The balance between endothelial antithrombotic and prothrombotic activities often determines whether thrombus formation, propagation or dissolution occurs [40].
The intact endothelium has long been considered to serve as an anti-coagulatory barrier separating blood from the vessel wall contents and through control of its permeability, regulating the traffic of blood borne elements. It has become clear that by synthesizing and secreting a number of potent substances, the endothelium plays a key role in controlling the vascular tone, coagulation states, and the structure of the blood vessels. Furthermore, the endothelium appears to sense variations in shear stress and transduce those signals into biological responses which can have significant physiological and pathophysiological implications including angiogenesis, inflammation, thrombosis, and vasomotor function [42]. In the following paragraphs, we list some of the endothelial cell's thrombo-regulatory mechanisms.
Antiplatelet factors
Prostacyclin PGI2 is a multifunctional molecule. It is a potent inhibitor of platelet
activation, secretion and aggregation [43]. It induces vascular smooth muscle cell relaxation, blocks monocyte-endothelial interaction, and reduces smooth muscle cell lipid accumulation. PGI2is synthesized primarily by vascular endothelial cells and
smooth muscle cells. Its synthesis is catalyzed by a series of enzymes including cyclooxygenase (COX-1, 2).
Nitric Oxide NO is an important mediator in the regulation of vasomotor function,
immune response and neurotransmission [22]. NO also inhibits platelet activation and aggregation. The role of NO in vasorelaxation was discovered when Furchgott & Zawadzki noted that blood vessels depleted of endothelium failed to relax when treated with acetylcholine [44]. They postulated that endothelium elaborates the factors (EDRF) responsible for acetylcholine induced vasorelaxation. The major component of EDRF was subsequently found to be NO. Biosynthesis of NO is
where it causes smooth muscle cell relaxation by activating guanylyl cyclase and increasing cytosolic cyclic guanosine monophosphate. NO may also diffuse into the luminal side where it enters platelets and inhibits platelet adhesion, activation and aggregation.
PGI2and NO are produced simultaneously during endothelial cell activation, and they
act synergistically not only to inhibit platelet adhesion and aggregation, but also to reverse platelet aggregation [45]. The synergistic inhibition of platelet activation by these two molecules is of considerable importance in maintaining blood fluidity and controlling thrombus formation. Both of these two molecules also induce vascular smooth muscle cell relaxation.
Ecto-ADPase Endothelial surfaces possess an enzyme activity that degrades ADP to
AMP. This enzyme is given the term ecto-ADPase. As ADP released from activated platelets is an important mediator for recruiting and amplifying platelet aggregation, ecto-ADPase may play a physiologic role in limiting the extent of platelet aggregation
[46].
Vasomotor function
Vasodilation Endothelial cells secrete NO and PGI2, contributing to the regulation of
blood pressure and blood flow. By expressing angiotensin converting enzyme (ACE), the endothelium plays a role in the control of angiotensin II action, a potent vasoconstrictor [47].