EUROPEAN ORGANISATION FOR NUCLEAR RESEARCH (CERN)
Physics Letters B 761 (2016) 350 - 371
DOI:10.1016/j.physletb.2016.08.042
CERN-EP-2016-114 22nd September 2016
Measurement of the top quark mass in the t ¯t → dilepton channel
from
√
s
= 8 TeV ATLAS data
The ATLAS Collaboration
Abstract
The top quark mass is measured in the t¯t → dilepton channel (lepton= e, µ) using ATLAS data recorded in the year 2012 at the LHC. The data were taken at a proton–proton centre-of-mass energy of √s = 8 TeV and correspond to an integrated luminosity of about 20.2 fb−1. Exploiting the template method, and using the distribution of invariant masses of lepton–b-jet pairs, the top quark mass is measured to be mtop = 172.99 ± 0.41 (stat) ± 0.74 (syst) GeV, with a total uncertainty of 0.84 GeV. Finally, a combination with previous ATLAS mtop measurements from √s = 7 TeV data in the t¯t → dilepton and t¯t → lepton+jets channels results in mtop= 172.84 ±0.34 (stat) ±0.61 (syst) GeV, with a total uncertainty of 0.70 GeV.
c
2016 CERN for the benefit of the ATLAS Collaboration.
Reproduction of this article or parts of it is allowed as specified in the CC-BY-4.0 license.
1 Introduction
The mass of the top quark (mtop) is an important parameter of the Standard Model (SM) of particle physics. Precise measurements of mtopprovide crucial information for global fits of electroweak paramet-ers [1–3] which help assess the internal consistency of the SM and to probe its extensions. In addition, the value of mtopaffects the stability of the SM Higgs potential, which has cosmological implications [4–6]. Many measurements of mtophave been performed by the Tevatron and LHC collaborations. Combining a selection of those, the first Tevatron+LHC mtopresult is mtop= 173.34 ±0.27 (stat) ±0.71 (syst) GeV, with a total uncertainty of 0.76 GeV [7]. Meanwhile, a number of new results have become available [8–13], some of which are more precise than the above combination. The latest ATLAS results in the t¯t → lepton+jets and t¯t → dilepton decay channels, both with electrons (e) and muons (µ) in the final state [14], are mtop = 172.33 ± 0.75 (stat) ± 1.02 (syst) GeV and mtop = 173.79 ± 0.54 (stat) ± 1.30 (syst) GeV, respectively.
This Letter presents a new measurement of mtopobtained in the t¯t → dilepton decay channel using 2012 data taken at a proton–proton (pp) centre-of-mass energy of √s = 8 TeV, with an integrated luminosity of about 20.2 fb−1. The analysis exploits the decay t¯t → W+W−b¯b →`+`−ν¯νb¯b, which is realised when both W bosons decay into a charged lepton and its corresponding neutrino. In the analysis, the t¯t decay channels ee, eµ and µµ (including τ → e, µ) are combined and referred to as the dilepton channel. Single-top-quark events with the same lepton final states are included in the signal. Given the larger data sample compared to Ref. [14], the event selection was optimised to achieve the smallest total uncertainty. The measurement is based on the implementation of the template method described in Ref. [14], which is calibrated using signal Monte Carlo (MC) samples. Consequently, the top quark mass measured in this way corresponds to the mass definition used in the MC program.
2 ATLAS detector
The ATLAS experiment [15] at the LHC is a multi-purpose particle detector with a forward-backward symmetric cylindrical geometry and a near 4π coverage in solid angle.1 It consists of an inner tracking detector surrounded by a thin superconducting solenoid providing a 2 T axial magnetic field, electro-magnetic and hadron calorimeters, and a muon spectrometer. The inner tracking detector covers the pseudorapidity range |η| < 2.5. It consists of silicon pixel, silicon microstrip, and transition radiation tracking detectors. Lead/liquid-argon (LAr) sampling calorimeters provide electromagnetic (EM) energy measurements with high granularity. A hadronic (steel/scintillator-tile) calorimeter covers the central pseudorapidity range (|η| < 1.7). The end-cap and forward regions are instrumented with LAr calorimet-ers for EM and hadronic energy measurements up to |η| = 4.9. The muon spectrometer surrounds the calorimeters and is based on three large air-core toroid superconducting magnets with eight coils each. Its bending power is in the range from 2.0 to 7.5 T m. It includes a system of precision tracking chambers and fast detectors for triggering. A three-level trigger system is used to select events. The first-level trigger is implemented in hardware and uses a subset of the detector information to reduce the accepted
1ATLAS uses a right-handed coordinate system with its origin at the nominal interaction point (IP) in the centre of the detector
and the z-axis along the beam pipe. The x-axis points from the IP to the centre of the LHC ring, and the y-axis points upwards. Cylindrical coordinates (r, φ) are used in the transverse plane, φ being the azimuthal angle around the z-axis. The pseudorapidity is defined in terms of the polar angle θ as η= − ln tan(θ/2). Angular distance is measured in units of ∆R ≡ p(∆η)2+ (∆φ)2.
event rate to at most 75 kHz. This is followed by two software-based trigger levels that together reduce the accepted rate to 400 Hz on average depending on the data-taking conditions during 2012.
3 Data and MC samples
This analysis is based on pp collision data recorded in 2012 at √s = 8 TeV. The integrated data lu-minosity amounts to 20.2 fb−1with an uncertainty of 1.9% determined with the procedures described in Ref. [16].
The modelling of t¯t and single-top-quark signal events and of most background processes relies on MC simulations. For the simulation of signal events the Powheg-Box program [17–19] is used. The simulation of the top quark pair [20] and single-top-quark production in the Wt-channel [21] uses matrix elements at next-to-leading order (NLO) in the strong coupling constant αS, with the NLO CT10 [22] parton distribution function (PDF) and the parameter hdamp = ∞. The hdampparameter sets the resummation scale, which controls the transition from the matrix element to the parton shower (PS) simulation. Given that the event selection described below requires leptonic decay products of two W bosons, single-top-quark events in the s-channel and t-channel are found not to contribute to the sample.
The Pythia (v6.425) program [23] with the P2011C [24] set of tuned parameters (tune) and the corres-ponding CTEQ6L1 PDF [25] are employed to provide the parton shower, hadronisation and underlying-event modelling. The uncertainties due to QCD initial- and final-state radiation (ISR/FSR) modelling are estimated with samples generated with the Powheg-Box program interfaced to the Pythia program for which the parameters of the generation are varied to span the ranges compatible with the results of measurements of t¯t production in association with jets [26–28].
For mtop hypothesis testing, the t¯t and single-top-quark event samples are generated for five values of mtop in the range 167.5 to 177.5 GeV in steps of 2.5 GeV. For each mtop value, the MC samples are normalised according to the best available cross-section calculations, which for mtop = 172.5 GeV are σt¯t= 253+13−15pb [29–34] for t¯t production and σWt = 22.4 ± 1.5 pb [35] for single-top-quark production in the Wt-channel. The PDF+αS-induced uncertainties in these cross-sections are calculated using the PDF4LHC prescription [36] with the MSTW2008 68% CL NNLO PDF [37,38], CT10 NNLO PDF [22,39] and NNPDF2.3 5f FFN PDF [40], and are added in quadrature with the uncertainties due to the choices of the factorisation and renormalisation scales.
The simulation of W±or Z boson production in association with jets is performed with the Alpgen (v2.13) program [41] interfaced to the Pythia6 program using the CTEQ6L1 PDF and the corresponding AUET2 tune [42]. Diboson production processes (WW, WZ and ZZ) are simulated using the Alpgen program in-terfaced to the Herwig (v6.520) program [43] with the AUET2 tune and to the Jimmy (v4.31) program [44]. All samples are simulated taking into account the effects of multiple soft pp interactions (pile-up) re-gistered in the 2012 data. These interactions are modelled by overlaying simulated hits from events with exactly one inelastic (signal) collision per bunch crossing with hits from minimum-bias events that are produced with the Pythia (v8.160) program [45] using the A2M tune [46] and the MSTW2008 LO PDF. For this analysis, the observed values of the pile-up-related quantities hµi, the mean number of interactions per bunch crossing, and nvtx, the average number of vertices per event, are hµi= 20.7 and nvtx = 9.2. Finally, the samples undergo a simulation of the ATLAS detector [47] based on Geant4 [48], and are then processed through the same reconstruction software as the data. A number of samples used to assess systematic uncertainties are produced with a faster version of the simulation which, in addition to the full
simulation of the tracking, uses smearing functions and interpolates particle behaviour and calorimeter response, based on resolution functions measured in full-simulation studies, to approximate the results of the full simulation.
4 Data selection and event reconstruction
Triggers based on isolated single electrons or muons with energy or momentum thresholds of 24 GeV are used. The detector objects resulting from the top quark pair decay are electron and muon candidates, jets and missing transverse momentum (ETmiss). In the following, the term lepton is used for charged leptons (excluding τ leptons) exclusively.
Electron candidates [49] are required to have a transverse energy of ET > 25 GeV, a pseudorapidity of the corresponding EM cluster of |ηcluster|< 2.47, with the transition region 1.37 < |ηcluster|< 1.52 between the barrel and the end-cap calorimeter excluded. The muon candidates [50] are required to have transverse momentum pT > 25 GeV and |η| < 2.5. To reduce the contamination by leptons from heavy-flavour decays inside jets or from photon conversions, referred to as non-prompt (NP) leptons, strict isolation criteria are applied to the amount of activity in the vicinity of the lepton candidate [49,50].
Jets are built from topological clusters of calorimeter cells [51] with the anti-ktjet clustering algorithm [52] using a radius parameter of R = 0.4. Jets are reconstructed using the local cluster weighting (LCW) and global sequential calibration (GSC) algorithms [53–55] and required to satisfy pT > 25 GeV and |η| < 2.5. Muons reconstructed within a ∆R = 0.4 cone around the axis of a jet with pT > 25 GeV are not considered as charged-lepton candidates. In addition, jets within a∆R = 0.2 cone around an electron candidate are removed and finally electrons within a∆R = 0.4 cone around any of the remaining jets are discarded. The identification of jets containing b-hadrons, b-tagging, is used for event reconstruction and background suppression. In the following, irrespective of their origin, jets tagged by the b-tagging algorithm are referred to as b-tagged jets, whereas those not tagged are referred to as untagged jets. Sim-ilarly, whether they are tagged or not, jets originating from bottom quarks are referred to as b-jets and those from (u, d, c, s)-quarks or gluons as light jets. The working point of the neural-network-based MV1 b-tagging algorithm [56] corresponds to an average b-tagging efficiency of 70% for b-jets in simulated t¯t
events and rejection factors of 5 for jets containing a c-hadron and 137 for jets containing only lighter-flavour hadrons. To match the b-tagging performance in the data, pT- and η-dependent scale factors [56], obtained from dijet and t¯t → dilepton events, are applied to MC jets depending on their true flavour. The reconstruction of the EmissT is based on the vector sum of energy deposits in the calorimeters, projected onto the transverse plane. Muons are included in the ETmiss using their reconstructed momentum in the tracking detectors [57].
The contribution of events wrongly reconstructed as t¯t → dilepton events due to the presence of objects misidentified as leptons (fake leptons), is estimated from data [58]. The technique employed uses fake-lepton and real-fake-lepton efficiencies that depend on η and pT, measured in a background-enhanced control region with low EmissT and from events with dilepton masses around the Z peak [59].
The selection from Ref. [14] is applied as a pre-selection as follows:
1. Events are required to have a signal from the single-electron or single-muon trigger and at least one primary vertex with at least five associated tracks.
Selection Pre-selection Final selection Data 36359 9426 t¯tsignal 34300 ± 2700 9670 ± 770 Single-top-quark signal 1690 ± 110 363 ± 23 Fake leptons 240 ± 240 31 ± 31 Z+jets 212 ± 83 20.6 ± 8.5 WW/WZ/ZZ 57 ± 21 10.2 ± 3.8 Signal+background 36600 ± 2800 10100 ± 770
Expected background fraction 0.01 ± 0.01 0.01 ± 0.00
Data/ (Signal+background) 0.99 ± 0.07 0.93 ± 0.07
Matching efficiency [%] 78.4 ± 0.2 95.3 ± 0.4
Selection purity [%] 51.6 ± 0.1 69.8 ± 0.3
Unmatched events [%] 34.2 ± 0.1 26.7 ± 0.1
Wrongly matched events [%] 14.2 ± 0.1 3.4 ± 0.0
Table 1: The observed numbers of events in data after the pre-selection and the final selection. In addition, the expected numbers of signal events for mtop = 172.5 GeV and background events corresponding to the integrated data luminosity are given. Two significant digits are used for the uncertainties of the predicted numbers of events explained in the text. The lower rows report the matching performance evaluated for mtop= 172.5 GeV, using one significant digit for the statistical uncertainties.
2. Exactly two oppositely charged leptons are required, with at least one of them matching the recon-structed object that fired the corresponding trigger.
3. In the same-lepton-flavour channels, ee and µµ, EmissT > 60 GeV is required. In addition, the invariant mass of the lepton pair must satisfy m`` > 15 GeV, and must not be compatible with the Zmass within 10 GeV.
4. In the eµ channel the scalar sum of pTof the two selected leptons and all jets is required to be larger than 130 GeV.
5. The presence of at least two jets with pT > 25 GeV and |η| < 2.5 is required, and at least one of these jets has to be b-tagged.
The observed numbers of events in the data after this pre-selection, together with the expected numbers of signal and background events corresponding to the integrated data luminosity, are given in Table1. Assuming a top quark mass of mtop = 172.5 GeV, the predicted number of events is consistent with the one observed in the data within uncertainties. For all predictions, the uncertainties are estimated as the sum in quadrature of the statistical uncertainty, a 1.9% uncertainty in the integrated luminosity, and a number of additional components. For the signal, these are a 5.4% uncertainty in the t¯t cross-section, or a 6.0% uncertainty in the single-top-quark cross-section, as given in Sect.3. Finally, global 4.1%, 2.2% and 2.8% uncertainties are added, corresponding to the envelopes of the results from the eigenvector variations of the jet energy scale (JES), the relative b-to-light-jet energy scale (bJES) and the b-tagging scale factors, respectively. The background uncertainties contain jet-multiplicity-dependent uncertainties of about 40% in the normalisation of the Z+jets background and a 100% uncertainty in the normalisation of fake-lepton background.
The two jets carrying the highest MV1 weight are taken as the two b-jets originating from the decays of the two top quarks, and the two leptons are taken as the leptons from the leptonic W decays. From the two possible assignments of the two pairs, the combination leading to the lowest average invariant
[GeV] T,lb p 0 50 100 150 200 250 300 350 400 Events / 10 GeV 1 10 2 10 3 10 4 10 5 10 6 10 7 10
Data tt, mtop=172.5 GeV Uncertainty Single top NP/fake leptons Z+jets WW/WZ/ZZ ATLAS -1 =8 TeV, 20.2 fb s [GeV] T,lb p 0 50 100 150 200 250 300 350 400 Data/MC 0.8 1 1.2 (a) [GeV] T b-jet p 0 50 100 150 200 250 Entries / 5 GeV 1 10 2 10 3 10 4 10 5 10 6
10 Data tt, mtop=172.5 GeV
Uncertainty Single top NP/fake leptons Z+jets WW/WZ/ZZ ATLAS -1 =8 TeV, 20.2 fb s [GeV] T b-jet p 0 50 100 150 200 250 Data/MC 0.8 1 1.2 (b) [GeV] T Lepton p 0 50 100 150 200 250 Entries / 5 GeV 1 10 2 10 3 10 4 10 5 10 6
10 Data tt, mtop=172.5 GeV
Uncertainty Single top NP/fake leptons Z+jets WW/WZ/ZZ ATLAS -1 =8 TeV, 20.2 fb s [GeV] T Lepton p 0 50 100 150 200 250 Data/MC 0.8 1 1.2 (c) lb R ∆ 0 0.5 1 1.5 2 2.5 3 3.5 4 4.5 5 Entries / 0.2 1 10 2 10 3 10 4 10 5 10 6 10 7 10
Data tt, mtop=172.5 GeV Uncertainty Single top NP/fake leptons Z+jets WW/WZ/ZZ ATLAS -1 =8 TeV, 20.2 fb s lb R ∆ 0 0.5 1 1.5 2 2.5 3 3.5 4 4.5 5 Data/MC 0.8 1 1.2 (d)
Figure 1: Kinematic distributions obtained from the objects assigned to the two lepton–b-jet pairs for(a)the pre-selection, or(b)−(d)the final selection. The average pT of the two lepton–b-jet pairs, denoted by pT,`b, is shown in(a). The pT,`brequirement for the final selection is indicated by the vertical dashed line. The remaining distribu-tions show the pTof the b-jets in(b), the pT of the leptons in(c), and the∆R`bof the lepton and the b-jet for the two lepton–b-jet pairs in(d). The rightmost bin contains the overflow, if present. For all distributions, the number of predicted events is normalised to the one observed in the data. The hatched area corresponds to the statistical uncertainties in the prediction, the uncertainty bars to the statistical uncertainties in the data. For each figure, the ratio of data and prediction is also presented.
mass of the two lepton–b-jet pairs (m`b) is retained. To estimate the performance of this algorithm in MC simulated samples, the reconstruction-level objects are matched to the closest generator-level object based on a maximum allowed ∆R, being 0.1 for leptons and 0.3 for jets. A matched object is defined as a reconstruction-level object that falls within ∆R of any generator-level object of that type, and a correct match means that this generator-level object is the one it originated from. Due to acceptance losses and reconstruction inefficiency, not all reconstruction-level objects can successfully be matched to their generator-level counterparts, resulting in unmatched events. The matching efficiency is the fraction of correctly matched events among all the matched events, and the selection purity is the fraction of
correctly matched events among all events, regardless of whether they could be matched or not. The corresponding numbers for mtop= 172.5 GeV are reported in Table1.
Starting from this pre-selection, an optimisation of the total uncertainty in mtop is performed. A phase-space restriction based on the average pTof the two lepton–b-jet pairs (pT,`b) is used to obtain the smallest total uncertainty in mtop. The corresponding pT,`b distribution is shown in Fig.1(a). The smallest uncer-tainty in mtop corresponds to pT,`b > 120 GeV. The difference in shape between data and prediction is covered by the systematic uncertainty as detailed in Sect.6. This restriction is found to also increase the fraction of correctly matched events in the t¯t sample, and reduces the number of unmatched or wrongly matched events.
To perform the template parameterisation described in Sect.5, an additional selection criterion is applied, restricting the reconstructed m`bvalue (mreco`b ) to the range 30 GeV < mreco`b < 170 GeV. Applying both restrictions, the numbers of predicted and observed events resulting from the final selection are reported in Table1. Using this optimisation, the matching efficiency and the sample purity are much improved as
reported in the bottom rows of Table1, while retaining about 26% of the events. Using this selection, and the objects assigned to the two lepton–b-jet pairs, the kinematic distributions in the data are well described by the predictions, as shown in Fig.1for the transverse momenta of b-jets and leptons, and for the∆R`bof the two lepton–b-jet pairs.
5 Template fit and results in the data
The implementation of the template method used in this analysis is described in Ref. [14]. For this analysis, the templates are simulated distributions of mreco`b , constructed for a number of discrete values of mtop. Appropriate functions are fitted to these templates, interpolating between different input mtop. The remaining parameters of the functions are fixed by a simultaneous fit to all templates, imposing linear dependences of the parameters on mtop. The resulting template fit function has mtop as the only free parameter and an unbinned likelihood maximisation gives the value of mtop that best describes the data. Statistically independent signal templates, comprising t¯t and single-top-quark events, are constructed as a function of the top quark mass used in the MC generator. Within the statistical uncertainties, the sum of a Gaussian distribution and a Landau function gives a good description of the shape of the mreco`b distribution as shown in Fig. 2(a) for three values of mtop. With this signal choice, the background distribution is independent of mtop, and a Landau function is fitted to it. The sum of the signal template at mtop = 172.5 GeV and the background is compared to data in Fig.2(b). It gives a good description of the data except for differences that can be accounted for by a different top quark mass. In this distribution, the correctly matched events are concentrated in the central part, whereas the remainder is less peaked and accounts for most of the tails.
In this analysis the expected statistical precision as well as all systematic uncertainties are obtained from pseudo-experiments generated from MC simulated samples mimicking ATLAS data. To verify the in-ternal consistency of the method, 1000 pseudo-experiments per mass point are performed, correcting for oversampling [60]. Within uncertainties, and for all mtop values, the residuals and pull means are consistent with zero and the pull widths are consistent with unity, i.e. the estimator is unbiased and uncer-tainties are calculated properly. The expected statistical uncertainty is obtained from the distribution of the statistical uncertainty in the fitted mtopof the pseudo-experiments. For mtop= 172.5 GeV and the data luminosity it amounts to 0.41 ± 0.03 GeV, where the quoted precision is statistical. The mreco`b distribution in the data is shown in Fig.2(c)together with the corresponding fitted probability density functions for the
[GeV] reco lb m
50 100 150
Normalised events / 5 GeV
0.05 0.1 top m 167.5 GeV 172.5 GeV 177.5 GeV ATLAS Simulation [GeV] reco lb m 40 60 80 100 120 140 160 Ratio 0.6 0.81 1.2 1.4
(a) Signal templates in simulation
[GeV] reco lb m 40 60 80 100 120 140 160 Events / 2 GeV 0 100 200 300 400 500
600 Data tt, mtop=172.5 GeV
Uncertainty Correct match Wrong / no match Single top NP/fake leptons Z+jets WW/WZ/ZZ ATLAS -1 =8 TeV, 20.2 fb s [GeV] reco lb m 40 60 80 100 120 140 160 Data/MC 0.8 1 1.2 (b) mreco
`b in data and simulation
[GeV] reco lb m 40 60 80 100 120 140 160 Events / 2 GeV 0 100 200 300 400 500 Data 1% background Best fit Uncertainty ATLAS -1 =8 TeV, 20.2 fb s (c) Fit to mreco `b in data [GeV] top m 172.5 173 173.5 ) L max L 2 ln ( 0 0.5 1 1.5 2 ATLAS -1 =8 TeV, 20.2 fb s
(d) Logarithm of the likelihood
Figure 2: Simulated signal templates (histograms) for different values of mtoptogether with the template fits (curves) are given in(a). The mreco`b distribution observed in data in comparison to the prediction is shown in(b). Both figures show statistical uncertainties only. In(b)the background contributions are too small to be distinguished. The mreco`b distribution is shown in(c)for data with statistical uncertainties together with the fitted probability density functions for the background alone (barely visible at the bottom of the figure) and for the sum of signal and background. The uncertainty band corresponds to the total uncertainty in mtop. Finally, the corresponding logarithm of the likelihood as a function of mtopis displayed in(d).
background alone and for the sum of signal and background. The value obtained fixing the background contribution to its prediction is mtop = 172.99 ±0.41 (stat) GeV. The statistical uncertainty in mtopis taken from the parabolic approximation of the logarithm of the likelihood as shown in Fig.2(d). The observed and predicted values of the statistical uncertainty agree.
6 Uncertainties a
ffecting the m
topdetermination
The same systematic uncertainty sources as in Ref. [14] are investigated. Their impact on the analysis is mostly evaluated from pairs of samples expressing a particular systematic uncertainty, by constructing the corresponding templates and measuring the average difference in mtopof the pair from 1000 pseudo-experiments. To facilitate a combination with other results, every systematic uncertainty is assigned a statistical uncertainty, taking into account the statistical correlation of the considered samples. Following Ref. [61], the resulting uncertainty components are given in Table2irrespective of their statistical signi-ficance. The uncertainty sources are constructed so as to be uncorrelated with each another and thus the total uncertainty squared is calculated as the sum in quadrature of all components. The various sources of systematic uncertainties and the evaluation of their effect on mtop are briefly described in the following. The values are given in Table2.
Method: The mean value of the differences between the fitted and generated mtopfor the MC samples at various input top quark masses is assigned as the method calibration uncertainty. This also covers effects from limited numbers of MC simulated events in the templates.
Signal Monte Carlo generator: The difference in mtop between the event sample produced with the MC@NLO program [62,63] and the default Powheg sample, both generated at mtop= 172.5 GeV and us-ing the Herwig program for parton shower, hadronisation and underlyus-ing event, is quoted as a systematic uncertainty.
Hadronisation: The difference in mtop between samples produced with the Powheg-Box program and showered with either the Pythia6 program using the P2011C tune or the Herwig and Jimmy programs using the ATLAS AUET2 tune [42] is quoted as a systematic uncertainty. This includes different ap-proaches in parton-shower modelling and hadronisation, namely the Lund string model [64,65] and the cluster model [66]. The difference in shape between data and prediction observed for the pT,`b distribu-tion shown in Fig.1(a)is much reduced when using the Powheg+Herwig sample and therefore covered by this uncertainty. As a check to assess the maximum possible difference in mtopcaused by the mismod-elling of the pT,`b distribution, the predicted distribution is reweighted to the data distribution and the fit is repeated. The observed difference in mtop from the nominal sample is about 0.2 GeV, well below the statistical uncertainty in the data. Consequently, no additional uncertainty is applied. Finally, the calibra-tion of the JES and bJES, discussed below, is also partially based on a comparison of jet energy responses in event samples produced with the Herwig++ [67] and Pythia6 programs. However, it was verified [68] that the amount of double-counting of JES and hadronisation effects for the t¯t → lepton+jets channel is small.
Initial- and final-state QCD radiation (ISR/FSR): The uncertainty due to this effect is evaluated by comparing two dedicated samples generated with the Powheg-Box and Pythia6 programs that differ in several parameters, namely: the QCD scaleΛQCD, the transverse momentum scale for space-like parton-shower evolution Q2maxand the hdampparameter [69]. Half the observed difference between the up vari-ation and the down varivari-ation is quoted as a systematic uncertainty. For comparison, using the signal samples generated at mtop = 172.5 GeV, and only changing the hdampparameter but using a much larger range, i.e. from ∞ to mtop, the measured mtop is lowered by 0.23 ± 0.13 GeV, where the uncertainty is
√ s = 7 T eV √ s = 8 T eV Correlations Combinations m ` + jets top [Ge V] m dil top [Ge V] m dil top [Ge V] ρ01 ρ02 ρ12 m 7 T eV top [Ge V] m dil top [Ge V] m all top [Ge V] Results 172.33 173.79 172 .99 172.99 173 .04 172 .84 Statistics 0.75 0.54 0 .41 0 0 0 0.48 0 .38 0 .34 Method 0.11 ± 0.10 0.09 ± 0.07 0.05 ± 0.07 0 0 0 0.07 0.05 0.05 Signal Monte Carlo generator 0.22 ± 0.21 0.26 ± 0.16 0.09 ± 0.15 + 1 .00 + 1 .00 + 1 .00 0.24 0.10 0.14 Hadronisation 0.18 ± 0.12 0.53 ± 0.09 0.22 ± 0.09 + 1 .00 + 1 .00 + 1 .00 0.34 0.24 0.23 Initial-and final-state QCD radiation 0.32 ± 0.06 0.47 ± 0.05 0.23 ± 0.07 − 1 .00 − 1 .00 + 1 .00 0.04 0.24 0.08 Underlying ev ent 0.15 ± 0.07 0.05 ± 0.05 0.10 ± 0.14 − 1 .00 − 1 .00 + 1 .00 0.06 0.10 0.02 Colour reconnection 0.11 ± 0.07 0.14 ± 0.05 0.03 ± 0.14 − 1 .00 − 1 .00 + 1 .00 0.01 0.03 0.01 P arton distrib ution function 0.25 ± 0.00 0.11 ± 0.00 0.05 ± 0.00 + 0 .57 − 0 .29 + 0 .03 0.17 0.04 0.08 Background normalisation 0.10 ± 0.00 0.04 ± 0.00 0.03 ± 0.00 + 1 .00 + 0 .23 + 0 .23 0.07 0.03 0.04 W /Z + jets shape 0.29 ± 0.00 0.00 ± 0.00 0 0 0.16 0.00 0.09 F ak e leptons shape 0.05 ± 0.00 0.01 ± 0.00 0.08 ± 0.00 + 0 .23 + 0 .20 − 0 .08 0.03 0.07 0.05 Jet ener gy scale 0.58 ± 0.11 0.75 ± 0.08 0.54 ± 0.04 − 0 .23 + 0 .06 + 0 .35 0.41 0.52 0.41 Relati v e b -to-light-jet ener gy scale 0.06 ± 0.03 0.68 ± 0.02 0.30 ± 0.01 + 1 .00 + 1 .00 + 1 .00 0.34 0.32 0.25 Jet ener gy resolution 0.22 ± 0.11 0.19 ± 0.04 0.09 ± 0.05 − 1 .00 0 0 0.03 0.08 0.08 Jet reconstruction effi cienc y 0.12 ± 0.00 0.07 ± 0.00 0.01 ± 0.00 + 1 .00 + 1 .00 + 1 .00 0.10 0.01 0.04 Jet v erte x fraction 0.01 ± 0.00 0.00 ± 0.00 0.02 ± 0.00 − 1 .00 + 1 .00 − 1 .00 0.00 0.02 0.02 b -tagging 0.50 ± 0.00 0.07 ± 0.00 0.03 ± 0.02 − 0 .77 0 0 0.25 0.03 0.15 Leptons 0.04 ± 0.00 0.13 ± 0.00 0.14 ± 0.01 − 0 .34 − 0 .52 + 0 .96 0.05 0.14 0.09 E miss T 0.15 ± 0.04 0.04 ± 0.03 0.01 ± 0.01 − 0 .15 + 0 .25 − 0 .24 0.08 0.01 0.05 Pile-up 0.02 ± 0.01 0.01 ± 0.00 0.05 ± 0.01 0 0 0 0.01 0.05 0.03 T otal systematic uncertainty 1.03 ± 0.31 1.31 ± 0.23 0 .74 ± 0.29 0.77 0 .74 0 .61 T otal 1.27 ± 0.33 1.41 ± 0.24 0 .84 ± 0.29 − 0 .07 0 .00 0 .51 0.91 0 .84 0 .70 T able 2 : The three measured v alues of mtop together with their statistical and systematic uncertainty components are sho wn on the left. The middle part reports the estimated correlations ρij per pair of measurements, with 0, 1 and 2 denoting the `+ jets and dilepton measurements at √ s = 7 T eV (from Ref. [ 14 ]) and the dilepton measurement at √ s = 8 T eV, respecti v ely . Finally , the right part lists the mtop results for the combinations of the tw o measurements at √ s = 7 T eV, the tw o measurements in the dilepton channel and all measurements. F or the indi vidual measurements, the systematic uncertainty in mtop and its associated statistical uncertainty is gi v en for each source of uncertainty . Assigned correlations are gi v en as inte ger v alues, determined correlations as real v alues. The last line refers to the sum in quadrature of the statistical and systematic uncertainty components or the total correlations, respecti v ely .
statistical.
Underlying event (UE): The difference in UE modelling is assessed by comparing Powheg samples based on the same partonic events generated with the CT10 PDFs. The difference in mtop for a sample with the Perugia 2012 tune (P2012) and a sample with the P2012 mpiHi tune [24] is assigned as a sys-tematic uncertainty.
Colour reconnection (CR): This systematic uncertainty is estimated using samples with the same par-tonic events as for the UE uncertainty evaluation, but with the P2012 tune and the P2012 loCR tune [24] for PS and hadronisation. The difference in mtopis quoted as a systematic uncertainty.
Parton distribution function (PDF): The PDF systematic uncertainty is the sum in quadrature of three contributions. These are: the sum in quadrature of the differences in mtopfor the 26 eigenvector variations of the CTEQ PDF [25] and two differences in mtop obtained from reweighting the central CT10 PDF set to the MSTW2008 PDF [37] and the NNPDF23 PDF [40].
Background normalisation: The normalisations are varied simultaneously for the MC-based and the data-driven background estimates according to the above mentioned uncertainties.
Background shapes: Given the negligible uncertainty in the dilepton channel observed in Ref. [14], no shape uncertainty is evaluated for the MC-based background. For the data-driven background the shape uncertainty is obtained from the estimate of fake-lepton events using the matrix method [58].
Jet energy scale (JES): Mean jet energies are measured with a relative precision of about 1% to 4%, typically falling with jet pT and rising with jet |η| [70,71]. The large number of subcomponents of the total JES uncertainty are reduced by a matrix diagonalisation of the full JES covariance matrix. For each of the resulting 25 significant nuisance parameters [54] the corresponding uncertainty in mtop is calcu-lated. The total JES-induced uncertainty in mtopis obtained by the sum in quadrature of the results for the subcomponents.
Relative b-to-light-jet energy scale (bJES): The bJES is an additional uncertainty for the remaining differences between b-jets and light jets after the global JES is applied and therefore the corresponding uncertainty is uncorrelated with the JES uncertainty. Jets containing b-hadrons are assigned an additional uncertainty of 0.2% to 1.2%, with lowest uncertainties for high-pTb-jets [54].
Jet energy resolution (JER): The JER uncertainty is determined by the sum in quadrature of the mtop differences between the varied samples and the nominal sample or, where applicable, half the fitted differ-ence between the up variation and the down variation of the components of the eigenvector decomposition. Jet reconstruction efficiency (JRE): The JRE uncertainty is evaluated by randomly removing 2% of the jets with pT < 30 GeV from the MC simulated events prior to the event selection to reflect the precision with which the data-to-MC JRE ratio is known [53]. The mtop difference with respect to the nominal sample is taken as a systematic uncertainty.
Jet vertex fraction (JVF): When summing the scalar pT of all tracks in a jet, the JVF is the fraction contributed by tracks originating at the primary vertex. The uncertainty is evaluated by varying the re-quirement on the JVF within its uncertainty [72].
b-tagging: Mismodelling of the b-tagging efficiency and mistag rate is accounted for by the application of scale factors which depend on jet pTand jet η to MC simulated events [56]. The eigenvector decom-position [56,73] accounts for the uncertainties in the b-tagging, c/τ-tagging and mistagging scale factors. The final b-tagging uncertainty is the sum in quadrature of these uncorrelated components.
Lepton uncertainties: The lepton uncertainties measured in J/ψ → `` and Z → `` events are related to the electron energy or muon momentum scales and resolutions, and the trigger and identification ef-ficiencies [49,50,74]. For each component, the corresponding uncertainty is propagated to the analysis including the recalculation of the EmissT .
Missing transverse momentum (Emiss
T ): The remaining contribution to the E miss
T uncertainty stems from the uncertainties in calorimeter cell energies associated with low-pT jets (7 GeV < pT < 20 GeV),
without any corresponding reconstructed physics object or from pile-up interactions. Their impact is ac-counted for as described in Ref. [57].
Pile-up: Besides the component treated in the JES, the residual dependence of the fitted mtop on the amount of pile-up activity and a possible MC mismodelling is determined. The mtopdependence as func-tions of nvtx and hµi is found to be consistent in data and simulation. The corresponding uncertainty evaluated from the remaining difference is small.
The systematic uncertainties quoted in Table2carry statistical uncertainties. The statistical precision of a single sample fit is about 100 MeV. The statistical correlation of the samples is calculated from the fraction of shared events. Pairs of samples with only a change in a single parameter have high correla-tion and correspondingly low statistical uncertainty in the difference in mtop, while a pair of statistically independent samples results in a larger uncertainty.
In summary, the result in the dilepton channel at √s = 8 TeV of mtop = 172.99 ± 0.41 (stat) ± 0.74 (syst) GeV is about 40% more precise than the one obtained from the √s = 7 TeV data and the most precise single result in this decay channel to date. The increased precision is partly driven by a better knowledge of the JES and bJES. In addition, the applied optimisation procedure significantly re-duces the total systematic uncertainty, mostly due to a lower impact of the JES and theory modelling uncertainties.
7 Combination with previous ATLAS measurements
The combination of the mtop results follows the approach developed for the combination of the √
s = 7 TeV measurements in Ref. [14] including the evaluation of the correlations. For combining the meas-urements from data at different centre-of-mass energies a mapping of uncertainty categories is performed. Complex cases are the uncertainty components involving eigenvector decompositions such as the JES, the JER and the b-tagging scale factor uncertainties. The √s = 7 and 8 TeV measurements are treated as uncorrelated for the nuisance parameters of the JER and the b-tagging, c/τ-tagging and mistagging uncertainties. A correlated treatment of the estimators for the flavour-tagging nuisance parameters results in an insignificant change in the combination. The total JES uncertainty consists of about 20 eigenvector components, which partly differ for the analyses of √s = 7 and 8 TeV data, which make use of the EM+JES and the LCW+GSC [70] jet calibrations, respectively. For the combination, a mapping between uncertainty components at the different centre-of-mass energies is employed to identify the correspond-ing ones. The combination was found to be stable against variations of the assumptions for ambiguous cases.
The combination is performed using the best linear unbiased estimate (BLUE) method [75,76], imply-ing Gaussian probability density functions for all uncertainties, usimply-ing the implementation described in Ref. [77]. The central values, the list of uncertainty components and the correlations ρ of the estimators for each uncertainty component have to be provided. For the statistical, method calibration, MC-based background shape at √s = 7 TeV, and pile-up uncertainties in mtop the measurements are assumed to be uncorrelated. For the remaining uncertainties in mtop, when using ±1σ variations of a systematic ef-fect, e.g. when changing the bJES by ±1σ, there are two possibilities. When simultaneously applying a variation for a systematic uncertainty, e.g. +1σ for the bJES to a pair of analyses, e.g. the dilepton measurements at √s= 7 and 8 TeV, both analyses can result in a larger or smaller mtopvalue than what is obtained for the nominal case (full correlation, ρ= +1), or one analysis can obtain a larger and the other
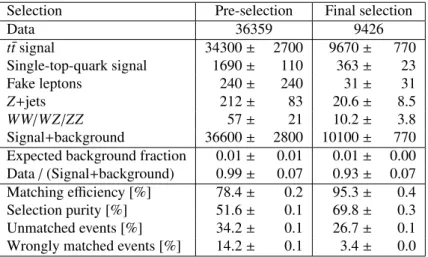
(7 TeV) [GeV] dil top m ∆ -0.8 -0.6 -0.4 -0.2 0 0.2 0.4 0.6 0.8 (8 TeV) [GeV] dil top m ∆ -0.8 -0.6 -0.4 -0.2 0 0.2 0.4 0.6 0.8 1 + = ρ 1 − = ρ ATLAS
(a)√s= 7 TeV versus√s= 8 TeV dilepton
(7 TeV) [GeV] l+jets top m ∆ -0.8 -0.6 -0.4 -0.2 0 0.2 0.4 0.6 0.8 (8 TeV) [GeV] dil top m ∆ -0.8 -0.6 -0.4 -0.2 0 0.2 0.4 0.6 0.8 1 + = ρ 1 − = ρ ATLAS
(b)√s= 7 TeV `+jets versus √s= 8 TeV dilepton
Figure 3: The pairwise differences in mtopwhen simultaneously varying both analyses for a systematic uncertainty. Each cross indicates the statistical precisions of the systematic uncertainty. The red full points indicate ρ= 1, the blue open points ρ= −1.
a smaller value (full anti-correlation, ρ= −1). Consequently, an uncertainty from a source only consist-ing of a sconsist-ingle variation, such as the uncertainty related to the choice of MC generator for signal events, results in a correlation of ρ= ±1. The estimator correlations for composite uncertainties are evaluated by adding the covariance terms of the subcomponents i with ρi = ±1 and dividing by the total uncertainties for that source. The resulting estimator correlation per uncertainty is quoted in Table2and used in the combination.
The evaluated uncertainties in mtopfor the uncertainty components for the two dilepton analyses, denoted by∆mdiltop, are shown in Fig.3(a). Each point represents a systematic uncertainty together with a cross, indicating the respective statistical precision of the systematic uncertainty in the two analyses. The red full points indicate ρ = 1, the blue open points ρ = −1. Given the similarity of the analyses, a posit-ive estimator correlation is observed for most uncertainty components of the two measurements in the dilepton channel. The corresponding distribution for the `+jets measurement at √s = 7 TeV and the dilepton measurement at √s= 8 TeV is given in Fig.3(b). In this figure, the estimates are anti-correlated for several significant uncertainties. This is caused by the in-situ measurement of the jet energy scale factor (JSF) and relative b-to-light-jet energy scale factor (bJSF) in the three-dimensional `+jets analysis, detailed in Ref. [14]. The resulting total correlation for this pair is very low as shown in Table 2. The combination strongly profits from this.
The central values of the three measurements, their uncertainty components, the determined correlations per pair of measurements and the results of the combinations are given in Table2. The pairwise dif-ferences in the three measurements are 0.75σ for the √s = 7 TeV measurements, 0.43σ for the `+jets measurement at √s= 7 TeV and the dilepton measurement at √s= 8 TeV and 0.66σ for the two dilepton measurements. For all three cases σ denotes the one standard deviation of the respective mtopdifference. The combined result in the dilepton channel alone is mdiltop = 173.04 ± 0.38 (stat) ± 0.74 (syst) GeV = 173.04 ± 0.84 GeV, providing no significant improvement with respect to the more precise result at√ s = 8 TeV which carries a BLUE combination weight of 0.94. This is a mere consequence of the measurement correlation of 0.51, which is close to the ratio of uncertainties (see Ref. [76]). The χ2
prob-ability of the combination is 51%. The stprob-ability of the combination is assessed from the results of 1000 combinations for which all input uncertainties are varied within their statistical uncertainties, which for some cases also result in different correlations (see Fig.3). The corresponding distributions of the central values and uncertainties of the combinations are approximately Gaussian, with a width of 0.03 GeV and of 0.04 GeV, respectively.
The combination of all three measurements provides a 17% improvement with respect to the most precise single input measurement. The combined result is malltop = 172.84 ± 0.34 (stat) ± 0.61 (syst) GeV = 172.84 ± 0.70 GeV. The χ2probability of the combination is 73% and the BLUE combination weights of the `+jets and dilepton measurements at √s = 7 TeV and the dilepton measurement at √s = 8 TeV are 0.30, 0.07 and 0.63, respectively. Again, the central value and the combined total uncertainty are both stable at the level of 0.03 GeV.
8 Conclusion
The top quark mass is measured in the t¯t → dilepton channel from about 20.2 fb−1 of √s = 8 TeV proton–proton collision data recorded by the ATLAS detector at the LHC. Compared to the latest ATLAS measurement in this decay channel, the event selection is refined exploiting the average pTof the lepton– b-jet pairs to enhance the fraction of correctly reconstructed events, thereby reducing the systematic uncertainties. Using the optimal point in terms of total uncertainty observed in a phase-space scan of this variable as an additional event selection criterion, the measured value of mtopis
mtop = 172.99 ± 0.41 (stat) ± 0.74 (syst) GeV,
with a total uncertainty of 0.84 GeV. The precision is mainly limited by systematic uncertainties, mostly by the calibration of the jet energy scale, and to a lesser extent by the calibration of the relative b-to-light-jet energy scale and by the Monte Carlo modelling of signal events.
This measurement is combined with the ATLAS measurements in the t¯t → lepton+jets and t¯t → dilepton decay channels from √s= 7 TeV data. The correlations of the measurements are evaluated for all sources of the systematic uncertainty. Using a dedicated mapping of uncertainty categories, the combination of the three measurements results in
mtop = 172.84 ± 0.34 (stat) ± 0.61 (syst) GeV,
with a total uncertainty of 0.70 GeV, i.e. a relative precision of 0.4%. The result is mostly limited by the calibration of the jet energy scales and by the Monte Carlo modelling of signal events.
Acknowledgements
We thank CERN for the very successful operation of the LHC, as well as the support staff from our institutions without whom ATLAS could not be operated efficiently.
We acknowledge the support of ANPCyT, Argentina; YerPhI, Armenia; ARC, Australia; BMWFW and FWF, Austria; ANAS, Azerbaijan; SSTC, Belarus; CNPq and FAPESP, Brazil; NSERC, NRC and CFI, Canada; CERN; CONICYT, Chile; CAS, MOST and NSFC, China; COLCIENCIAS, Colombia; MSMT
CR, MPO CR and VSC CR, Czech Republic; DNRF and DNSRC, Denmark; IN2P3-CNRS, CEA-DSM/IRFU, France; GNSF, Georgia; BMBF, HGF, and MPG, Germany; GSRT, Greece; RGC, Hong Kong SAR, China; ISF, I-CORE and Benoziyo Center, Israel; INFN, Italy; MEXT and JSPS, Japan; CNRST, Morocco; FOM and NWO, Netherlands; RCN, Norway; MNiSW and NCN, Poland; FCT, Por-tugal; MNE/IFA, Romania; MES of Russia and NRC KI, Russian Federation; JINR; MESTD, Serbia; MSSR, Slovakia; ARRS and MIZŠ, Slovenia; DST/NRF, South Africa; MINECO, Spain; SRC and Wallenberg Foundation, Sweden; SERI, SNSF and Cantons of Bern and Geneva, Switzerland; MOST, Taiwan; TAEK, Turkey; STFC, United Kingdom; DOE and NSF, United States of America. In addition, individual groups and members have received support from BCKDF, the Canada Council, CANARIE, CRC, Compute Canada, FQRNT, and the Ontario Innovation Trust, Canada; EPLANET, ERC, FP7, Ho-rizon 2020 and Marie Skłodowska-Curie Actions, European Union; Investissements d’Avenir Labex and Idex, ANR, Région Auvergne and Fondation Partager le Savoir, France; DFG and AvH Foundation, Ger-many; Herakleitos, Thales and Aristeia programmes co-financed by EU-ESF and the Greek NSRF; BSF, GIF and Minerva, Israel; BRF, Norway; Generalitat de Catalunya, Generalitat Valenciana, Spain; the Royal Society and Leverhulme Trust, United Kingdom.
The crucial computing support from all WLCG partners is acknowledged gratefully, in particular from CERN and the ATLAS Tier-1 facilities at TRIUMF (Canada), NDGF (Denmark, Norway, Sweden), CC-IN2P3 (France), KIT/GridKA (Germany), INFN-CNAF (Italy), NL-T1 (Netherlands), PIC (Spain), ASGC (Taiwan), RAL (UK) and BNL (USA) and in the Tier-2 facilities worldwide.
References
[1] ALEPH, CDF, D0, DELPHI, L3, OPAL, SLD Collaborations, the LEP Electroweak Working Group, the Tevatron Electroweak Working Group and the SLD Electroweak and Heavy Flavour GroupsarXiv:1012.2367 [hep-ex].
[2] M. Baak et al., The global electroweak fit at NNLO and prospects for the LHC and ILC,Eur. Phys.
J. C 74 (2014) 3046.
[3] K. A. Olive et al. (Particle Data Group), Review of Particle Physics,Chin. Phys. C 38 (2014)
090001.
[4] G. Degrassi et al., Higgs mass and vacuum stability in the Standard Model at NNLO,JHEP 8
(2012) 98.
[5] F. Bezrukov et al., The Standard Model Higgs boson as the inflaton,Phys. Lett. B 659 (2008) 703. [6] A. De Simone et al., Running Inflation in the Standard Model,Phys. Lett. B 678 (2009) 1.
[7] ATLAS, CDF, CMS and D0 Collaborations, First combination of Tevatron and LHC measurements of the top-quark mass,arXiv:1403.4427 [hep-ex].
[8] ATLAS Collaboration, Measurement of the top-quark mass in the fully hadronic decay channel from ATLAS data at √s= 7 TeV,Eur. Phys. J. C 75 (2015) 158.
[9] CDF Collaboration, T. Aaltonen et al., Measurement of the top-quark mass in the t¯t dilepton channel using the full CDF Run II data set,Phys. Rev. D 92 (2015) 032003.
[10] CDF Collaboration, T. Aaltonen et al., Measurement of the Top-Quark Mass in the All-Hadronic Channel using the full CDF data set,Phys. Rev. D 90 (2014) 091101(R).
[11] CMS Collaboration, Measurement of the top quark mass using proton-proton data at √(s)= 7 and 8 TeV,Phys. Rev. D 93 (2016) 072004.
[12] DØ Collaboration, V.M. Abazov et al., Precise measurement of the top quark mass in dilepton decays using optimized neutrino weighting,Phys. Lett. B 752 (2016) 18.
[13] DØ Collaboration, V.M. Abazov et al., Precision Measurement of the Top Quark Mass in Lepton+Jets Final States,Phys. Rev. Lett. 113 (2014) 032002.
[14] ATLAS Collaboration, Measurement of the top quark mass in the t¯t → lepton+jets and t¯t → dilepton channels using √s= 7 TeV ATLAS data,Eur. Phys. J. C 75 (2015) 330. [15] ATLAS Collaboration, The ATLAS Experiment at the CERN Large Hadron Collider,JINST 3
(2008) S08003.
[16] ATLAS Collaboration, Improved luminosity determination in pp collisions at √s= 7 TeV using the ATLAS detector at the LHC,Eur. Phys. J. C 73 (2013) 2518.
[17] P. Nason, A New Method for Combining NLO QCD with Shower Monte Carlo Algorithms,JHEP
11 (2004) 040.
[18] S. Frixione et al., Matching NLO QCD computations with Parton Shower simulations: the POWHEG method,JHEP 11 (2007) 70.
[19] S. Alioli, P. Nason, C. Oleari, and E. Re, A general framework for implementing NLO calculations in shower Monte Carlo programs: the POWHEG BOX,JHEP 06 (2010) 043.
[20] S. Frixione, P. Nason and G. Ridolfi, A Positive-Weight Next-to-Leading-Order Monte Carlo for Heavy Flavour Hadroproduction,JHEP 09 (2007) 126.
[21] E. Re, Single-top Wt-channel production matched with parton showers using the POWHEG method,Eur. Phys. J. C 71 (2011) 1547.
[22] H. L. Lai et al., New parton distributions for collider physics,Phys. Rev. D 82 (2010) 74024. [23] S. Mrenna et al., PYTHIA 6.4 Physics and Manual,JHEP 05 (2006) 26.
[24] P. Z. Skands, Tuning Monte Carlo Generators: The Perugia Tunes,Phys. Rev. D 82 (2010) 74018. [25] J. Pumplin et al., New generation of parton distributions with uncertainties from global QCD
analysis,JHEP 07 (2002) 12.
[26] ATLAS Collaboration, Measurement of t¯t production with a veto on additional central jet activity in pp collisions at √s= 7 TeV using the ATLAS detector,Eur. Phys. J. C 72 (2012) 2043.
[27] ATLAS Collaboration, Measurement of the tt production cross-section as a function of jet multiplicity and jet transverse momentum in 7 TeV proton-proton collisions with the ATLAS detector,JHEP 01 (2015) 20.
[28] ATLAS Collaboration, Comparison of Monte Carlo generator predictions to ATLAS measurements of top pair production at 7 TeV, ATL-PHYS-PUB-2015-002, 2015,
[29] M. Cacciari et al., Top-pair production at hadron colliders with next-to-next-to-leading logarithmic soft-gluon resummation,Phys. Lett. B 710 (2012) 612.
[30] P. Bärnreuther et al., Percent Level Precision Physics at the Tevatron: First Genuine NNLO QCD Corrections to q¯q → t¯t+ X,Phys. Rev. Lett. 109 (2012) 132001.
[31] M. Czakon and A. Mitov, NNLO corrections to top-pair production at hadron colliders: the all-fermionic scattering channels,JHEP 12 (2012) 54.
[32] M. Czakon and A. Mitov, NNLO corrections to top pair production at hadron colliders: the quark-gluon reaction,JHEP 01 (2013) 80.
[33] M. Czakon et al., The total top quark pair production cross-section at hadron colliders through
O(α4S),Phys. Rev. Lett. 110 (2013) 252004.
[34] M. Czakon and A. Mitov, Top++: a program for the calculation of the top-pair cross-section at hadron colliders,Comp. Phys. Com. 185 (2014) 2930.
[35] N. Kidonakis, Two-loop soft anomalous dimensions for single top quark associated production with a W−or H−,Phys. Rev. D 82 (2010) 54018.
[36] M. Botje et al., The PDF4LHC Working Group Interim Recommendations,arXiv:1101.0538
[hep-ph].
[37] A. D. Martin et al., Parton distributions for the LHC,Eur. Phys. J. C 63 (2009) 189.
[38] A. D. Martin et al., Uncertainties on αS in global PDF analyses and implications for predicted hadronic cross sections,Eur. Phys. J. C 64 (2009) 653.
[39] J. Gao et al., The CT10 NNLO Global Analysis of QCD,Phys. Rev. D 89 (2014) 33009. [40] R. D. Ball et al., Parton distributions with LHC data,Nucl. Phys. B 867 (2013) 244.
[41] M. L. Mangano et al., ALPGEN, a generator for hard multiparton processes in hadronic collisions,
JHEP 07 (2003) 1.
[42] ATLAS Collaboration, New ATLAS event generator tunes to 2010 data,
ATL-PHYS-PUB-2011-008, 2011,http://cds.cern.ch/record/1345343.
[43] G. Corcella et al., HERWIG 6.5: An Event generator for hadron emission reactions with interfering gluons (including supersymmetric processes),JHEP 01 (2001) 10.
[44] J. M. Butterworth et al., Multiparton interactions in photoproduction at HERA,Z. Phys. C 72
(1996) 637.
[45] T. Sjöstrand, S. Mrenna, and P. Skands, A Brief Introduction to PYTHIA 8.1,Comp. Phys. Com.
178 (2008) 852.
[46] ATLAS Collaboration, Summary of ATLAS PYTHIA 8 tunes, ATL-PHYS-PUB-2012-003, 2012,
http://cdsweb.cern.ch/record/1474107.
[47] ATLAS Collaboration, The ATLAS Simulation Infrastructure,Eur. Phys. J. C 70 (2010) 823. [48] S. Agostinelli et al., GEANT4: A simulation toolkit,Nucl. Instr. Meth. A 506 (2003) 250.
[49] ATLAS Collaboration, Electron reconstruction and identification efficiency measurements with the ATLAS detector using the 2011 LHC proton-proton collision data,Eur. Phys. J. C 74 (2014) 2941.
[50] ATLAS Collaboration, Measurement of the muon reconstruction performance of the ATLAS detector using 2011 and 2012 LHC proton-proton collision data,Eur. Phys. J. C 74 (2014) 3130. [51] ATLAS Collaboration, Topological cell clustering in the ATLAS calorimeters and its performance
in LHC Run 1, Submitted to Eur. Phys. J. C (2016) ,arXiv:1603.02934 [hep-ex]. [52] M. Cacciari et al., The anti-kt jet clustering algorithm,JHEP 04 (2008) 63.
[53] ATLAS Collaboration, Jet energy measurement with the ATLAS detector in proton-proton collisions at √s= 7 TeV,Eur. Phys. J. C 73 (2013) 2304.
[54] ATLAS Collaboration, Jet energy measurement and its systematic uncertainty in proton-proton collisions at √s= 7 TeV with the ATLAS detector,Eur. Phys. J. C 75 (2015) 17.
[55] ATLAS Collaboration, Monte Carlo Calibration and Combination of In-situ Measurements of Jet Energy Scale, Jet Energy Resolution and Jet Mass in ATLAS, ATLAS-CONF-2015-037, 2015.
http://cds.cern.ch/record/2044941.
[56] ATLAS Collaboration, Performance of b-jet identification in the ATLAS experiment,JINST 11
(2016) P04008.
[57] ATLAS Collaboration, Performance of missing transverse momentum reconstruction in proton-proton collisions at √s= 7 TeV with ATLAS,Eur. Phys. J. C 72 (2012) 1844.
[58] ATLAS Collaboration, Estimation of non-prompt and fake lepton backgrounds in final states with top quarks produced in proton-proton collisions at √s= 8 TeV with the ATLAS detector,
ATLAS-CONF-2014-058, 2014,http://cds.cern.ch/record/1951336.
[59] ATLAS Collaboration, Measurement of the top quark-pair production cross section with ATLAS in pp collisions at √s= 7 TeV,Eur. Phys. J. C 71 (2011) 1577.
[60] R. J. Barlow, Application of the Bootstrap resampling technique to Particle Physics experiments,
http://www.hep.man.ac.uk/preprints/1999.html.
[61] R. Barlow, Systematic errors: Facts and fictions,arXiv:hep-ex/0207026 [hep-ex].
[62] S. Frixione and B. R. Webber, Matching NLO QCD computations and parton shower simulations,
JHEP 06 (2002) 029.
[63] S. Frixione et al., Matching NLO QCD and parton showers in heavy flavour production,JHEP 08
(2003) 007.
[64] B. Andersson et al., Parton fragmentation and string dynamics,Phys. Rept. 97 (1983) 31. [65] B. Andersson, The Lund model. Cambridge University Press, 1997. ISBN 9780521017343. [66] B. Webber, A QCD Model for Jet Fragmentation Including Soft Gluon Interference,Nucl. Phys. B
238 (1984) 492.
[67] M. Bahr et al., Herwig++ Physics and Manual,Eur. Phys. J. C 58 (2008) 639.
[68] ATLAS Collaboration, Impact of fragmentation modelling on the top quark mass measurement using the ATLAS detector, ATL-PHYS-PUB-2015-042, 2015,
[69] ATLAS Collaborations, Comparison of Monte Carlo generator predictions for gap fraction and jet multiplicity observables in t¯t events, ATL-PHYS-PUB-2014-005, 2014,
http://cds.cern.ch/record/1703034.
[70] ATLAS Collaboration, Determination of the jet energy scale and resolution at ATLAS using Z/γ–jet events in data at √s= 8 TeV, ATLAS-CONF-2015-057, 2015,
http://cds.cern.ch/record/2059846.
[71] ATLAS Collaboration, Data-driven determination of the energy scale and resolution of jets reconstructed in the ATLAS calorimeters using dijet and multijet events at √s = 8 TeV, ATLAS-CONF-2015-017, 2015,http://cds.cern.ch/record/2008678.
[72] ATLAS Collaboration, Pile-up subtraction and suppression for jets in ATLAS, ATLAS-CONF-2013-083, 2013,http://cds.cern.ch/record/1570994.
[73] ATLAS Collaboration, Calibration of b-tagging using dileptonic top pair events in a combinatorial likelihood approach with the ATLAS experiment, ATLAS-CONF-2014-004, 2014,
http://cdsweb.cern.ch/record/1664335.
[74] ATLAS Collaboration, Electron and photon energy calibration with the ATLAS detector using LHC Run 1 data,Eur. Phys. J. C 74 (2014) 3071.
[75] L. Lyons et al., How to combine correlated estimates of a single physical quantity,Nucl. Instr.
Meth. A 270 (1988) 110.
[76] R. Nisius, On the combination of correlated estimates of a physics observable,Eur. Phys. J. C 74
(2014) 3004.
[77] R. Nisius, A ROOT class to combine a number of correlated estimates of one or more observables using the Best Linear Unbiased Estimate method,
The ATLAS Collaboration
M. Aaboud135d, G. Aad86, B. Abbott113, J. Abdallah64, O. Abdinov12, B. Abeloos117, R. Aben107, O.S. AbouZeid137, N.L. Abraham149, H. Abramowicz153, H. Abreu152, R. Abreu116, Y. Abulaiti146a,146b, B.S. Acharya163a,163b,a, L. Adamczyk40a, D.L. Adams27, J. Adelman108, S. Adomeit100, T. Adye131, A.A. Affolder75, T. Agatonovic-Jovin14, J. Agricola56, J.A. Aguilar-Saavedra126a,126f, S.P. Ahlen24, F. Ahmadov66,b, G. Aielli133a,133b, H. Akerstedt146a,146b, T.P.A. Åkesson82, A.V. Akimov96,
G.L. Alberghi22a,22b, J. Albert168, S. Albrand57, M.J. Alconada Verzini72, M. Aleksa32,
I.N. Aleksandrov66, C. Alexa28b, G. Alexander153, T. Alexopoulos10, M. Alhroob113, B. Ali128, M. Aliev74a,74b, G. Alimonti92a, J. Alison33, S.P. Alkire37, B.M.M. Allbrooke149, B.W. Allen116, P.P. Allport19, A. Aloisio104a,104b, A. Alonso38, F. Alonso72, C. Alpigiani138, M. Alstaty86,
B. Alvarez Gonzalez32, D. Álvarez Piqueras166, M.G. Alviggi104a,104b, B.T. Amadio16, K. Amako67, Y. Amaral Coutinho26a, C. Amelung25, D. Amidei90, S.P. Amor Dos Santos126a,126c, A. Amorim126a,126b, S. Amoroso32, G. Amundsen25, C. Anastopoulos139, L.S. Ancu51, N. Andari19, T. Andeen11,
C.F. Anders59b, G. Anders32, J.K. Anders75, K.J. Anderson33, A. Andreazza92a,92b, V. Andrei59a, S. Angelidakis9, I. Angelozzi107, P. Anger46, A. Angerami37, F. Anghinolfi32, A.V. Anisenkov109,c, N. Anjos13, A. Annovi124a,124b, C. Antel59a, M. Antonelli49, A. Antonov98,∗, F. Anulli132a, M. Aoki67, L. Aperio Bella19, G. Arabidze91, Y. Arai67, J.P. Araque126a, A.T.H. Arce47, F.A. Arduh72, J-F. Arguin95, S. Argyropoulos64, M. Arik20a, A.J. Armbruster143, L.J. Armitage77, O. Arnaez32, H. Arnold50,
M. Arratia30, O. Arslan23, A. Artamonov97, G. Artoni120, S. Artz84, S. Asai155, N. Asbah44,
A. Ashkenazi153, B. Åsman146a,146b, L. Asquith149, K. Assamagan27, R. Astalos144a, M. Atkinson165, N.B. Atlay141, K. Augsten128, G. Avolio32, B. Axen16, M.K. Ayoub117, G. Azuelos95,d, M.A. Baak32, A.E. Baas59a, M.J. Baca19, H. Bachacou136, K. Bachas74a,74b, M. Backes148, M. Backhaus32,
P. Bagiacchi132a,132b, P. Bagnaia132a,132b, Y. Bai35a, J.T. Baines131, O.K. Baker175, E.M. Baldin109,c, P. Balek171, T. Balestri148, F. Balli136, W.K. Balunas122, E. Banas41, Sw. Banerjee172,e,
A.A.E. Bannoura174, L. Barak32, E.L. Barberio89, D. Barberis52a,52b, M. Barbero86, T. Barillari101, M-S Barisits32, T. Barklow143, N. Barlow30, S.L. Barnes85, B.M. Barnett131, R.M. Barnett16, Z. Barnovska5, A. Baroncelli134a, G. Barone25, A.J. Barr120, L. Barranco Navarro166, F. Barreiro83, J. Barreiro Guimarães da Costa35a, R. Bartoldus143, A.E. Barton73, P. Bartos144a, A. Basalaev123, A. Bassalat117, R.L. Bates55, S.J. Batista158, J.R. Batley30, M. Battaglia137, M. Bauce132a,132b, F. Bauer136, H.S. Bawa143, f, J.B. Beacham111, M.D. Beattie73, T. Beau81, P.H. Beauchemin161,
P. Bechtle23, H.P. Beck18,g, K. Becker120, M. Becker84, M. Beckingham169, C. Becot110, A.J. Beddall20e, A. Beddall20b, V.A. Bednyakov66, M. Bedognetti107, C.P. Bee148, L.J. Beemster107, T.A. Beermann32, M. Begel27, J.K. Behr44, C. Belanger-Champagne88, A.S. Bell79, G. Bella153, L. Bellagamba22a, A. Bellerive31, M. Bellomo87, K. Belotskiy98, O. Beltramello32, N.L. Belyaev98, O. Benary153, D. Benchekroun135a, M. Bender100, K. Bendtz146a,146b, N. Benekos10, Y. Benhammou153, E. Benhar Noccioli175, J. Benitez64, D.P. Benjamin47, J.R. Bensinger25, S. Bentvelsen107, L. Beresford120, M. Beretta49, D. Berge107, E. Bergeaas Kuutmann164, N. Berger5, J. Beringer16, S. Berlendis57, N.R. Bernard87, C. Bernius110, F.U. Bernlochner23, T. Berry78, P. Berta129, C. Bertella84, G. Bertoli146a,146b, F. Bertolucci124a,124b, I.A. Bertram73, C. Bertsche44, D. Bertsche113, G.J. Besjes38, O. Bessidskaia Bylund146a,146b, M. Bessner44, N. Besson136, C. Betancourt50, A. Bethani57, S. Bethke101, A.J. Bevan77, R.M. Bianchi125, L. Bianchini25, M. Bianco32, O. Biebel100, D. Biedermann17,
R. Bielski85, N.V. Biesuz124a,124b, M. Biglietti134a, J. Bilbao De Mendizabal51, T.R.V. Billoud95,
H. Bilokon49, M. Bindi56, S. Binet117, A. Bingul20b, C. Bini132a,132b, S. Biondi22a,22b, D.M. Bjergaard47, C.W. Black150, J.E. Black143, K.M. Black24, D. Blackburn138, R.E. Blair6, J.-B. Blanchard136,
V.S. Bobrovnikov109,c, S.S. Bocchetta82, A. Bocci47, C. Bock100, M. Boehler50, D. Boerner174, J.A. Bogaerts32, D. Bogavac14, A.G. Bogdanchikov109, C. Bohm146a, V. Boisvert78, P. Bokan14, T. Bold40a, A.S. Boldyrev163a,163c, M. Bomben81, M. Bona77, M. Boonekamp136, A. Borisov130, G. Borissov73, J. Bortfeldt32, D. Bortoletto120, V. Bortolotto61a,61b,61c, K. Bos107, D. Boscherini22a, M. Bosman13, J.D. Bossio Sola29, J. Boudreau125, J. Bouffard2, E.V. Bouhova-Thacker73,
D. Boumediene36, C. Bourdarios117, S.K. Boutle55, A. Boveia32, J. Boyd32, I.R. Boyko66, J. Bracinik19, A. Brandt8, G. Brandt56, O. Brandt59a, U. Bratzler156, B. Brau87, J.E. Brau116, H.M. Braun174,∗,
W.D. Breaden Madden55, K. Brendlinger122, A.J. Brennan89, L. Brenner107, R. Brenner164, S. Bressler171, T.M. Bristow48, D. Britton55, D. Britzger44, F.M. Brochu30, I. Brock23, R. Brock91, G. Brooijmans37, T. Brooks78, W.K. Brooks34b, J. Brosamer16, E. Brost108, J.H Broughton19,
P.A. Bruckman de Renstrom41, D. Bruncko144b, R. Bruneliere50, A. Bruni22a, G. Bruni22a, L.S. Bruni107, BH Brunt30, M. Bruschi22a, N. Bruscino23, P. Bryant33, L. Bryngemark82, T. Buanes15, Q. Buat142, P. Buchholz141, A.G. Buckley55, I.A. Budagov66, F. Buehrer50, M.K. Bugge119, O. Bulekov98,
D. Bullock8, H. Burckhart32, S. Burdin75, C.D. Burgard50, B. Burghgrave108, K. Burka41, S. Burke131, I. Burmeister45, J.T.P. Burr120, E. Busato36, D. Büscher50, V. Büscher84, P. Bussey55, J.M. Butler24, C.M. Buttar55, J.M. Butterworth79, P. Butti107, W. Buttinger27, A. Buzatu55, A.R. Buzykaev109,c, S. Cabrera Urbán166, D. Caforio128, V.M. Cairo39a,39b, O. Cakir4a, N. Calace51, P. Calafiura16, A. Calandri86, G. Calderini81, P. Calfayan100, G. Callea39a,39b, L.P. Caloba26a, S. Calvente Lopez83, D. Calvet36, S. Calvet36, T.P. Calvet86, R. Camacho Toro33, S. Camarda32, P. Camarri133a,133b, D. Cameron119, R. Caminal Armadans165, C. Camincher57, S. Campana32, M. Campanelli79, A. Camplani92a,92b, A. Campoverde141, V. Canale104a,104b, A. Canepa159a, M. Cano Bret35e, J. Cantero114, R. Cantrill126a, T. Cao42, M.D.M. Capeans Garrido32, I. Caprini28b, M. Caprini28b, M. Capua39a,39b, R. Caputo84, R.M. Carbone37, R. Cardarelli133a, F. Cardillo50, I. Carli129, T. Carli32, G. Carlino104a, L. Carminati92a,92b, S. Caron106, E. Carquin34b, G.D. Carrillo-Montoya32, J.R. Carter30, J. Carvalho126a,126c, D. Casadei19, M.P. Casado13,h, M. Casolino13, D.W. Casper162,
E. Castaneda-Miranda145a, R. Castelijn107, A. Castelli107, V. Castillo Gimenez166, N.F. Castro126a,i, A. Catinaccio32, J.R. Catmore119, A. Cattai32, J. Caudron23, V. Cavaliere165, E. Cavallaro13, D. Cavalli92a, M. Cavalli-Sforza13, V. Cavasinni124a,124b, F. Ceradini134a,134b, L. Cerda Alberich166, B.C. Cerio47, A.S. Cerqueira26b, A. Cerri149, L. Cerrito133a,133b, F. Cerutti16, M. Cerv32, A. Cervelli18, S.A. Cetin20d, A. Chafaq135a, D. Chakraborty108, S.K. Chan58, Y.L. Chan61a, P. Chang165,
J.D. Chapman30, D.G. Charlton19, A. Chatterjee51, C.C. Chau158, C.A. Chavez Barajas149, S. Che111, S. Cheatham73, A. Chegwidden91, S. Chekanov6, S.V. Chekulaev159a, G.A. Chelkov66, j,
M.A. Chelstowska90, C. Chen65, H. Chen27, K. Chen148, S. Chen35c, S. Chen155, X. Chen35f, Y. Chen68, H.C. Cheng90, H.J Cheng35a, Y. Cheng33, A. Cheplakov66, E. Cheremushkina130,
R. Cherkaoui El Moursli135e, V. Chernyatin27,∗, E. Cheu7, L. Chevalier136, V. Chiarella49, G. Chiarelli124a,124b, G. Chiodini74a, A.S. Chisholm19, A. Chitan28b, M.V. Chizhov66, K. Choi62, A.R. Chomont36, S. Chouridou9, B.K.B. Chow100, V. Christodoulou79, D. Chromek-Burckhart32, J. Chudoba127, A.J. Chuinard88, J.J. Chwastowski41, L. Chytka115, G. Ciapetti132a,132b, A.K. Ciftci4a, D. Cinca45, V. Cindro76, I.A. Cioara23, C. Ciocca22a,22b, A. Ciocio16, F. Cirotto104a,104b, Z.H. Citron171, M. Citterio92a, M. Ciubancan28b, A. Clark51, B.L. Clark58, M.R. Clark37, P.J. Clark48, R.N. Clarke16, C. Clement146a,146b, Y. Coadou86, M. Cobal163a,163c, A. Coccaro51, J. Cochran65, L. Colasurdo106, B. Cole37, A.P. Colijn107, J. Collot57, T. Colombo32, G. Compostella101, P. Conde Muiño126a,126b, E. Coniavitis50, S.H. Connell145b, I.A. Connelly78, V. Consorti50, S. Constantinescu28b, G. Conti32, F. Conventi104a,k, M. Cooke16, B.D. Cooper79, A.M. Cooper-Sarkar120, K.J.R. Cormier158,
T. Cornelissen174, M. Corradi132a,132b, F. Corriveau88,l, A. Corso-Radu162, A. Cortes-Gonzalez32, G. Cortiana101, G. Costa92a, M.J. Costa166, D. Costanzo139, G. Cottin30, G. Cowan78, B.E. Cox85, K. Cranmer110, S.J. Crawley55, G. Cree31, S. Crépé-Renaudin57, F. Crescioli81, W.A. Cribbs146a,146b,
M. Crispin Ortuzar120, M. Cristinziani23, V. Croft106, G. Crosetti39a,39b, A. Cueto83,
T. Cuhadar Donszelmann139, J. Cummings175, M. Curatolo49, J. Cúth84, H. Czirr141, P. Czodrowski3, G. D’amen22a,22b, S. D’Auria55, M. D’Onofrio75, M.J. Da Cunha Sargedas De Sousa126a,126b,
C. Da Via85, W. Dabrowski40a, T. Dado144a, T. Dai90, O. Dale15, F. Dallaire95, C. Dallapiccola87, M. Dam38, J.R. Dandoy33, N.P. Dang50, A.C. Daniells19, N.S. Dann85, M. Danninger167,
M. Dano Hoffmann136, V. Dao50, G. Darbo52a, S. Darmora8, J. Dassoulas3, A. Dattagupta62, W. Davey23, C. David168, T. Davidek129, M. Davies153, P. Davison79, E. Dawe89, I. Dawson139, R.K. Daya-Ishmukhametova87, K. De8, R. de Asmundis104a, A. De Benedetti113, S. De Castro22a,22b, S. De Cecco81, N. De Groot106, P. de Jong107, H. De la Torre83, F. De Lorenzi65, A. De Maria56, D. De Pedis132a, A. De Salvo132a, U. De Sanctis149, A. De Santo149, J.B. De Vivie De Regie117, W.J. Dearnaley73, R. Debbe27, C. Debenedetti137, D.V. Dedovich66, N. Dehghanian3, I. Deigaard107, M. Del Gaudio39a,39b, J. Del Peso83, T. Del Prete124a,124b, D. Delgove117, F. Deliot136, C.M. Delitzsch51, M. Deliyergiyev76, A. Dell’Acqua32, L. Dell’Asta24, M. Dell’Orso124a,124b, M. Della Pietra104a,k, D. della Volpe51, M. Delmastro5, P.A. Delsart57, D.A. DeMarco158, S. Demers175, M. Demichev66, A. Demilly81, S.P. Denisov130, D. Denysiuk136, D. Derendarz41, J.E. Derkaoui135d, F. Derue81, P. Dervan75, K. Desch23, C. Deterre44, K. Dette45, P.O. Deviveiros32, A. Dewhurst131, S. Dhaliwal25, A. Di Ciaccio133a,133b, L. Di Ciaccio5, W.K. Di Clemente122, C. Di Donato132a,132b, A. Di Girolamo32, B. Di Girolamo32, B. Di Micco134a,134b, R. Di Nardo32, A. Di Simone50, R. Di Sipio158,
D. Di Valentino31, C. Diaconu86, M. Diamond158, F.A. Dias48, M.A. Diaz34a, E.B. Diehl90, J. Dietrich17, S. Diglio86, A. Dimitrievska14, J. Dingfelder23, P. Dita28b, S. Dita28b, F. Dittus32, F. Djama86,
T. Djobava53b, J.I. Djuvsland59a, M.A.B. do Vale26c, D. Dobos32, M. Dobre28b, C. Doglioni82, J. Dolejsi129, Z. Dolezal129, M. Donadelli26d, S. Donati124a,124b, P. Dondero121a,121b, J. Donini36, J. Dopke131, A. Doria104a, M.T. Dova72, A.T. Doyle55, E. Drechsler56, M. Dris10, Y. Du35d,
J. Duarte-Campderros153, E. Duchovni171, G. Duckeck100, O.A. Ducu95,m, D. Duda107, A. Dudarev32, A.Chr. Dudder84, E.M. Duffield16, L. Duflot117, M. Dührssen32, M. Dumancic171, M. Dunford59a, H. Duran Yildiz4a, M. Düren54, A. Durglishvili53b, D. Duschinger46, B. Dutta44, M. Dyndal44, C. Eckardt44, K.M. Ecker101, R.C. Edgar90, N.C. Edwards48, T. Eifert32, G. Eigen15, K. Einsweiler16, T. Ekelof164, M. El Kacimi135c, V. Ellajosyula86, M. Ellert164, S. Elles5, F. Ellinghaus174, A.A. Elliot168, N. Ellis32, J. Elmsheuser27, M. Elsing32, D. Emeliyanov131, Y. Enari155, O.C. Endner84, J.S. Ennis169, J. Erdmann45, A. Ereditato18, G. Ernis174, J. Ernst2, M. Ernst27, S. Errede165, E. Ertel84, M. Escalier117, H. Esch45, C. Escobar125, B. Esposito49, A.I. Etienvre136, E. Etzion153, H. Evans62, A. Ezhilov123, F. Fabbri22a,22b, L. Fabbri22a,22b, G. Facini33, R.M. Fakhrutdinov130, S. Falciano132a, R.J. Falla79, J. Faltova129, Y. Fang35a, M. Fanti92a,92b, A. Farbin8, A. Farilla134a, C. Farina125, E.M. Farina121a,121b, T. Farooque13, S. Farrell16, S.M. Farrington169, P. Farthouat32, F. Fassi135e, P. Fassnacht32,
D. Fassouliotis9, M. Faucci Giannelli78, A. Favareto52a,52b, W.J. Fawcett120, L. Fayard117, O.L. Fedin123,n, W. Fedorko167, S. Feigl119, L. Feligioni86, C. Feng35d, E.J. Feng32, H. Feng90, A.B. Fenyuk130, L. Feremenga8, P. Fernandez Martinez166, S. Fernandez Perez13, J. Ferrando55, A. Ferrari164, P. Ferrari107, R. Ferrari121a, D.E. Ferreira de Lima59b, A. Ferrer166, D. Ferrere51, C. Ferretti90, A. Ferretto Parodi52a,52b, F. Fiedler84, A. Filipˇciˇc76, M. Filipuzzi44, F. Filthaut106, M. Fincke-Keeler168, K.D. Finelli150, M.C.N. Fiolhais126a,126c, L. Fiorini166, A. Firan42, A. Fischer2, C. Fischer13, J. Fischer174, W.C. Fisher91, N. Flaschel44, I. Fleck141, P. Fleischmann90, G.T. Fletcher139, R.R.M. Fletcher122, T. Flick174, A. Floderus82, L.R. Flores Castillo61a, M.J. Flowerdew101,
G.T. Forcolin85, A. Formica136, A. Forti85, A.G. Foster19, D. Fournier117, H. Fox73, S. Fracchia13, P. Francavilla81, M. Franchini22a,22b, D. Francis32, L. Franconi119, M. Franklin58, M. Frate162, M. Fraternali121a,121b, D. Freeborn79, S.M. Fressard-Batraneanu32, F. Friedrich46, D. Froidevaux32, J.A. Frost120, C. Fukunaga156, E. Fullana Torregrosa84, T. Fusayasu102, J. Fuster166, C. Gabaldon57, O. Gabizon174, A. Gabrielli22a,22b, A. Gabrielli16, G.P. Gach40a, S. Gadatsch32, S. Gadomski51,