HAL Id: hal-01279427
https://hal.archives-ouvertes.fr/hal-01279427
Submitted on 21 Oct 2016
HAL is a multi-disciplinary open access
archive for the deposit and dissemination of
sci-entific research documents, whether they are
pub-lished or not. The documents may come from
teaching and research institutions in France or
abroad, or from public or private research centers.
L’archive ouverte pluridisciplinaire HAL, est
destinée au dépôt et à la diffusion de documents
scientifiques de niveau recherche, publiés ou non,
émanant des établissements d’enseignement et de
recherche français ou étrangers, des laboratoires
publics ou privés.
Graphical models for social behavior modeling in face-to
face interaction
Alaeddine Mihoub, Gérard Bailly, Christian Wolf, Frédéric Elisei
To cite this version:
Alaeddine Mihoub, Gérard Bailly, Christian Wolf, Frédéric Elisei. Graphical models for social
behav-ior modeling in face-to face interaction. Pattern Recognition Letters, Elsevier, 2016, 74, pp.82-89.
�10.1016/j.patrec.2016.02.005�. �hal-01279427�
Pattern Recognition Letters
journal homepage: www.elsevier.com
Graphical models for social behavior modeling in face-to face interaction
Alaeddine Mihoub
a,b,c,, Gérard Bailly
a, Christian Wolf
b,cand Frédéric Elisei
aa GIPSA-Lab, Université de Grenoble-Alpes/CNRS, Speech & Cognition department, France bUniversité de Lyon/CNRS, France
cINSA-Lyon, LIRIS, UMR5205, F-69621, France
ABSTRACT
The goal of this paper is to model the coverbal behavior of a subject involved in face-to-face social interactions. For this end, we present a multimodal behavioral model based on a Dynamic Bayesian Network (DBN). The model was inferred from multimodal data of interacting dyads in a specific scenario designed to foster mutual attention and multimodal deixis of objects and places in a collaborative task. The challenge for this behavioral model is to generate coverbal actions (gaze, hand gestures) for the subject given his verbal productions, the current phase of the interaction and the perceived actions of the partner. In our work, the structure of the DBN was learned from data, which revealed an interesting causality graph describing precisely how verbal and coverbal human behaviors are coordinated during the studied interactions. Using this structure, DBN exhibits better performances compared to classical baseline models such as Hidden Markov Models (HMMs) and Hidden Semi-Markov Models (HSMMs). We outperform the baseline in both measures of performance, i.e. interaction unit recognition and behavior generation. DBN also reproduces more faithfully the coordination patterns between modalities observed in ground truth compared to the baseline models.
Keywords
Face-to-face interaction, Behavioral model, DBN, Structure learning, Multimodal generation
1. Introduction
Face-to-face communication is considered as one of the most basic and classic forms of communication in our daily life (Otsuka, 2011). Its apparent simplicity and intuitive use conceals a complex and sophisticated bidirectional multimodal phenomenon in which partners continually convey, perceive, interpret and react to the other person’s verbal and co-verbal signals and displays (Scherer et al., 2012). Studies on human behavior have confirmed for instance that co-verbal cues – such as body posture, arm/hand gestures, head movement, facial expressions, and eye gaze – strongly participate in the encoding and decoding of linguistic, paralinguistic and non-linguistic information. Several researchers have notably claimed that these cues are largely involved in maintaining mutual attention and social glue (Lakin et al., 2003).
Human interactions are paced by multi-level perception-action loops (Bailly, 2009). Thus, a multimodal behavioral model should be able to orchestrate this complex closed-loop system. In particular, the model is facing the complex task of predicting multimodal behavior given a scene analysis while monitoring the intended goals of the conversation. Our challenge in this paper is to build statistical multimodal behavioral models that are trained by exemplars of successful human-human (H/H) interactions i.e. that map perception to action. The end goal of this research is to build user-aware social robots that are able to engage efficient and believable face-to-face conversations with human partners. In this work, this problem is solved in a data driven way through a Dynamic Bayesian Network (DBN) whose graphical structure and its parameters are learned from observed training data. We will show that automatically learning the model’s structure as well as parameters leads to faithful predictions of multimodal scores that reproduce how humans coordinate their own modalities (intra) and between each other (inter).
The paper is organized as follows: the next section briefly reviews the state-of-the art of multimodal behavior analysis and modeling. In section 3, we present our face-to-face interaction scenario, the experimental setting and the collected signals. In section 4, the DBN model is presented and the structure of intra-frame and inter-intra-frame dependencies is discussed. Two other models (HMMs/HSMMs) are used as baselines. In section 5, comparative performances of these models are given and discussed. We show that the DBN model outperforms the other statistical models both in terms of performance and reproduction of coordination patterns.
2. Related Work
This research is a part of the general field of Social Signal Processing (SSP) (Vinciarelli et al., 2012), a new emerging domain spanning research not only in signal and image processing but also in social and human science. In recent years, it is becoming an attractive research area and there is an increasing awareness about its technological and scientific challenges. SSP essentially deals with the analysis and synthesis of multimodal behavior in social interactions.
One of the goals of SSP is automatic conversation and scene analysis (Gatica-Perez, 2009). The challenge is here to retrieve high-level information such as cognitive activities (e.g. addressing, turn taking, backchannel), social emotions (e.g. happiness, anger, fear), social relations (e.g. roles) as well as social attitudes (e.g. degree of engagement or interest, dominance, personality) (Vinciarelli et al., 2012) from the exchanged signals. Several computational models have been proposed to cope with these problems. Pentland et al. (Pentland
et al., 2005) have characterized face-to-face conversations using wearable sensors. They have built a computational model based on Coupled Hidden Markov Models (CHMMs) to describe interactions between two people and characterize their dynamics in order to estimate the success of the intended goals. Otsuka et al. (Otsuka et al., 2007) proposed a Dynamic Bayesian Network (DBN) to estimate addressing and turn taking ("who responds to whom and when?"). The DBN framework is composed of three layers. The first one perceives speech and head gestures, the second layer estimates gaze patterns while the third one estimates conversation regimes. The objective of Otsuka and colleagues is to evaluate the interaction between regimes and behaviors during multi-party conversations. For social affect detection, Petridis and Pantic (Petridis and Pantic, 2008) presented an audiovisual approach to distinguish laughter from speech and showed that this approach outperforms the unimodal ones. The model uses a combination of AdaBoost and Neural Networks, where AdaBoost is used as a feature selector rather than a classifier. The model achieved a 86.9% recall rate with 76.7% precision. A Decision Tree is used in (Banerjee and Rudnicky, 2004) for automatic role detection in multiparty conversations. Based mostly on acoustic features, the classifier assigns roles to each participant including effective participator, presenter, current information provider, and information consumer. In (Jayagopi et al., 2009), Support Vectors Machines (SVM) have been used to rate each person’s dominance in multiparty interactions. The results showed that, while audio modality remains the most relevant, visual cues contribute in improving the discriminative power of the classifier. More complete reviews on models and issues related to nonverbal analysis of social interaction can be found in (Gatica-Perez, 2009) (Vinciarelli et al., 2012).
The second scope of SSP is the generation of relevant social behavior. The behavioral models should here predict the most appropriate sequence of multimodal signals for conveying given linguistic, paralinguistic or non-linguistic information. One possible application is to integrate these models into social agents (Kok and Heylen, 2012) to make them capable of displaying social actions, social emotions and social attitudes via an appropriate animation of their artificial bodies. Several models have proposed to model and synthesize human behavior. We here focus on data-driven approaches, which automatically infer the behavioral models from data using machine learning techniques. For instance, Morency et al. (Morency et al., 2010) showed how sequential probabilistic models, i.e. HMMs (Hidden Markov Models) and CRFs (Conditional Random Fields) can directly estimate listener backchannels from a dataset of human-to-human interactions using multimodal output features of the speaker, in particular spoken words, prosody and eye gaze. They notably addressed the problem of automatically selecting relevant features and their optimal representation for probabilistic models. Lee et al. (Lee and Marsella, 2012) also opted for a probabilistic approach to predict speaker head nods and eyebrow movements for a virtual agent application. The authors explored different feature sets (syntactic features, dialog acts, paralinguistic features, etc.) and different learning algorithms, namely HMM, CRF and Latent-Dynamic CRF (LDCRF). Quantitative evaluation showed that the LDCRF models achieved the best performance, underlying the importance of learning the dynamics between different gesture classes and the orchestration of the gestures. In our previous work (Mihoub et al., 2014), we proposed statistical models that, for a given interaction scenario (i.e. a sentence-repeating game), estimate the cognitive state of a subject – given his verbal activity and the multimodal behavior of his interlocutor – and then generate his gaze. We showed that sequential models (HMMs) are better than frame-based
classifiers (SVMs and decision trees) in both tasks. Moreover, Huang et al. (Huang and Mutlu, 2014) used Dynamic Bayesian Networks (DBNs) to model the coordination of speech, gaze, and gesture behaviors in narration. Given input speech features, the most probable coverbal behavior – gesture type and gaze target – were computed. The evaluation of their model shows that this learning-based approach achieves similar performance compared to conventional rule-based approaches while reducing the effort involved in identifying hidden behavioral patterns. More generally, these learning approaches frequently use probabilistic graphical models because of their capacity to capture subtle covariations between modalities and coordination between multimodal events that often escape to human expertise. Other interesting properties of statistical models include their ability in discovering and exploiting hidden states and latent variables that are not directly observed. That is why, in this work, the proposed behavioral models are data-driven and confronted to multimodal observation spaces.
In the next section we describe the scenario we designed to collect multimodal data of H/H face to-face social interactions. This data is then used to train and compare statistical models of joint behaviors.
3. Face-to-face interaction 3.1. Scenario
The objective of the proposed face-to-face interaction is to collect multimodal behaviors observed in a collaborative task called "put that there" (Bolt, 1980) involving an instructor and a manipulator. This task – simple as it can appear at first sight – is a very interesting benchmark for studying and learning human strategies used to maintain mutual attention and coordinate multimodal deixis towards objects and locations.
More concretely, the task consists in reproducing a particular arrangement of cubes. Each game involves an instructor and a manipulator, the latter following orders of the former. The objective of the statistical model is to learn and reproduce the instructor’s behaviors. The long-term goal is to transfer this model to a humanoid robot that will instruct a human manipulator. Credible scenarios where the HRI leads robots to instruct human partners are not so uncommon: robots may serve as coaches for physical or mental training (Fasola and Mataric, 2013; Görer et al., 2013) or rehabilitation, education (Brown and Howard, 2014; Fridin, 2014) as well as instructors for gaming or shopping recommendation (Shiomi et al., 2013).
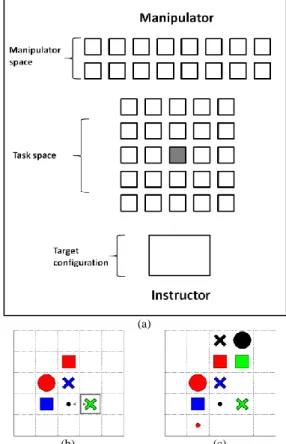
In our scenario, the instructor has to reproduce a target arrangement of cubes with the help of the manipulator who is the only agent allowed to touch and move the cubes. Conversely, the target arrangement is only known to the instructor. The instructor and the manipulator must therefore cooperate (i.e.; share knowledge and coordinate their sensory-motor capabilities) to perform this collaborative task. The game involves 16 cubes. Each cube is marked by a colored symbol drawn on its upper side, i.e. a unique combination of one symbol (square, cross, circle and dot) and one color (red, green, blue and black). The gaming table comprises three areas as shown in Fig. 1.a:
A manipulator space where the 16 cubes are initially randomly positioned. This space is close to the manipulator.
A task space in the form of a 5x5 checkerboard where the target arrangement of the cubes must be reproduced.
A graphics tablet displaying the current target configuration, i.e. which cube to move from the manipulator space and its destination area in the task space. These instructions are only visible by the instructor. They are incrementally made
available to the instructor each time he performs a hand gesture on the tablet’s touchscreen after the manipulator has effectively achieved the previous move. To ensure independence of the input data, the software randomly distributes source and target positions of the cubes.
At the start of each game, the task space is empty and a first target cube is designated to the instructor to be placed at the center of the chessboard. His goal is thus to identify it in the manipulator space and to ask the manipulator to grasp and place it in the right position of the task space. Although the game may be accomplished using verbal instructions only, the instructor is encouraged to intensively use co-verbal behaviors such as gaze, head movements and deictic gestures in order to lighten the cognitive load of the manipulator, avoid verbal repetitions and ease the identification of cubes and places (e.g. use rapid oscillations of index pointing to indicate absolute and relative positions). Subsequent positions are specified as relative positions with respect to a previously placed cube, i.e. "above", "below", "at the right" and "at the left" (see examples in Fig. 1.b & c).
(a)
(b) (c)
Fig. 1. (a) The gaming table. (b) Example of a game in progress, the indication displayed to the instructor should be transmitted to the manipulator in this way: "put the green cross at the right of the black dot". (c) The final target configuration.
3.2. Experimental setting
The aim of this experimentation is to train a model that predicts the coverbal behavior of the instructor using only egocentric observations, which can then be used by a robot for the generation of its coverbal behavior. For that reason, the manipulator is not equipped with any sensors and the scene analysis is performed from the instructor’s viewpoint. Conversely, motion of the instructor is captured by:
A Qualysis® Motion Capture system (MoCap). 5 Markers were placed on the helmet of the instructor to capture head movements and another 5 markers on his right hand and his
index to get his pointing gestures. The MoCap system uses 4 infrared cameras, all facing the instructor.
A monocular Pertech® eyetracker, consisting of a head-mounted eye camera and a scene camera. It delivers fixation data at 25Hz. The video of the scene camera (see Fig. 2) is also used for annotation and visual perception.
A head mounted microphone used to monitor the instructor’s speech signal.
For the purpose of annotation and data verification, we also equipped the environment with a camera mounted on the ceiling in order to have access to the complete scene. A chronometer is also placed in the visual field of the ceiling and scene cameras in order to accurately tag and synchronize the different videos streams. Claps are also performed before and after each interaction in order to precisely synchronize audio and video.
Fig. 2. Example of an interaction, filmed by the scene camera mounted on the instructor’s head.
3.3. Data and modeling
We recorded 30 games in which the instructor interacted with 3 different partners (10 games with each one). Each game consists in placing the first 10 cubes of one random arrangement. The mean duration of a single game is around 1 minute and 20 seconds (~2000 frames, 40ms per frame). To model our interaction, 5 discrete variables were annotated semi-automatically (see below):
IU: interaction units. These are joint sub-tasks describing the sequential organization of an elementary interaction. We distinguish (and annotated) 6 different IUs:
o Get: get the instruction from the tablet o Seek: seek the cube that must be moved o Point: point the cube in the manipulator space o Indicate: indicate the position in the task space o Verify: verify the manipulation
o Validate: validate and acknowledge the manipulation MP: manipulator gestures. We distinguish between 5 values
(rest / grasp / manipulate / end / none).
SP: instructor speech with 5 values (cube / preposition / reference cube / else / none).
GT: region of interest pointed by the instructor’s index finger with 5 values (rest / cube / target location / reference cube / none).
FX: gaze fixations of the instructor; we distinguish 8 regions of interest (manipulator’s face / manipulator space / task space / cube / target location / reference cube / tablet / else).
MP and FX have been annotated manually using Pertech scene video. SP is automatically transcribed by a speech recognition system. GT is annotated semi-automatically using the Qualysis signals and adjusted manually using Pertech scene video. Finally IU is manually annotated on the basis of gaze triggering events. The Elan software (Sloetjes and Wittenburg, 2010) is used to edit the multimodal scores. Note that these multimodal scores are time-series of our 5 discrete variables sampled at 25Hz.
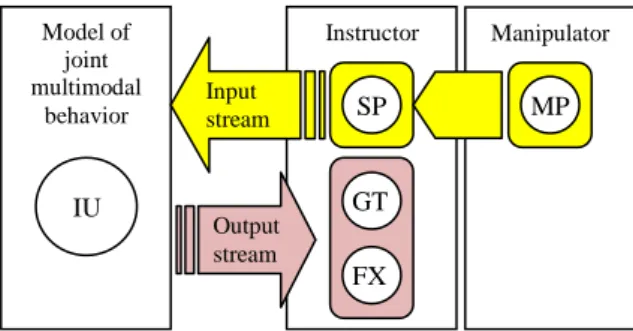
These joint multimodal scores are used to infer a coverbal behavioral model for the instructor. This model should first estimate the sequence of IUs given verbal and perceived cues and secondly to trigger the appropriate co-verbal behaviors: onsets of GT and FX are supposed to trigger gesture controllers that will effectively perform the pointing gestures, respectively by hand/finger and head/eye, while taking into account contingent parameters such as the referent target location and size. Our behavioral models compute what to perform and when to do it. The gesture controllers finally compute how to do it with the available effectors of the avatar.
Actually, the data is organized into three streams: The input stream consists in "SP" and "MP" The output stream consists in "GT" and "FX". The interaction unit stream contains "IU".
Let us repeat that notions like "input" and "output" are always to be considered from the point of view of the instructor. The behavioral model (see Fig. 3) will estimate the joint IUs from the input stream and generate the optimal output stream that is turned into coverbal actions. Note that we are interested in synthesizing co-verbal cues, not speech; for this reason, the speech activity of the instructor is considered as an input observation. In the next section, we will present our proposed behavioral models.
Fig. 3. The model of joint behavior captures the interleaving multimodal behaviors of both interlocutors structured by joint interaction units (IU). It is further used to predict an output stream (GT & FX) given partial observation of the joint activity (SP & MP).
4. Behavioral models
In this section, we present the statistical behavioral models, which will first be trained on the joint input, interaction and output streams. Machine learning and statistical modeling are used to intrinsically associate actions and percepts given synchronized sensory-motor streams and to organize sequences of percepts and actions into so-called joint sensory-motor behaviors. Our first model is based on a Dynamic Bayesian Network (Murphy, 2002).
4.1. DBN
A dynamic Bayesian network (DBN) is a probabilistic graphical model (PGM) that provides a compact representation of conditional independence relationships among stochastic processes (Koller and Friedman, 2009). DBNs generalize static Bayesian Nets (BNs) with a temporal extent by incorporating temporal dependencies among random variables. DBNs also generalize Hidden Markov Models (HMMs) and their variants, which can be seen as special cases. Because of their intuitive graphical presentation, the ability to deal with uncertainty and to model complex temporal relationships among variables, DBNs have been successfully applied to several domains. These characteristics make DBNs particularly attractive and useful in modeling the dynamics of multimodal behavior in face-to-face interactions (Huang and Mutlu, 2014). An extensive review of
Model of joint multimodal behavior Instructor Manipulator Input stream SP MP IU GT FX Output stream
PGMs and particularly DBNs (representation, learning, and inference) can be found in (Koller and Friedman, 2009) and (Murphy, 2002).
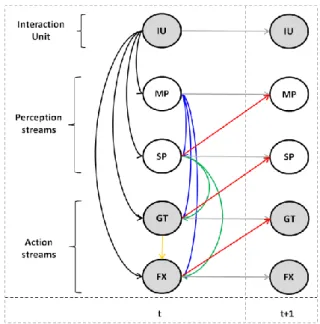
DBNs are directed acyclic graphs in which nodes represent random variables and edges represent conditional independencies. Semantically, an edge from a parent node X to a child node Y means that node X has influence over node Y. In some situations and depending on the application, this dependency structure may be given by an expert (Leray and François, 2004). If not, several methods have been introduced to learn the network’s structure automatically from data. In our application, our DBN structure (see Fig. 4) has been totally learned from the data described in the previous section.
Fig. 4. The learned structure of our DBN model (variables in gray circles are the variables to predict in the inference stage)
The intra-slice structure is learnt using the K2 algorithm (Cooper and Herskovits, 1992). The inter-slice structure is learned using the REVEAL algorithm (Liang et al., 1998). We employed the Bayes Net Toolbox (Murphy, 2001) for training and inference. The reveal algorithm assumes no intra-slice arcs, the optimal set of parents (slice t) for each child node (slice t+1) is then calculated separately. The idea is to infer the connections between nodes from measures of mutual information between children and parents. For the K2 algorithm, each node has no parents initially. Then, according to a given order of examination of nodes, the algorithm incrementally adds a parent (with a maximum of four parents per node) if it improves significantly the score of the resulting structure. The adopted order was IU, MP, SP, GT, FX i.e. interaction unit in the first level and sensori-motor data in a lower level. The IU is considered at the highest level since it reflects the cognitive states that guide the sensory-motor behaviors (Lee et al., 2007). The resulting causality network (see Fig. 4) presents very interesting proprieties: The interaction units influence both perception and action
streams (black arrows).
The instructor reacts to the manipulator actions (MP impacts SP, GT and FX) (blue arrows)
The speech activity (SP) of the instructor influences his co-verbal behavior (GT and FX) (green arrows). This is consistent with co-verbal contingency (McNeill, 1992).
Each random variable (slice t+1) is influenced by its history (slice t) (gray arrows)
Perception-Action loops can be easily identified by the following sequences of edges in the dependency graph:
o MP SP MP (2 slices: t and t+1) o MP GT SP MP (3 slices) o MP FX GT SP MP (4 slices)
There is a mutual influence between the modalities of instructor’s behavior:
o SP GT SP (green and red arrows) o SP FX GT SP (green and red arrows) o GT FX GT (yellow and red arrows)
4.2. HMM and HSMM
In order to compare the performance of the DBN model with a state-of-the-art baseline, we trained a second behavioral model based on HMMs. In this case, the conditional independence properties, i.e. the graphical structure of the model, are fixed and not learned. For each dyad, we model each interaction unit with a single Discrete Hidden Markov Model (DHMM) and the whole interaction with a global HMM, that chains all single models with a task-specific grammar. The hidden states of these HMMs model the perception-action loop by capturing joined behaviors. In fact, the observation vectors are composed of two parts: the first part contains the perceptual streams and the second part observes action streams. The “hidden” states are then intrinsically sensory-motor. At the training stage, all data are available while in testing only perceptual observations are available. For that reason, after training, two sub-models are extracted: a recognition model that will be responsible of estimating sensory-motor states from perceptual observations and a generation model that will generate actions from these estimated states. For more details, please refer to (Mihoub et al., 2013).
A third model based on Hidden Semi-Markov Model (HSMM) is also tested. In fact, a major inconvenient of conventional HMMs is state duration modeling. Durations of hidden states implicitly follow a geometric distribution, which may be often inappropriate to adequately constrain the state-specific residence time. As an extension of the HMM, the HSMM explicitly models state durations (Yu, 2010). The structure of the HSMM is similar to the HMM model. However, HSMM needs an additional parameter matrix corresponding to the duration probabilities of the different sensory-motor states. This matrix is learned from data. For more details, we refer to (Mihoub et al., 2015). In the next section we will show the DBN results and a comparison with HMMs/HSMMs is made.
5. Results & Discussion
The proposed models should be able to (1) estimate the interaction units from input observations (speech activity of the instructor / gestures of the manipulator); when the two partners cooperate, the sequential organization of the interaction units should ideally reflect the shared mental states of the conversation partners at that particular moment; (2) generate suitable actions (hand gestures and gaze fixations of the instructor) that reflect his current awareness of the evolution of the shared plan. The learned DBN model captures these relationships. In order to estimate an optimal output stream (in the DBN model sense) given an observed input stream, we used the junction tree algorithm (Cowell et al., 2003). Its role is to perform offline estimation by computing the MPE (most probable explanation) of IU, GT and FX given the whole sequence of MP and SP. The junction tree algorithm gives an exact solution to this combinatorial problem, similar to the Viterbi algorithm used for aligning HMMs states with observations.
For all models, 30-fold cross validation was applied. In this paper, we tackle the non-trivial problem of evaluating the similarity of two sequences. A direct frame-by-frame comparison
is of course always possible. However, a simple example can illustrate the problems of this approach: if two sequences A and B are given, where B is a shifted version of A by a single frame, the direct matching may result in a large dissimilarity measure, despite the fact that these sequences have identical structures. We address these shortcomings by first aligning the sequences before calculating classification measures.
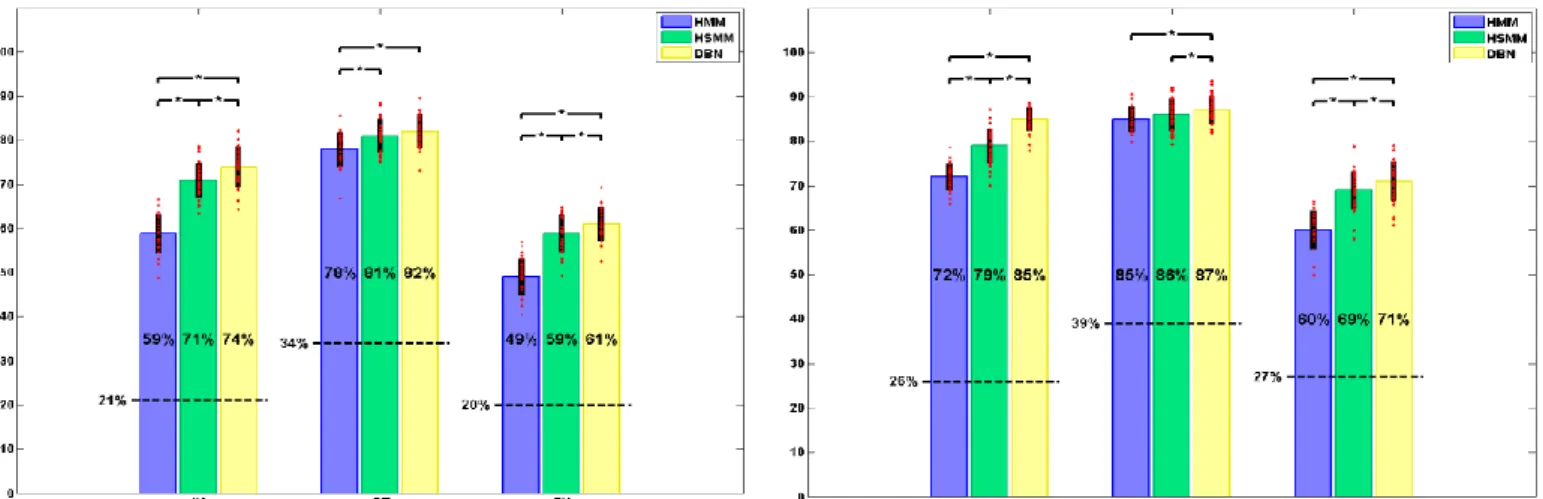
The Levenshtein distance (Levenshtein, 1966) is adopted for the evaluation because it computes a warped distance between predicted and original signals, which is tolerant to small miss-alignments. In fact, the Levenshtein distance is a metric for measuring the difference between two sequences; it computes the minimum number of elementary operations (insertions, deletions and substitutions) required to change one sequence into the other. From this optimal alignment, recall, precision and their harmonic mean (the F-measure) can be directly computed. Note that elements of the sequence are frames i.e. one instant t in a DBN, HMM or HSMM corresponds to one 40ms frame. In this paper exact estimation rates are presented (Fig. 5) but we mainly compare the F-measures of the Levenshtein evaluation (Fig. 6), all these rates are given at the level of frames.
5.1. Rates comparison
A direct comparison between all models is shown in Fig. 5 and Fig. 6. For both figures, the estimation rates of the three models are largely higher than random rates, computed from the empirical distribution of the data. Thanks to its capacity to explicitly model state durations, the HSMM leads to better Levenshtein rates (Fig. 6) in IU recognition (79% vs. 72%) and gaze generation (69% vs. 60%) compared to the basic HMM. The DBN model outperforms significantly both models (95% of confidence level): 85% for IU estimation, 87% for gesture generation and 71% for gaze generation. The same finding is observed for exact evaluation rates (Fig. 5). This performance gap may be explained by the fact that the DBN interestingly authorizes direct dependency relations between input and output observations. On the contrary, in the HMM paradigm, there is no direct relationships between the input and output variables of the observation vector (MP,SP,GT,FX) which presents a significant limitation compared to general Dynamic Bayesian Networks. Note however that (Bengio and Frasconi, 1996) have proposed so called Input/output HMMs that could partially solve the problem.
5.2. Coordination histograms
Beyond the comparison between prediction performances, we evaluated the capacity of each model to capture and reproduce the micro-coordination between multimodal streams (speech, deictic gesture and eye gaze). To this end, we here propose the concept of “coordination histograms”. These histograms give a global picture of the coordination patterns between different modalities. They can be computed both on data from ground truth and predicted output streams. They are thus quite suitable for characterizing similarity between generated interaction patterns and real interaction patterns. In the following, we compare the coordination histograms computed for original data, output streams predicted by DBN, HMM and HSMM.
Let us recall that each modality is segmented into a certain number of discrete events e.g. GT has 5 events (rest, cube, etc.). A coordination histogram for each stream is computed as follows: for each event onset, we look for the nearest event onset of the other modalities (i.e. SP and FX) and calculate the time delay between these two events. We then tabulate these delays for all events into a histogram, called coordination histogram for that particular stream. A coordination histogram captures the global structure of the micro-coordination between one modality
and the others given synchronous streams of discrete values. Let's consider the histogram in Fig. 7b, top row. The value of ~600 for the highest bin centered on value "0" indicates that, in the ground truth data, 600 events of type "GT" had the nearest neighboring “FX” or “SP” event in the range [-50ms,+50ms], which is the interval corresponding to the central histogram bin of 100ms. Similarly, we compute coordination histograms for SP and FX (see the first row of Fig. 7) for ground truth. Coordination histograms are also computed for streams generated by the statistical models: DBN (second row in Fig. 7), HMM (see third row of Fig. 7) and HSMM (last row of Fig. 7).
Kolmogorov-Sminov tests of normality (see Tab. 1) show that ground truth histograms are derived from a standard normal distribution (SP and FX). This finding illustrates that human behavior is paced by hidden patterns. For our models, only the FX coordination histogram of the DBN model verifies this property. When comparing histograms in Fig. 7, we can see that distributions of the DBN model are visually more similar to the ground truth distributions than the other models. In Tab. 2, we provide the chi-squared distances between the coordination histograms for data of ground truth and the three models. The smallest distances are those of the DBN model: besides having the best prediction rates, the DBN also model exhibits the most faithful behavior coordination among the proposed models.
6. Conclusions & Perspectives
In this paper, we introduce an original scenario for a face-to-face collaborative task. The multimodal data collected on dyads involved in this task were used to train joint behavioral models based essentially on HMMs, HSMMs and DBNs. These models are trained to predict the face-to-face interaction units and to generate coverbal behaviors of a given subject given his verbal behavior and the observed behavior of his partner. The conditional structure between variables discovered by the Dynamic Bayesian Network evidences and assesses the complex relationships between the different modalities of the human behavior. As a result, DBN leads to better performances in both IU recognition and behavior generation. We further introduced the concept of a coordination histogram, which is a new method to evaluate the capability of behavioral models to faithfully reproduce natural coordination among his and others’ modalities. The coordination histograms produced by DBN were the closest to ground truth histograms compared to HMM and HSMM.
The DBN has the best performance compared to HMM and HSMM, but there is still a gap to 100%. Part of this gap is certainly due to human variability – occurring even when subjects are performing such repetitive tasks – and the con-sistency of semi-automatic labeling of events by human labelers. We also think that the DBN could be improved by considering latent variables, their durations and additional modalities such as head or body motion. Other models should also be considered such as Long Short-Term Memory (LSTM) networks.
The quest for objective performance should be complemented with subjective assessment of the entire generation process, including both planning by the present proposal and gestural controllers that will effectively perform the movements. In our future work, we plan to implement these models on our iCub robot, put the robot into a real face to-face interaction and get a subjective evaluation of the relevance of our models.
Acknowledgments
This research is financed by the Rhône-Alpes ARC6 research council and the ANR-14-CE27-0014 SOMBRERO.
Fig. 5. Exact estimation rates for all models, the dashed line illustrates the random level.
Fig. 6. Levenshtein estimation rates for all models, the dashed line illustrates the random level.
Tab. 1. Normality tests (Kolmogorov-Smirnov tests at the 5% significance level): + means that the histogram distribution comes from a standard normal distribution, otherwise -. SP GT FX Real + - + DBN - - + HMM - - - HSMM - - -
Tab. 2. Chi squared distance between the histogram of the real interaction and the histograms of different models.
HMM HSMM DBN Real Speech coordination 397.17 137.67 79.38 Gesture coordination 402.68 172.37 142.94 Gaze coordination 630.53 250.97 141.85 (a) (b) (c)
Fig. 7. Coordination histograms computed with a 100ms bin. (a) speech coordination with gesture and gaze (b) gesture coordination with speech and gaze (c) gaze coordination with speech and gesture.
Appendix
Synchronized videos, speech data and annotations used in this experiment are freely available under the item “Put-that-there” at
http://www.gipsa-lab.fr/projet/SOMBRERO/data.html References
Bailly, G., 2009. Boucles de perception-action et interaction face-à-face. Rev. Fr. Linguist. Appliquée 13, 121–131. Banerjee, S., Rudnicky, A., 2004. Using Simple Speech–Based
Features to Detect the State of a Meeting and the Roles of the Meeting Participants. Proc. 8th Int. Conf. Spok. Lang. Process. Interspeech 2004 - ICSLP.
Bengio, Y., Frasconi, P., 1996. Input-output HMMs for sequence processing. IEEE Trans. Neural Netw. 7, 1231–1249. Bolt, R.A., 1980. “Put-That-There”: Voice and Gesture at the
Graphics Interface. In: Proceedings of the 7th Annual Conference on Computer Graphics and Interactive Techniques, SIGGRAPH ’80. ACM, New York, NY, USA, pp. 262–270.
Brown, L.N., Howard, A.M., 2014. The positive effects of verbal encouragement in mathematics education using a social robot. Presented at the 2014 IEEE Integrated STEM Education Conference (ISEC), pp. 1–5.
Cooper, G.F., Herskovits, E., 1992. A Bayesian method for the induction of probabilistic networks from data. Mach. Learn. 9, 309–347.
Cowell, R.G., Dawid, P., Lauritzen, S.L., Spiegelhalter, D.J., 2003. Probabilistic Networks and Expert Systems: Exact Computational Methods for Bayesian Networks. Springer New York.
Fasola, J., Mataric, M., 2013. A Socially Assistive Robot Exercise Coach for the Elderly. J. Hum.-Robot Interact. 2, 3–32. Fridin, M., 2014. Storytelling by a kindergarten social assistive
robot: A tool for constructive learning in preschool education. Comput. Educ. 70, 53–64.
Gatica-Perez, D., 2009. Automatic nonverbal analysis of social interaction in small groups: A review. Image Vis. Comput. 27, 1775–1787.
Görer, B., Salah, A.A., Akın, H.L., 2013. A Robotic Fitness Coach for the Elderly. In: Ambient Intelligence, Lecture Notes in Computer Science. pp. 124–139.
Huang, C.-M., Mutlu, B., 2014. Learning-based Modeling of Multimodal Behaviors for Humanlike Robots. In: Proceedings of the 2014 ACM/IEEE International Conference on Human-Robot Interaction, HRI ’14. ACM, New York, NY, USA, pp. 57–64.
Jayagopi, D.B., Hung, H., Yeo, C., Gatica-Perez, D., 2009. Modeling dominance in group conversations using nonverbal activity cues. Audio Speech Lang. Process. IEEE Trans. On 17, 501–513.
Kok, I. de, Heylen, D., 2012. Integrating Backchannel Prediction Models into Embodied Conversational Agents. In: Nakano, Y., Neff, M., Paiva, A., Walker, M. (Eds.), Intelligent Virtual Agents, Lecture Notes in Computer Science. pp. 268–274.
Koller, D., Friedman, N., 2009. Probabilistic Graphical Models: Principles and Techniques - Adaptive Computation and Machine Learning. The MIT Press.
Lakin, J.L., Jefferis, V.E., Cheng, C.M., Chartrand, T.L., 2003. The Chameleon Effect as Social Glue: Evidence for the Evolutionary Significance of Nonconscious Mimicry. J. Nonverbal Behav. 27, 145–162.
Lee, J., Marsella, S., 2012. Modeling Speaker Behavior: A
Comparison of Two Approaches. In: Nakano, Y., Neff, M., Paiva, A., Walker, M. (Eds.), Intelligent Virtual Agents, Lecture Notes in Computer Science. pp. 161–174. Lee, J., Marsella, S., Traum, D., Gratch, J., Lance, B., 2007. The
Rickel Gaze Model: A Window on the Mind of a Virtual Human. In: Proceedings of the 7th International
Conference on Intelligent Virtual Agents, IVA ’07. Berlin, Heidelberg, pp. 296–303.
Leray, P., François, O., 2004. BNT Structure Learning Package : Documentation and Experiments [WWW Document]. URL http://eprints.pascal-network.org/archive/00000343/ (accessed 12.8.14).
Levenshtein, V., 1966. Binary Codes Capable of Correcting Deletions, Insertions and Reversals. Sov. Phys. Dokl. 10, 707–710.
Liang, S., Fuhrman, S., Somogyi, R., others, 1998. Reveal, a general reverse engineering algorithm for inference of genetic network architectures. In: Pacific Symposium on Biocomputing. pp. 18–29.
McNeill, D., 1992. Hand and Mind: What Gestures Reveal about Thought. University of Chicago Press.
Mihoub, A., Bailly, G., Wolf, C., 2013. Social Behavior Modeling Based on Incremental Discrete Hidden Markov Models. In: Human Behavior Understanding, Lecture Notes in Computer Science. pp. 172–183.
Mihoub, A., Bailly, G., Wolf, C., 2014. Modeling Perception-action Loops: Comparing Sequential Models with Frame-based Classifiers. In: Proceedings of the Second International Conference on Human-Agent Interaction, HAI ’14. ACM, pp. 309–314.
Mihoub, A., Bailly, G., Wolf, C., Elisei, F., 2015. Learning multimodal behavioral models for face-to-face social interaction. J. Multimodal User Interfaces 1–16. Morency, L.-P., Kok, I. de, Gratch, J., 2010. A probabilistic
multimodal approach for predicting listener backchannels. Auton. Agents Multi-Agent Syst. 20, 70–84.
Murphy, K.P., 2001. The Bayes Net Toolbox for MATLAB. Comput. Sci. Stat. 33, 2001.
Murphy, K.P., 2002. Dynamic bayesian networks: representation, inference and learning. University of California, Berkeley. Otsuka, K., 2011. Conversation Scene Analysis [Social Sciences].
IEEE Signal Process. Mag. 28, 127–131.
Otsuka, K., Sawada, H., Yamato, J., 2007. Automatic inference of cross-modal nonverbal interactions in multiparty
conversations: “who responds to whom, when, and how?” from gaze, head gestures, and utterances. In: Proceedings of the 9th International Conference on Multimodal Interfaces, ICMI ’07. ACM, New York, NY, USA, pp. 255–262.
Pentland, A., Choudhury, T., Eagle, N., Singh, P., 2005. Human dynamics: computation for organizations. Pattern Recognit. Lett. 26, 503–511.
Petridis, S., Pantic, M., 2008. Audiovisual discrimination between laughter and speech. Presented at the IEEE International Conference on Acoustics, Speech and Signal Processing, 2008. ICASSP 2008, pp. 5117–5120.
Scherer, S., Marsella, S., Stratou, G., Xu, Y., Morbini, F., Egan, A., Morency, L.-P., 2012. Perception markup language: towards a standardized representation of perceived nonverbal behaviors. In: Intelligent Virtual Agents. pp. 455–463.
Shiomi, M., Shinozawa, K., Nakagawa, Y., Miyashita, T., Sakamoto, T., Terakubo, T., Ishiguro, H., Hagita, N., 2013.
Recommendation Effects of a Social Robot for Advertisement-Use Context in a Shopping Mall. Int. J. Soc. Robot. 5, 251–262.
Sloetjes, H., Wittenburg, P., 2010. Annotation by Category: ELAN and ISO DCR. In: LREC. European Language Resources Association.
Vinciarelli, A., Pantic, M., Heylen, D., Pelachaud, C., Poggi, I., D’Errico, F., Schroeder, M., 2012. Bridging the Gap between Social Animal and Unsocial Machine: A Survey of Social Signal Processing. IEEE Trans. Affect. Comput. 3, 69–87.
Yu, S.-Z., 2010. Hidden semi-Markov models. Artif. Intell. 174, 215–243.