FLIGHT
REPORT
TRANSPORTATION
R 88-2
LABORATORY
COMPARISON OF
OPTIMIZATION TECHNIQUES
ORIGIN-DESTINATION
SEAT
CONTROL
FOR
INVENTORY
ELIZABETH L. WILLIAMSON
MAY 1988
ABSTRACT
Airlines have recently realized the importance of an effective seat inventory con-trol system on revenues and profits. Yet, at the same time, there is a lack of practical optimization models for determining the number of seats to allocate to each origin-destination and fare class itinerary in an airline's network. In this thesis, several different mathematical models and optimization techniques for origin-destination seat inventory control are evaluated and compared.
Each technique is applied to a small network with assumed demand levels and fares for each O-D/fare class combination. The techniques are then compared with respect to the differences in seat allocations and booking limits, fare class nesting order and total potential system revenue. The "optimal" seat allocation solution is found by the probabilistic linear programming technique, but actual use of such a method is impractical due to the size of its formulation and its distinct inventory solution, which is not compatible with the nested reservations systems of most major airlines today. The technique that seems to have the most potential as an efficient origin-destination seat inventory control method is a network based deterministic linear programming technique, with seat allocations nested according to shadow prices.
Contents
1 Introduction
1.1 Motivation for Thesis . . . .
1.2 Objective of Thesis . . . .
1.3 Structure of Thesis . . . . 2 Seat Inventory Control
2.1 Definition of the Problem . . . . 2.2 Current Practices . . . .
3 Overview of Past Research
4 Techniques Evaluated For Seat Inventory Control
4.1 EM SR M odel . . . . 4.1.1 Probabilistic Demand and Expected Marginal Revenue . . . . 4.1.2 Leg Based EMSR.
4.2 4.3 4.4 4.5
4.1.3 Prorated EMSR . . . . Virtual Nesting EMSR . . . . Deterministic Linear Program . . . . Probabilistic Linear Program . . . . Deterministic LP Nested on Shadow Prices
5 Analysis and Comparisons
5.1 Network Model and Data . . . .
5.2 Applications and Results . . . . 5.2.1 Leg Based EMSR . . . ...
5.2.2 Prorated EMSR . . . .
5.2.3 Virtual Nesting EMSR . . . . 5.2.4 Deterministic Linear Program . . .
5.2.5 Probabilistic Linear Program
5.2.6 Deterministic LP Nested on Shadow Prices
5.3 Network Revenue Comparisons . . . . 6 Conclusion 6.1 Research Findings ... .. . . . ... .. 6.2 Further Work ... ... .. .. . ... 9 9 15 17 19 19 25 31 38 40 40 . . . . . . . . . . . . . . . . . . . 43 66 66 72 72 76 84 94 100 107 111 117 117 121 . . . . .
Bibliography
125
List of Figures
1.1 Point-to-Point versus Hub-and-Spoke . . . . 13
4.1 Normal Probability Density Function of Demand . . . . 41
4.2 Probability Distribution Function of Selling the Sth Seat . . . . 43
4.3 Expected Marginal Seat Revenue . . . . 44
4.4 EMSR Protection Level For Two Classes . . . . 46
4.5 EMSR Protection Levels and Booking Limits - Four Fare Classes . . 48
4.6 Virtual Inventory Assignments . . . . 54
4.7 Probabilistic LP Protection Levels for Two Inventories . . . . 62
List of Tables
4.1 Fare Ranges for the Virtual Inventory Classes . . . . 53
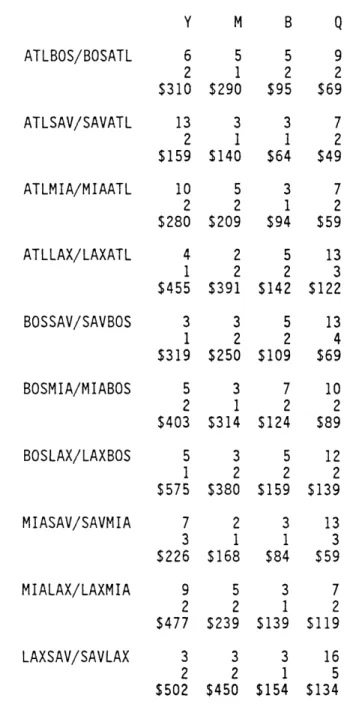
5.1 Fares, Means, and Standard Deviations for Low Demand Level . . . 69
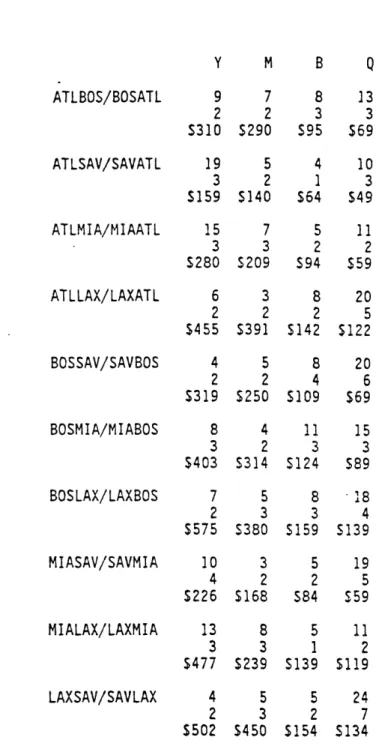
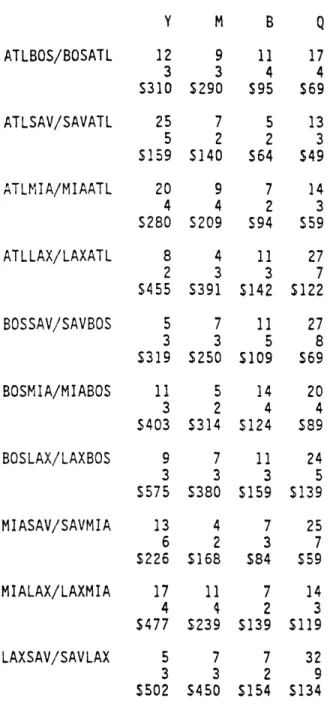
5.2 Fares, Means, and Standard Deviations for Medium Demand Level 70 5.3 Fares, Means, and Standard Deviations for High Demand Level . 71 5.4 Leg Based EMSR Inputs -Medium Demand Level . . . . 74
5.5 Leg Base EMSR Inputs - High Demand Level . . . . 75
5.6 Leg Based EMSR Booking Limits - Medium Demand Level . . . . . 77
5.7 Leg Based EMSR Booking Limits - Low Demand Level . . . . 78
5.8 Leg Based EMSR Booking Limits - High Demand Level . . . . 79
5.9 Prorated Fares . . . . 80
5.10 Prorated EMSR Inputs -Medium Demand Level . . . . 81
5.11 Prorated EMSR Booking Limits - Medium Demand Level . . . . 83
5.12 Prorated EMSR Booking Limits - High Demand Level . . . . 84
5.13 O-D/Fare Class Virtual Inventory Assignments . . . . 85
5.14 Virtual Nesting EMSR Inputs For ATL-BOS/BOS-ATL . . . . 87
5.15 Virtual Nesting EMSR Inputs For ATL-LAX/LAX-ATL . . . . 89
5.16 "Virtual Class" Booking Limits -Medium Demand Level . . . . 90
5.17 Virtual Nesting Booking Limits -Medium Demand Level . . . . 92
5.18 Virtual Nesting Booking Limits - High Demand Level . . . . 93
5.19 Deterministic LP Seat Allocations - Medium Demand Level . . . . . 97
5.20 Deterministic LP Seat Allocations - High Demand Level . . . . 98
5.21 P(S) and EMSR(S) For ATLBOS Y Class . . . 103
5.22 Probabilistic LP Seat Allocati->ns - Medium Demand Level . . . . . 106
5.23 Nested Deterministic LP Booking Limits - Medium Demand Level . 109 5.24 Nested Deterministic LP Booking Limits - High Demand Level . . . 111
Chapter 1
Introduction
1.1
Motivation for Thesis
In the airline industry today it is common practice for a carrier to offer a wide range of fares for any given seat in the same cabin. On a nonstop flight from Boston to Miami it is possible to find a passenger traveling on a round-trip discounted ticket for $228, and at the same time, a passenger sitting in the very next seat paying a full coach fare of $548, round trip. Occurrences such as this have become commonplace since deregulation of the U.S. airline industry.
Prior to deregulation, fares were set by the Civil Aeronautics Board (CAB) for the ii dustry as a whole. Fares were established according to in lustry average costs and based on a dollars per passenger mile structure. Carriers that operated at lower costs were not permitted to offer a lower fare which would be uneconomical to the rest of the industry. Besides determining the industry's prices, the CAB also governed each carrier's route structure, controlling which carriers could and could not serve a given market.
immensely. Carriers began offering seats that would otherwise be empty to low-fare passengers. Ticketing and travel restrictions were imposed on these low low-fares in order to limit diversion of those passengers willing to pay higher fares. These restrictions included such requirements as advance purchase, minimum stays, and round-trip travel. More recently, total and partial non-refundability restrictions have also been affixed to low-fare seats.
Through the practice of differential pricing, airlines have been able to increase total revenue. The marginal cost of carrying an additional passenger in an otherwise empty seat is very low. Therefore, seats can be offered at low fares in order to induce extra demand. As long as the lower fares are more than the marginal cost of carrying the extra passenger, these passengers will be contributing to the fixed costs of operating the flight and to profits. Not only do the airlines benefit, but high fare passengers may also benefit. With the extra revenue from the additional low fare passengers, airlines may actually be able to reduce the fares of the higher full fare
passengers who would be travelling regardless of the cost.
Restrictions on the purchase and use of the low fare tickets limited the diversion of high fare passengers, but airlines were soon faced with another problem. The seats sold to low fare passengers were not necessarily seats which would otherwise be empty. Besides the restrictions on the low fare tickets, capacity controls, or limits, on the number of available seats were needed. It was important to determine the number of seats which would be empty on a flight. These seats could then be made available for low-fare passengers while leaving an adequate number of seats for full-fare passengers so they would not be displaced.
Once restrictions and regulations on market entry were removed through dereg-ulation, regional carriers, formerly limited to certain routes by the CAB, expanded
into high density markets, offering lower fares on multi-stop and connecting flights. At the same time, many new airlines began operating across the country. These airlines were not tied to labor union agreements, meaning their labor costs, which make up as much as 35% of an airline's operating costs, were much lower. In turn, these new low-cost carriers could afford to provide service at much lower prices.
In order for the major airlines to compete with the lower fares offered by the regional and new carriers, they had to offer a limited number of seats at these low fares. By offering seats at low fares, major airlines were able to advertise low prices and compete with low fare carriers. At the same time, by limiting the number of low fare seats available, these higher cost airlines would still be able to cover direct operating costs on a flight. This made the capacity control problem much more complex. Rather than simply determining the number of seats that would otherwise remain empty, seats had to be provided for a range of different low-fare passengers, as well as higher-fare passengers. In order to control capacities effectively, demands for each fare class had to be forecasted and seats allocated to each depending on the overall contribution to total revenue and the chances that seats would ultimately go unsold.
This concept of capacity control is also known as seat inventory control. Seat inventory control is the process of balancing the number of seats sold at each fare level so as to maximize total system revenues. The problem has become more complicated for several reasons:
1. The number of different fares offered for any given origin-destination pair has
increased dramatically, creating a multitude of fare class/O-D combinations. For each combination, the expected demand level needs to be forecasted, the
~~1
~-number of seats made available to each O-D/fare class needs to be determined, and the respective booking limits need to be calculated.
2. The number of connecting flight segments operated by a single airline has in-creased. This makes it possible for passengers to get to their destination over a wide variety of routes and combinations of routes. Not only is a carrier's network itself bigger, but due to the number of interacting flights and connec-tion opconnec-tions which must be considered, the process of determining the number of seats to allocate to a particular fare class and O-D pair is very large and complicated.
3. The level of demand varies over time. Demand is a function of the season of
the year, the day of the week, the time of the day, the number of ultimate destinations which can be reached by a particular flight, whether the flight is non-stop or one-stop, and the alternative flights offered by the same carrier or competitive carriers. With the number of variables that can affect demand, it can be difficult to derive good forecasts of expected demand levels needed to determine booking limits.
Complexity has increased even more with the development of hub-and-spoke networks. A hub-and-spoke system is an efficient way to provide service to many different markets while minimizing the resources needed to do so. In such a network, an airline picks a centrally located city to serve as a connecting hub for its flights. Then, instead of flying an aircraft between each individual city pair the airline serves, aircraft from cities around the country converge into and out of the hub airport as seen in Figure 1.1, which illustrates the basic concept of a point-to-point network versus a hub-and-spoke network. A hub-and-spoke system reduces the number of
POINT TO POINT
HUB AND SPOKE
aircraft needed to provide service between a set of cities since any given flight in the network can be a part of many origin-destination itineraries. The demand for a flight is no longer simply the number of passengers traveling from city A to city Z, but includes passengers going from A to city V, to city W, and so on, as well as to such cities as B and C.
A seat inventory control system designed to maximize total revenues for the
airline thus involves more than simple decisions about which seats to sell to which fare classes. For a given flight into a hub, the number of alternatives for selling a specific seat is significantly greater that the comparatively small number of fare classes offered on the flight. Thus, in the process of allocating seats in a cabin, decisions as to which seats should be sold to which origin-destination pair as well as fare class can also be included. In order to make such decisions, total system revenue generated from selling a seat on a flight to a multi-leg passenger at a higher fare should be compared to the system revenue which could be generated by selling that same seat to a single-leg passenger, but at a lower fare. Selling the seat to the single-leg passenger may make it possible to sell the seat on the second leg of the multi-leg passenger's itinerary to another single-leg passenger. The combined revenue of the two single-leg, lower fare passengers may be greater than the revenue of the multi-leg passenger who is paying a higher fare than each of the single-leg passengers individually.
Most airline reservations systems currently maintain seat inventories and manage seat availability by fare class for each individual flight leg. If a seat is available in the low fare class, it can be reserved regardless of ultimate destination, overall itinerary and total revenue contribution. Because of the development of hub-and-spoke sys-tems with many different itineraries on any given flight, there is a great amount
-U..----of interest in the possibility -U..----of practicing inventory control in an origin-destination based environment. Methods are being explored to control seat inventories by pas-senger itinerary and/or origin-destination revenue. That is, on any given flight leg from some point P to some other point
Q,
it is possible to take passengers who are travelling to pointQ
or continuing on and connecting to a variety of other destina-tions, all with different revenue potential for the carrier. Airlines would like to be able to determine which of the many passenger itineraries should have seats allo-cated to them on the initial flight leg (P toQ)
in order to maximize system-wide revenues.1.2
Objective of Thesis
Airlines have recognized that there are advantages in using statistical tools and mathematical analysis in controlling seat inventories and, in turn, managing revenue. Most airlines have decision support tools which retrieve, summarize and analyze his-torical reservations and traffic data. The more advanced airlines in seat inventory control are in a transitional phase between a system dependent on human judge-ment and some form of automated booking limit system. Automated booking limit systems use historical reservations data and actual bookings to forecast demands. The demand estimates are then used as inputs, along with revenue information, in a seat allocation model, which determines optimal booking limits. The seat allocation model can include mathematical approaches and algorithms for setting and revising booking limits.
Most of the seat allocation models currently used by airlines are leg based ap-proaches directed at maximizing flight leg revenues. Some models try to account
for differences in passenger itinerary revenues by using "virtual" inventory classes, although the model itself is leg based. A virtual inventory class is a seat inventory allocation category which can be used to control the number of seats available for sale within a given fare range. Although the virtual inventories are based on total passenger itinerary ticket revenue, seat allocations for the virtual classes are deter-mined on the basis of maximizing revenues on individual flight legs. The interaction of different flight legs in a network system is not taken into account.
Maximizing flight leg revenues is not necessarily the same as maximizing total system revenues. An origin-destination optimization approach is needed to overcome such problems. True O-D approaches are network formulations which determine optimal seat allocations based on distinct fare class and itinerary combinations, yet such formulations can be quite complex. At the same time, a solution from such an
O-D model is not directly compatible with the nested leg-based structure of most
airline reservations systems today.
Critical questions for airlines considering the development of origin-destination seat inventory control systems are: How effective are different approaches to con-trolling seat inventories and maximizing revenues? Is the potential revenue of an origin-destination approach greater than that of leg-based approaches? If so, is the difference in potential revenue significant enough to offset the ease and simplicity of using a leg-based approach? How do the different methods currently being con-sidered for use vary? Is it possible to effectively use origin-destination methods and their solutions in existing airline reservations systems?
The objective of this thesis is to compare several different mathematical models and optimization techniques relevent to airline seat inventory control. The eval-uation is based on a small hub-based network of connecting flights. Six different
techniques, which include both leg based and origin-destination approaches, are applied to the network. O-D demand levels and fares for a four coach fare class structure are assumed and the alternatives are compared with respect to the differ-ences in seat allocations and booking limits, fare class nesting order and total system revenues. Through this comparison, the issues mentioned above are addressed and discussed.
The intent here is to present a comparison of inventory management systems. A number of factors such as overbooking, probabilities of passenger upgrade, diversion, and loss of denied requests are ignored. Such factors must be considered in a seat inventory management system, but by not including them in this analysis it will be possible to identify more clearly the differences between the methods themselves. Once a basic seat inventory control system is developed, these factors can be dealt with and incorporated into the system.
1.3
Structure of Thesis
The remainder of this thesis is divided into five chapters. Chapter Two serves as a formal introduction to the seat inventory control problem. The character-istics of airline operations and reservations systems which contribute to the size, complexity, and definition of the problem are discussed. The second section of the chapter summarizes current methods and practices used by major domestic airlines for controlling seat inventories.
Chapter Three is a brief overview of past research. Mathematical approaches that have been considered for use on the seat inventory control problem are pre-sented. Methods for solving simple representations of the problem, as well as
oper-ations research models which determine "optimal" seat allocoper-ations are introduced and reviewed.
The techniques being evaluated as origin-destination seat inventory control al-ternatives are decribed in Chapter Four. Six techniques are presented, including leg-based and origin-destination network formulations, as well as deterministic and probabilistic optimization algorithms. The concepts behind each technique are de-scribed in detail.
Chapter Five presents the analysis of the six alternatives. Each alternative is applied to a small network model. The actual steps involved in the application of each technique are explained and the results from these applications are provided. Comparisons of the different alternatives, in terms of seat allocations, nesting order and total system revenues, are discussed.
Chapter Six concludes this thesis by presenting an overview of findings and con-tributions from this research analysis. Finally, further research and work stemming from the results of this thesis are outlined. In particular, direction for additional analysis with respect to a nested network seat inventory control system, which is presented in this thesis, is outlined.
Chapter 2
Seat Inventory Control
2.1
Definition of the Problem
Airline seat inventory control is the practice of limiting the number of seats made available to different fare classes that share a common cabin on an aircraft. The objective of seat inventory control is to balance the number of passengers in each fare class in order to maximize total flight revenues. By offering more seats at discounted fares, an airline can capture extra passengers who otherwise would not travel, in turn providing additional revenue. Too many seats offered at lower fares will cause a diversion of high-fare passengers to the available low fares and may also displace some high-fare passengers altogether, therefore lowering total revenues.
Airlines use differential pricing to increase total revenues, as well as to be com-petitive. By offering a limited number of low-fare tickets, an airline can appear to be competitive with other carriers that offer deeply discounted fares. At the same time, it may also be able to fill otherwise empty seats by stimulating demand. Given the differential pricing strategy used by most airlines, the seat inventory problem is to determine the optimal booking limits, the maximum number of reservations that
should be accepted, for each fare class for a future scheduled flight departure that will maximize the airline's total revenue.
The need for seat inventory control stems from a basic economic problem: supply does not equal demand. In air transportation, supply and demand seldom match exactly. In the first place, demand for future flights is probabilistic and cannot be forecasted precisely. But the problem is due, to a greater extent, to the actual scheduling of the aircraft. Because of route structure constraints, constraints on the number and size of aircraft, scheduling constraints and the lack of balance in passenger demands over a network, it is not always possible to have the aircraft size equal demand. Therefore, when there are either more seats on an aircraft than demand or more demand than the given number of seats, it is the control over the number of discounted seats made available which can allow the airline to achieve a closer match between supply and demand.
The seat inventory control problem is not simply one of allocating seats to four, five, six, seven or even ten fare classes on a single flight leg. Today, more often than not, a single flight involves passengers with many different origin-destination itineraries, each of which have different revenue contributions. Therefore, seat in-ventory control decisions are not just the number of seats to allocate to each fare class, but decisions may need to be made as to whether a seat should be sold to a higher-yield fare class on a single leg itiernary, or to a lower-yield fare class, but at a higher total revenue, on a multi-leg or connecting itinerary.
The complexity of the problem has grown tremendously with the development of large hub-and-spoke operations. On a given flight departure into a major hub, there can be passengers heading towards as many as 40 possible destinations. With
major U.S. airlines currently offering seven coach cabin fare classes, that makes over
280 possible fare class/destination combinations on a single flight leg, each having
a different level of attractiveness, in terms of revenue, for the airline. As carriers continue to expand the number of fare classes offered on a flight and hub operations continue to grow, offering increasing numbers of connecting possibilities, they can benefit more and more from an effective seat inventory control system.
The seat inventory problem can be approached from a variety of perspectives. Seat inventories can be controlled over individual flight legs, over the entire network or over separate sub-sets of the network. Most airlines currently manage seat inven-tories by flight leg. It is by far the simplest method to use and can be implemented into the airline reservations system without major revisions to current practices.
Using a leg-based seat inventory control method, efforts are made to maximize revenue on each flight leg. This does not necessarily mean total system revenues are maximized. For example, consider a simple linear two flight leg network from Boston to Atlanta and from Atlanta to Miami with low priced Q-class fares of $69,
$89, and $59 for BOSATL, BOSMIA, and ATLMIA, respectively. With a leg-based
inventory system, passengers on either a BOSATL or BOSMIA itinerary can reserve a
Q
seat on the BOS-ATL flight leg if one is available. This makes it possible to book allQ
seats to the BOSATL passengers while denying higher revenue BOSMIA passengers. If demand for local travel from Atlanta to Miami is low, seats could go unsold on the ATL-MIA flight leg, and a reduced total revenue for the two flight legs combined could be obtained.In the above example the exact opposite can also happen. The
Q
seats on the BOS-ATL flight leg can all be booked to the higher itinerary revenue passengersgoing from Boston to Miami. If short-haul demand is high for both the BOS-ATL flight and the ATL-MIA flight, total revenues can be increased by selling the
Q
seats on the BOS-ATL flight leg to BOSATL local passengers. With high demand on the ATL-MIA flight for local travel, the total revenue for aQ
seat will be the sum of$69 and $59, or $128, from Boston to Atlanta and Atlanta to Miami, versus $89
which would be received from a BOSMIA through passenger.
In the first example, by protecting some Q-class seats on the first flight leg, BOS-ATL, for the longer haul Miami passengers, total revenues could have been increased. But when short-haul demands are high, by limiting seats to multi-leg passengers, higher revenues can be obtained. In order to maximize revenue over an entire route network, a seat inventory control system must be based on origin-destination
(O-D)
itineraries rather than flight leg. In an O-D method, seats are allocated to the fare class/passenger itinerary combinations which generate the greatest revenue and maximize total system revenues. Solutions from such an approach involve making decisions about which fare class/O-D combinations are the most desirable. For a network in which there are a large number of connections and flights with a multitude of passenger options, an O-D method can become very complex.Mathematical algorithms for O-D seat inventory control are usually based on network formulations. For each O-D/fare class combination, the expected revenue of each additional seat sold must be determined. Seats are then allocated according the expected revenue of a single O-D/fare class or combination of O-D/fare classes. The solution from such network formulations is based on distinct, separate inventories. Once the number of seats which should be allocated to each fare class/passenger itinerary is determined, an important question is how to use these results in the leg-based, nested fare class structures of current airline reservations systems without totally reconfiguring them.
An additional problem in seat inventory control is that air transportation de-mand is probabilistic. Dede-mand for a future flight has both cyclical and stochastic variations. Both may be forecasted, but stochastic variations are less predictable. There will always be some uncertainty as to the number of requests for a future flight- and fare class. An optimal seat inventory control model needs to take into account the uncertainty associated with stochastic variations by incorporating the variances of estimated demand, along with the revenue values and expected levels of demand for each fare class. A decision model that fails to consider the probabilistic nature of demand will overestimate expected revenues and may not allocate seats optimally. As the actual variations in demand increase, the greater the differences will be between the expected revenues and recommended seat allocation levels of a deterministic decision model and those of the optimal solution.
Demand for a future flight is also dynamic. From one day to the next the total number of requests changes continuously due to new demand as well as cancella-tions. As time passes and the departure day of the flight approaches, the number of bookings changes and the estimates of demand for each fare class and passenger itinerary also change. These changes can affect the optimal allocation of remaining seats for the flight. Therefore, it is important to be able to monitor the flight and make acjustments in seat allocations and booking limits when needed. In order to do this, the mathematical algorithms used in a seat inventory control system should not be overly- complicated and take too much time in running in order to make frequent revisions possible.
Another complication involved in optimally solving the seat inventory control problem is the nested fare class reservations systems which many airlines use. Nested fare class inventories are structured so that as long as there is a seat available on the
plane, a high-fare class request will not be denied. Each discounted, low-fare class inventory is nested within the next higher fare class. For example, take a four fare class structure-Y, M, B and Q-with Y being the highest fare class and
Q
being the lowest. The Q-class seat inventory is nested within B-class, and in turn B-class is nested within M, and M within Y. If there were 25 seats allocated to Y-class, 30 to M, 25 to B and 20 to Q-class, there would actually be a maximum of 100 seats available for Y-class requests, while a maximum of 75 seats and 45 seats would be available to M and B classes, respectively. Q-class availability will remain at 20 seats.In a nested system such as this, if there is a demand for 50 seats in the highest fare class, Y-class, the passengers would be allowed to book on the particular flight as long as there were 50 seats still available. The passengers would not be turned away because only 25 seats were actually allocated to Y-class. On the other hand, in a distinct fare class system, only 25 seats could be sold in Y-class regardless of the extra demand at the high-fare level. Once a seat has been allocated to a distinct fare class inventory, it can be booked only in that fare class or remain unsold. That is why airlines prefer a nested system. If there are requests for the highest fare, and seats are available, these requests will be accepted and not turned down becaues of expected lower-fare demand. The problem with a nested system is that most traditional mathematical optimization techniques determine solutions for distinct classes. Such distinct inventory class solutions may not be the optimal seat allocations for a nested system.
Besides the problem with a nested system, the size and complexity of a method which finds an "optimal" network solution makes it unrealistic for use in current
airline seat inventory control and reservations processes. However, simpler leg-based methods, which allocate seats by fare class alone and maximize revenue on individual flight legs, do not take into account the interaction between flight legs across an entire network. A seat inventory control approach is needed which is somewhere between the two extremes. It needs to be aggregated enough to make the problem manageable since making seat allocation decisions for each individual seat on every flight across an entire network is impractical. At the same time, the approach needs to be disaggregated enough to allow control of passenger itineraries over the route network and not just flight leg by flight leg.
Airlines have begun to see the importance of revenue management, which in-volves pricing as well as seat inventory control. Since prices are almost entirely dependent on the pricing strategy of an airline's competitors, emphasis is put on the seat inventory control component of revenue management with the hope of in-creasing total expected revenues. There is a great interest through-out the airline industry in seat inventory control methods. Current practices vary in sophistication and the area of seat inventory control is evolving fast, but overall there is still a strong emphasis on human judgement in determining seat allocations.
2.2
Current Practices
Initially, airline practices in seat inventory control were based exclusively on hu-man judgement rather than systematic analysis. Over the past several years seat inventory control has entered into a transitional stage throughout the industry, with some airlines further ahead than others. Carriers are moving away from control-ling seat inventories on the basis of human expertise alone and moving towards
automated systems which use mathematical techniques and algorithms, as well as data management systems. Analysts who are responsible for controlling seat in-ventories have been able to achieve increased control over revenues. However, as networks become larger and more complicated due to hub-and-spoke operations, and as competition continues to dictate fare levels, making the margin between bottom-line revenues and operating expenses minimal, methods are needed which are more rigourous, consistent and comprehensive.
The simplest approach to seat inventory control is a one-time setting of booking limits based on booking histories. More complicated approaches use historical data, competitors' actions and current trends to set initial booking limits and to make adjustments. As actual bookings are made, past data and future forecasts are used to adjust the booking limits. Many airlines have the beginnings of such a computer-based automated system. Yet, for the most part the capabilities of these systems extend as far as setting initial booking limits, while making adjustments to the initial limits as reservations are accepted is done by humans.
Airlines today employ seat inventory control analysts who are responsible for monitoring and adjusting booking limits throughout the reservations process
[13.
The number of analysts and the extent of their responsibilities vary from airline to airline, and the number of analysts is not necessarily proportional to the size of the airline itself. It also is not proportional to the number of flights per day. However, the higher the number of analysts, proportionally, the more effective the seat inventory control system seems to be.
Airlines with relatively few analysts use an ad hoc process of seat inventory control. Only certain flights and markets are selected for detailed review. These are
usually markets which are highly competitive or are specific flights which operate during peak demand periods. Airlines with more analysts use a more systematic process. Teams of analysts are assigned to groups of markets and flight legs for which they are made responsible. Carriers with the most analysts, proportionally, allot to each analyst all the flights that serve a particular market or a set of routes. These analysts are totally responsible for the mix of passengers and the revenue achieved on their flights.
Most carriers use some type of decision support system in the form of statistical data management and analysis functions for seat inventory control. A data manage-ment system collects and stores historical data from reservations systems and can then estimates demand based on historical patterns and forecasting models. These systems can provide data in a form which can help an analyst to respond to changes in booking patterns as departure time approaches.
Airlines owning larger computer systems have developed, or are in the process of developing, their own decision support and data management systems. Such systems are tied into and used along with their reservations systems. There are also a small number of computer packages which have been made available by software companies particularly for seat inventory control. Most of these software packages are strictly data management packages. Carriers with limited computer facilities are interested.in such data management capabilities and are either investing in an existing package or developing their own version for the purpose of decision support in seat inventory control.
There are a few new developments in software packages which actually allocate seats and determine booking limits. However, seat allocation solutions from such
packages are not always easy to implement and use in a current airline reservations system. Also, the algorithms used in these systems are not necessarily "optimal". It may be easier for an airline to develop its own automated system which can be structured to fit into its existing system.
The seat inventory control systems of most airlines limit fare class bookings by flight leg. As mentioned before, maximizing revenue on individual flight legs is not the same as maximizing total revenues on an entire system. Some carriers have advanced as far as being able to limit local passenger sales in favor of through and connecting passengers with higher total revenue. For example, American Airlines' seat inventory control system is based on itinerary revenues as well as fare classes. However, no airline controls seat inventories on the basis of a passenger's origin and
destination over their entire network system.
Practices of setting initial fare class limits, monitoring actual reservations and making adjustments to booking limits vary throughout the industry. The first step in seat inventory control is setting initial booking limits. The simplest approach involves setting initial booking limits with default values across every flight. While such a system does not take much effort, developing a more complex system which differentiates initial booking limits according to markets and flights can reduce the amount of intervention required later on in the reservations process. A more complex method in setting initial booking limits is to set lower fare class limits based on market, day of the week and time of the day. Such a method requires substantial effort but is better than not differentiating initial booking limits at all. Most airlines use a combination of the two methods, depending on the degree of competition and the level of demand for a given flight.
Rather than improving initial booking limit accuracy, greater benefits can be obtained from developing reservations monitoring systems and adjusting booking limits. A more sophisticated monitoring system can offset weaknesses in a simple initial booking limit method. Major carriers have realized this and have advanced beyond merely setting initial booking limits. Nonetheless, the different approaches used in monitoring actual bookings relative to the pre-set initial limits vary in sophistication.
The simplest approach used in the monitoring step of seat inventory control is merely listing flights for which reservations approach the booking limit for any given fare class. All major carriers have monitoring systems which can at least do this. Some carriers have systems that are a little more advanced where flights are selected and listed on the basis of several parameters. Computer routines in these systems will flag flights in which actual reservations meet or approach a number of different booking limit criteria.
Once reservations monitoring systems have flagged a flight, booking limit adjust-ment decisions must be made. This is the most important aspect of seat inventory control but is the least sophisticated. Decisions must be made whether to increase the number of seats allocated to a fare class and make it available for additional bookings or to leave the booking limit as i- and allow the fare class to close dov-n. In the past these decisions, for the most part, have been made by analysts on the basis of experience and judgement. Airlines have lacked practical models to calculate optimal booking limits.
If optimization algorithms and models are developed and used, they need to consider the probabilistic nature of demand. They also need to make use of fore-casts based on historical data. Still, human judgement cannot be eliminated totally.
Optimization algorithms cannot take into account such things as occurrences of un-expected events and changes in competition and competitive strategies. Models can only be used to help analysts and to make seat inventory control more systematic.
Few airlines are well advanced in the redesign of their reservations system and seat inventory control system. Changes in reservations systems are hindered by the need to remain consistent with the rest of the industry. An airlines' reservations system must be in keeping with the standards of the industry because of carriers dependence on other airlines and travel agents to make bookings. For example, Delta Air Lines accepts 150,000 to 180,000 reservations a day, but 70% of these bookings come from other airlines' reservations systems.
Existing reservations systems do not differentiate between passengers on the same flight leg and within the same fare class, and there are many different origin-destination itineraries on most flights today. An ultimate goal for many airlines is to develop an O-D based reservations system. Still, an upgrade such as this must remain compatible with other reservations systems. The current objective for most airlines is to continue making improvements to decision support tools in order to make more useful infomation available to analysts who make booking limit decisions. Some airlines have advanced to the stage of researching and implementing automated systems to make the booking limit revision process less ad hoc.
Overall, there is a wide range of approaches used by airlines to control seat inven-tories. There are still many improvements which could be made in the seat inventory control system, but the industry as a whole is progressing in the sophistication of its methods and tools. With the increased importance of revenue management to airline profitability, emphasis is being placed on better and more effective seat inventory control systems.
Chapter 3
Overview of Past Research
The main reason behind the low sophistication of seat inventory control systems is the fairly recent realization by airlines of its importance to revenues and profits. At the same time, there is also a lack of practical optimization models for determining the number of seats to allocate to each origin-destination and fare class itinerary in a network. There has been a substantial amount of theoretical research done in the field, but such research has been devoted, for the most part, to large-scale optimization techniques which solve a simplified version of the seat inventory control problem.
The following is an overview of mathematical concepts and models relating to the seat inventory control problem. The discussion is based on past work which started in the early 1970's. The models reviewed range from simple two-class, single flight leg seat inventory control methods to multi-class multi-leg network optimization methods.
An approach based on equating marginal seat revenues was used by Little-wood [2] in 1972. Taking into account the probabilistic nature of demand, LittleLittle-wood developed a method to control low yield fares, in a two fare pricing structue, based
on the objective of maximizing revenues by flight leg. He suggests that low fare passengers, paying a mean revenue of r, should be accepted on a flight as long as:
r > P - R (3.1)
where R is the higher yield revenue and P the maximum risk that acceptance of a low fare passenger will result in the subsequent rejection of a high yield passenger. In other words, total flight revenue will be maximized by accepting low yield passengers up to the point where the probability of selling all remaining seats to high yield passengers is equal to the ratio of the mean revenues of low yield and high yield passengers, r/R.
Bhatia and Parekh [3] of TWA and Richter [4] of Lufthansa expanded on Lit-tlewood's model in 1973 and 1982, respectively. In each case, the formulas derived where in essence equivalent to Littlewood's. Through a rather lengthy differentiation and transformation process, Bahatia and Parekh were able to derive the formula:
F 0
f2(y)dy
(3.2)
F2
where F1 and F2 are the average low and high fare revenues, respectively, C is the
aircraft capacity,
f2(y)
is the high-fare demand distribution and T is the optimal allotment for low-fare passengers.Richter, on the other hand, approaches the problem by looking at changes in the expected total revenue of the flight as additional seats are offered to low-fare passengers. He derives an equality for what he calls differential revenue, defined as the additional low-fare (LF) revenue obtained from offering an extra low-fare seat minus the high-fare (HF) revenue lost:
DR = (additional LF revenue) - (HF revenue lost) (3.3)
= ARPL - Prob[1 additional LF seat] - ARPH
-Prob[1 additional LF seat displacing 1 HF passenger] (3.4)
where ARPL and ARPH are Average Revenue per Passenger, low-fare and high-fare, respectively. By equating DR to zero, Richter's formula for the optimal low-fare seat allotment, ALO, becomes:
ALO = C - H(ARPL/ARPH) (3.5)
where H(x) is the high-fare demand value which is exceeded with risk probability of z. This is equivalent to formulas 3.1 and 3.2. Through Richter's formulation, it can easily be seen that the low-fare seat allotment, ALO, is a function of the fare ratio, capacity, and high-fare demand distribution, but is not influenced by the low-fare demand distribution. However, the low-low-fare demand distribution does have an influence on the total expected revenue of a flight.
In 1982, Buhr [5] of Lufthansa extended the seat allocation problem to a two-leg flight, where decisions as to whether seats should be allocated to local versus through passengers come into play. Buhr considers only one fare class on a linear A to B to C flight. He defines expected residual revenue, E, as being the probability of getting additional passengers, P, multiplied by the corresponding revenue per passenger, R:
EAc = PAc(z) - RAC (3.6)
Local and through passenger demand is assumed to be independent, and the number of seats allocated to segment AB is equal to that of segment BC. Under these
assumptions, Buhr states that total revenue is maximized when:
I
EAC(x)
-[EAB(y) +
EBC(y))I -+ minimum (3.7)subject to the capacity constraint. An iterative solution method is used to find the optimal seat allotments. These seat allotments are based on distinct buckets.
For multiple class situations, Buhr suggests that strict O-D itinerary booking limits be determined first, based on average O-D revenues. Once these limits are known they can be divided and allocated among different fare classes offered for an O-D itinerary. In the process of determining low fare seat allocations versus high fare allocations for an O-D itinerary, the average revenue used in determining the itinerary seat allotments will change, affecting expected revenue levels. Buhr recognizes this problem but does not address it in his paper.
Wang
[6]
of Cathay Pacific Airways addressed the problem of optimizing seat allocations for multi-leg flights with multiple fare types in 1983. He develops a model based on expected marginal revenue which can handle up to six fare types for eachO-D pair on flights of up to four legs. The model determines the O-D combination
which gives the highest expected revenue and allocates a seat to that combination. It then computes the expected revenue for the next seat of each O-D/fare combination and allocates the seat to the highest. This process continues until all seats have been allocated.
The expected revenue for each combination is computed by multiplying the marginal probability of obtaining a given passenger by the fare of the respective O-D/fare combination. That is:
where Yyk is the O-D/fare combination revenue. The marginal probability,Pr(x-k Syk),
is actually the probability of receiving more than spy requests.
In his model, Wang assumes independence of market and fare class demands and seat inventories. His approach is to rank O-D/fare combinations by expected revenues and allocate seats one by one. This is feasible for six fare classes and four flight legs, giving as many as ten O-D itineraries and 60 O-D/fare class combina-tions, but for a typical multi-leg multi-class seat inventory problem faced by major airlines today, where a large number or flights are being fed into and out of a hub, each of which can have as many as 35 or more different O-D passenger itineraries aboard, this model is not very efficient. Network optimization and mathematical programming techniques which find optimal seat allocation solutions, also based on distinct, non-nested inventories, are more pratical.
In 1982 Glover, Glover, Lorenzo and McMillan [7] worked on the O-D/fare class seat inventory control problem using a network flow formulation. Their method was designed to find the "optimum" passenger mix, that is the number of passengers for each fare class/O-D itinerary on each flight segment that would optimize revenue. They formulated the problem as a minimum cost/maximum profit network flow problem with special side constraints. Forward arcs represented the aircraft capacity on a flight leg, while backward arcs represented the number of passengers for each O-D/fare class itinerary.
An actual system was built using this network flow model for Frontier Airlines. The network contained 600 flights, 30,000 passenger itineraries, and 5 fare classes. Running times were brief compared to a linear programming formulation of the problem which would take several hours. The main disadvantage to this method is
that it is based on demand estimates which are entirely deterministic. It is also a non-nested system which is not compatiable with nested airline reservations systems.
Wollmer [8] of McDonnell Douglas Corporation developed a mathematical pro-gramming technique which takes into account probabilistic demands for the multi-leg multi-class problem. In his formulation, Wollmer uses an zjk variable to represent
each O-D/fare class combination
j
and seat k on a flight leg. Associated with eachzXj is a value mj(k) which is the expected marginal revenue of the kth booking request for the O-D/fare class combination
j.
The objective in his model is to max-imize total network revenue by choosing the right combination of zjk values to set to one, and all others to zero, such that the sum of all zjk values associated within-dividual flight leg is equal to the aircraft capacity of the leg. Total network revenue is given as the sum of all [xk - mj(k)] products.
In maximizing revenue, Wollmer's algorithm computes the total network ex-pected revenue without a given O-D/fare class reservation and then computes this revenue quantity for the reduced seating capacity that results from accepting the reservation. By comparing the difference of these two expected revenue values with the actual revenue of the O-D/fare class itinerary under consideration, the model determines whether the O-D/fare class should be closed to further bookings. The drawback of this model, like the other models, is that the optimization solution is based on distinct, non-nested O-D/fare class inventories. Another drawback is the size of the formulation itself. An zjk variable is needed for every seat available to
every O-D and fare class combination for every flight in a given network.
In 1983, Boeing did a study of seat inventory management at the itinerary level [9]. Boeing's method uses a non-linear integer program to find optimal seat
assignments for O-D itineraries based on fares and demand distributions. These seat assignments are then aggregated into buckets by flight leg to conform to the current structure of reservations systems in the airline industry. For each leg, the different O-D itineraries which use the leg are partitioned into buckets based on fare value. The sum of the seat allocations for each O-D itinerary in a bucket is the total seat allocation for the nested bucket. Any number of buckets may be defined, and buckets may have different fare ranges for each leg. The drawback of this method, as Boeing itself admits, is the fact that although a sophisticated assignment process is used, seats are then clumped together and nested in a somewhat ad hoc manner.
The optimal solutions found by these mathematical programming and network formulations are based on non-nested systems. Such solutions are not necessarily optimal for a nested system. Optimization models, which produce seat allocations for distinct inventories, may be re-run frequently to take into account a nested type of system. However, an additional problem with multi-class multi-leg optimization models is the size of their formulations, especially for models which incorporate probabilistic demand behavior. Therefore, simple nested leg-based models may be more pratical than huge probabilistic network formulations which generate non-nested solutions. The best solution, though, may be some type of compromise approach.
None of the models discussed here include overbooking, up-grade potential or correlation in demand. Such considerations can have an effect on. the optimality of determined seat allocations. A realistic seat inventory control system should consider these factors. It also needs to conform to the practical constraints of the seat inventory control problem, such as reservations system capabilities, data availablities, and airline competition.
Chapter 4
Techniques Evaluated For Seat
Inventory Control
This chapter presents six alternative techniques for origdestination seat in-ventory control. Seat inin-ventory control is the allocation of seats among different passenger itineraries and/or fare classes in order to maximize the expected revenues of future scheduled flights. The rationale behind seat inventory control is not to limit seats for low-fare passengers, but rather to protect seats for higher-fare pas-sengers. Effective seat inventory control results in additional revenue being obtained
by selling otherwise empty seats to low-fare passengers. At the same time, revenue is
not lost from displacing higher-fare passengers if enough seats have been protected for these passengers.
The six different approaches which are discussed in this chapter and later eval-uated and compared are:
1. Leg Based Expected Marginal Seat Revenue (EMSR)
2. Prorated EMSR
3. Virtual Nesting EMSR
5. Probabilistic Linear Program
6. Deterministic LP Nested on Shadow Prices.
Each of these is an alternate methodology for a seat inventory control system. The approaches range from simple leg-based models to more complex origin-destination techniques. They also include both probabilistic and deterministic optimization algorithms.
Leg-based methods allocate seats on a flight leg by fare class in an effort to max-imize revenue on each individual flight leg, independent of other flight legs. On the other hand, origin-destination methods take into account the revenue contribution of different passenger itineraries. Seats are allocated not only on the basis of fare class, but also on the basis of different passenger itineraries on the flight leg. In a complete O-D optimization approach, revenue is maximized over the entire system, not by individual flight legs. An origin-destination approach takes into account the interaction of the many flight legs in a network.
Both probabilistic and deterministic methods are discussed and considered in this evaluation. The probabilistic techniques take into account the uncertainty in air traffic demand, which is necessary to model the the seat inventory control prob-lem accurately. However, with
the
introduction of origin-destination approaches,the size and complexity of the problem grows almost exponentially. Therefore, a deterministic representation makes the problem much more manageable. Although the probabilistic nature of demand is not included, the interaction between flight legs is considered and a system-wide revenue maximization solution can be obtained.
In this chapter, the six techniques to be evaluated are described in detail. Results from the application of each technique to a small hypothetical hub connecting bank
are presented in Chapter 5. The methods, with their various attributes of leg-based versus O-D leg-based and probabilistic versus deterministic, are evaluated to give a comparison of the revenue potential and booking limits obtained from each. The different techniques have been chosen for this analysis to determine which are "better", given the complexity of each method and its compatibility with current reservations systems.
4.1
EMSR Model
The three EMSR methods are based on the Expected Marginal Seat Revenue model developed by Belobaba
[10]
in conjunction with Western Airlines. It is a probabilistic revenue optimization model which can be used to set and revise fare class booking limits for a future flight leg departure. It is a leg-based approach to seat inventory control which maximizes expected revenue by flight leg for a nested fare class reservations system. The EMSR model determines the number of seats which should be authorized for sale in each fare class by using historical demand data, average fares, and current bookings.4.1.1
Probabilistic Demand and Expected Marginal Revenue
As the name suggests, the EMSR model is based on expected marginal seat revenues. Seats for a given fare class are protected over lower fare classes by equating the expected marginal revenue of protecting an additional seat in the higher fare class with the expected marginal revenue of not protecting the seat and selling it in the lower fare class. The expected marginal revenue of allocating, or protecting, a seat to a fare class inventory is simply the probability of being able to fill the seat
P
(r)
P(s)
r , requests
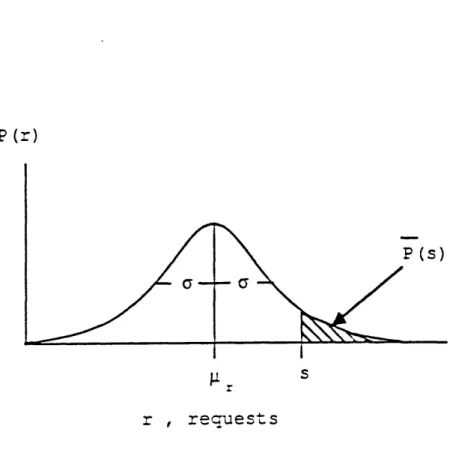
Figure 4.1: Normal Probability Density Function of Demand
multiplied by the average revenue which would be obtained by selling the seat. The average revenue of selling the seat is the same as the average fare of the respective fare class.
As mentioned before, total demand for a particular flight, and for a fare class on that flight, is probabilistic. From past analysis it has been found that this demand can be assumed to have a normal distribution [11]. Therefore, the probability density function, p(r), for tne total number of requests, r, rece ved by an airline, and the demand for a given fare class, is a normal curve as shown in Figure 4.1. Given that demand is normally distributed, the probability function of demand for a fare class can be derived. From a sample of historical data of the same or similar flights, the average, or mean, expected future demand, y, and the standard deviation of the expected demand for the flight, a, can be calculated. From this the probability distribution of the demand can easily be found.
In order to sell S seats in a given fare class, the number of requests for seats in the particular fare class must be greater than or equal to S. Therefore, the probability of selling S seats is the probability of having S or more requests, that is P[r > S]. In a continuous probability distribution such as the normal distribution,
the probability of having S or more requests is:
P[r 2 S]
=
s p(r)dr
=
1
-
P(S)
=
P(S)
(4.1)
P(S) in the above equation is the cumulative probability of having S requests. P(S)
is equivalent to Pjr < s], the probability that the number of requests will be less than or equal to S.
The probability of having S or more requests, 3(S), is equivalent to the proba-bility of selling at least S seats, as mentioned before. This probaproba-bility is equal to the area under the probability distribution curve for requests, as shown in Figure 4.1. From the fundamental property of a probability distribution function:
f
(y)dy
=
1
(4.2)
we know the area under the probability distribution is 1. We also know that the probability distribution curve will lie completely above r = 0 since it is impossible
to have a negative number of requests.
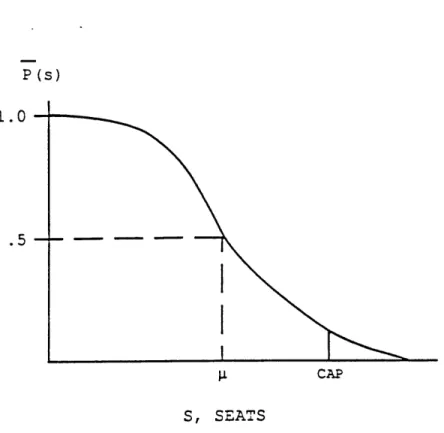
Because of this, the probability of selling the first seat in a particular fare class is approximately equal to 1. This can be found from either determining the probability of having 1 or more requests or from finding the area under the probability curve from 1 to oo. The probability of selling p seats, the mean expected demand, is equal to 0.50. As the number of seats increases, the probability of selling them decreases. This decreasing probability curve of selling the Sth seat is shown in Figure 4.2.
P (s)
1.0
.5 - - -
-CAP
S, SEATS
Figure 4.2: Probability Distribution Function of Selling the Sth Seat
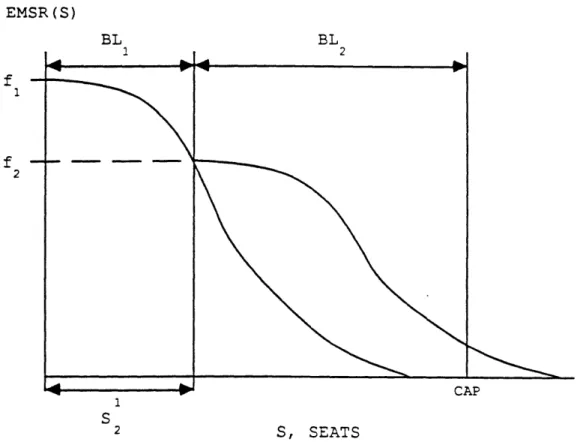
Once the probability of selling the Sth seat, P(S), is known, the expected marginal revenue of the seat is simply:
EMSR(S) =
f
x 7(S) (4.3)That is, the expected marginal revenue of the Sth seat is the average fare level of the seat,
f,
multiplied by the probability of selling the Sth seat. EMSR(S) is directly dependent on 7(S). Thus, the expected marginal revenue curve has the same shape as the probability distrubution function of selling the Sth seat, but the curve is scaled up by the constantf,
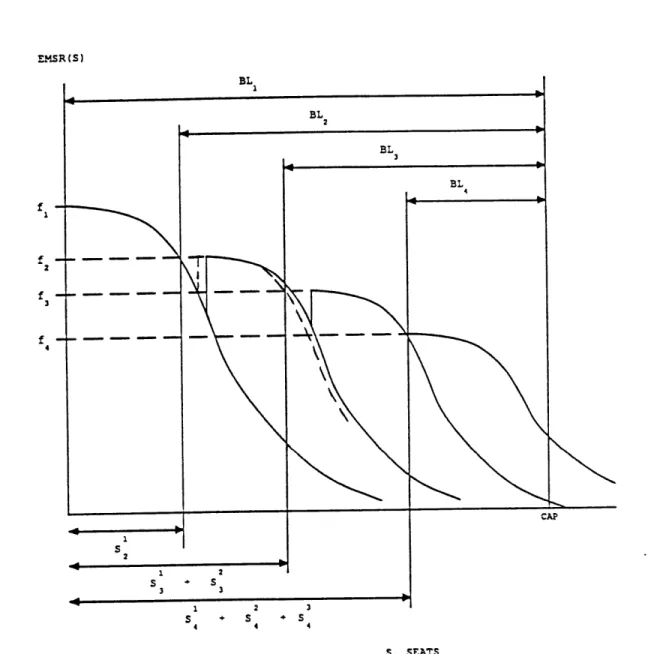
the fare. (Figure 4.3)4.1.2
Leg Based EMSR
The EMSR model was developed as a leg based model. This model is being eval-uated as an "origin-destination" seat inventory control system in order to see how