HAL Id: hal-01477461
https://hal.univ-lorraine.fr/hal-01477461
Submitted on 28 May 2020
HAL is a multi-disciplinary open access
archive for the deposit and dissemination of
sci-entific research documents, whether they are
pub-lished or not. The documents may come from
teaching and research institutions in France or
abroad, or from public or private research centers.
L’archive ouverte pluridisciplinaire HAL, est
destinée au dépôt et à la diffusion de documents
scientifiques de niveau recherche, publiés ou non,
émanant des établissements d’enseignement et de
recherche français ou étrangers, des laboratoires
publics ou privés.
Distributed under a Creative Commons Attribution| 4.0 International License
Biosynthesis of Phenylpropanoid-Derived Compounds in
Wood
Marçal Soler, Anna Plasencia, Jorge Lepikson-Neto, Eduardo L. O. Camargo,
Annabelle Dupas, Nathalie Ladouce, Edouard Pesquet, Fabien Mounet,
Romain Larbat, Jacqueline Grima-Pettenati
To cite this version:
Marçal Soler, Anna Plasencia, Jorge Lepikson-Neto, Eduardo L. O. Camargo, Annabelle Dupas, et
al.. The Woody-Preferential Gene EgMYB88 Regulates the Biosynthesis of Phenylpropanoid-Derived
Compounds in Wood. Frontiers in Plant Science, Frontiers, 2016, 7, �10.3389/fpls.2016.01422�.
�hal-01477461�
Edited by: Thomas Vogt, Leibniz Institute of Plant Biochemistry, Germany Reviewed by: Akiyoshi Kawaoka, Nippon Paper Industries Co., Ltd., Japan Anton R. Schäffner, Helmholtz Zentrum München, Germany Christin Fellenberg, University of Victoria, Canada *Correspondence: Jacqueline Grima-Pettenati grima@lrsv.ups-tlse.fr † Present Address: Jorge Lepikson-Neto, Laboratório de Genomica e Expressão, Universidade Estadual de Campinas, Campinas, Brazil Edouard Pesquet, Arrhenius Laboratories, Department of Ecology, Environment and Plant Sciences, Stockholm, Sweden
Specialty section: This article was submitted to Plant Metabolism and Chemodiversity, a section of the journal Frontiers in Plant Science Received:04 July 2016 Accepted:06 September 2016 Published:22 September 2016 Citation: Soler M, Plasencia A, Lepikson-Neto J, Camargo ELO, Dupas A, Ladouce N, Pesquet E, Mounet F, Larbat R and Grima-Pettenati J (2016) The Woody-Preferential Gene EgMYB88 Regulates the Biosynthesis of Phenylpropanoid-Derived Compounds in Wood. Front. Plant Sci. 7:1422. doi: 10.3389/fpls.2016.01422
The Woody-Preferential Gene
EgMYB88
Regulates the Biosynthesis
of Phenylpropanoid-Derived
Compounds in Wood
Marçal Soler1, Anna Plasencia1, Jorge Lepikson-Neto1 †, Eduardo L. O. Camargo1, Annabelle Dupas1, Nathalie Ladouce1, Edouard Pesquet2 †, Fabien Mounet1, Romain Larbat3and Jacqueline Grima-Pettenati1*
1Laboratoire de Recherche en Sciences Végétales, Centre National de la Recherche Scientifique, Université de Toulouse III,
Paul Sabatier, Toulouse, France,2Department of Plant Physiology, Umeå University, Umeå, Sweden,3“Agronomie et
Environnement” Nancy-Colmar, Institut National de la Recherche Agronomique, Université de Lorraine UMR1121, Vandœuvre-lès-Nancy, France
Comparative phylogenetic analyses of the R2R3-MYB transcription factor family revealed that five subgroups were preferentially found in woody species and were totally absent from Brassicaceae and monocots (Soler et al., 2015). Here, we analyzed one of these subgroups (WPS-I) for which no gene had been yet characterized. Most Eucalyptus members of WPS-I are preferentially expressed in the vascular cambium, the secondary meristem responsible for tree radial growth. We focused on EgMYB88, which is the most specifically and highly expressed in vascular tissues, and showed that it behaves as a transcriptional activator in yeast. Then, we functionally characterized EgMYB88 in both transgenic Arabidopsis and poplar plants overexpressing either the native or the dominant repression form (fused to the Ethylene-responsive element binding factor-associated Amphiphilic Repression motif, EAR). The transgenic Arabidopsis lines had no phenotype whereas the poplar lines overexpressing EgMYB88 exhibited a substantial increase in the levels of the flavonoid catechin and of some salicinoid phenolic glycosides (salicortin, salireposide, and tremulacin), in agreement with the increase of the transcript levels of landmark biosynthetic genes. A change in the lignin structure (increase in the syringyl vs. guaiacyl, S/G ratio) was also observed. Poplar lines overexpressing the EgMYB88 dominant repression form did not show a strict opposite phenotype. The level of catechin was reduced, but the levels of the salicinoid phenolic glycosides and the S/G ratio remained unchanged. In addition, they showed a reduction in soluble oligolignols containing sinapyl p-hydroxybenzoate accompanied by a mild reduction of the insoluble lignin content. Altogether, these results suggest that EgMYB88, and more largely members of the WPS-I group, could control in cambium and in the first layers of differentiating xylem the biosynthesis of some phenylpropanoid-derived secondary metabolites including lignin.
Keywords: vascular cambium, MYB transcription factors, phenylpropanoid metabolism, lignin, oligolignols, flavonoids, salicinoid phenolic glycosides, Eucalyptus
INTRODUCTION
Eucalypts have extremely high adaptive potential and a considerable capacity to produce lignocellulosic biomass, explaining why this genus is the most planted hardwood worldwide for many industrial uses (Myburg et al., 2014). As tree species, eucalypts are long-living organisms characterized by a massive secondary growth produced by the activity of a secondary meristem, called the vascular cambium. Although essential for secondary growth, the vascular cambium is difficult to study because of its internal location and has received much less attention that the other plant meristems. During tree radial growth, the cambial cells divide and differentiate centripetally into xylem cells, characterized by thick secondary cell walls made of cellulose (40–50%), hemicelluloses (25%), and lignin (25–35%) (Plomion et al., 2001).
Lignin is a complex phenolic polymer which ensures essential functions for terrestrial plants providing mechanical support and facilitating the water transport. It is composed of mainly two units, syringyl (S) and guaiacyl (G), with also minor amounts of p-hydroxyphenyl (H) units, all produced by the monolignol-specific branch of the general phenylpropanoid metabolism. In addition to lignin monomers, the phenylpropanoid metabolism serves as a starting point for a vast array of other important compounds, such as flavonoids (flavonols, anthocyans, and proanthocyanidins), coumarins (Vogt, 2010), or phenolic glycosides (Babst et al., 2010). All these phenylpropanoid-derived secondary metabolites are crucial for plant survival, contributing to all aspects of plant responses toward biotic and abiotic stimuli (Vogt, 2010).
R2R3-MYB genes constitute one of the largest families of transcription factors in plants. They regulate many aspects of plant biology, such as primary and secondary metabolism, cell fate, developmental processes, and responses to biotic and abiotic stresses. Noteworthy, more than 30% of these genes characterized in Arabidopsis regulate different aspects of the phenylpropanoid metabolism, including the biosynthesis of lignin and flavonoids (Dubos et al., 2010). R2R3-MYB proteins are characterized by
Abbreviations:4CL, 4-coumarate:CoA ligase; ACT2, actin2; Ade, Adenine; ANR, anthocyanidin reductase; AurA, Aureobasidin A; BD, Gal4 DNA binding domain; BEBT, benzoyl-CoA, benzyl alcohol O-benzoyltransferase; bHLH, basic Helix-Loop-Helix proteins; Cald5H, ferulate 5-hydroxylase; CDC2, cell division cycle2; CHS, chalcone synthase; DFR, dihydroflavonol-4-reductase; EAR, Ethylene-responsive element binding factor-associated Amphiphilic Repression motif; G units, guaiacyl lignin units; G(8-O-4)SP(8-5)G, coniferyl alcohol (8-O-4) sinapyl p-hydroxybenzoate (8-5) coniferyl alcohol; G(8-O-4)SP(8-5)G′, coniferyl
alcohol (8-O-4) sinapyl p-hydroxybenzoate (8-5) coniferaldehyde; GC/MS, Gas Chromatography/Mass Spectrometry; H units, p-hydroxyphenyl lignin units; His, Histidine; HK1, HK3, and HK11, Housekeeping genes 1, 3, and 11; IBA, indole-3-butyric acid; KL, Klason lignin; LC-DAD-MS, Liquid Chromatography with photoDiode Array Detection-Mass Spectrometry; PAL, phenylalanine ammonia-lyase; Pro35S, 35S Cauliflower Mosaic Virus promoter; Py-GC/MS, Pyrolysis–Gas Chromatography/Mass Spectrometry; RT-qPCR, RetroTranscriptase-quantitative Polymerase Chain Reaction; S units, syringyl lignin units; SABT: benzoyl-CoA, salicyl alcohol O-benzoyltransferase; SD, synthetically defined medium used in the yeast autoactivation tests; SP, sinapyl p-hydroxybenzoate; Trp, Tryptophan; U-HPLC, Ultra-High Performance Liquid Chromatography; UBQ, Ubiquitin; WPS, Woody Preferential Subgroups; X-α-Gal, 5-bromo-4-chloro-3-indolyl alpha-D-galactopyranoside.
a highly conserved N-terminal DNA-binding domain (R2R3-MYB domain) and a highly variable C-terminal activation or repression domain. The combination of phylogenetic studies with the detection of conserved motives in the C-terminal region enabled to define 22 subgroups in Arabidopsis (Stracke et al., 2001) found to be quite well conserved in other species. Interestingly, genes within the same subgroup are thought to realize similar functions (Dubos et al., 2010).
Recently, the phylogenetic analysis of the R2R3-MYB members from Eucalyptus grandis, Arabidopsis thaliana, Populus trichocarpa, Vitis vinifera, and Oryza sativa allowed to identify five subgroups of R2R3-MYB proteins preferentially found in woody species, named as Woody Preferential Subgroups (WPS-I, II, III, IV, and V), which are totally absent in the basal lineages of the Bryophytes and Lycophytes, as well as in the more modern Monocot and Brassicaceae lineages (Soler et al., 2015). E. grandis genes from WPS-I, II, and III, are preferentially expressed in the cambial region, and given the close phylogenetic relationship with genes from subgroups involved in the regulation of the phenylpropanoid metabolism such as S4, S5, S6, S7, and SAtMYB5 (Dubos et al., 2010), it could be hypothesized that genes belonging to WPS-I, II, and III regulate the biosynthesis of some phenylpropanoid-derived compounds (Soler et al., 2015). Indeed, some genes belonging to WPS-II and III, but attributed earlier to subdivisions of S4 or S5, have already been shown to regulate the biosynthesis of flavonoids. For example, the two genes characterized from WPS-II (VvMYBPA1 from grapevine and DkMYB2 from persimmon) act as activators of the biosynthesis of proanthocyanidins and other phenylpropanoid-derived compounds (Bogs et al., 2007; Akagi et al., 2010), whereas the genes characterized from WPS-III (FaMYB1 from Fragaria x ananasa, FcMYB1 from Fragaria chiloensis, VvMYBC2-L1, and VvMYBC2-L3 from grapevine, PhMYB27 from petunia and PtMYB182 in poplar) act as repressors of the biosynthesis of these compounds (Aharoni et al., 2001; Salvatierra et al., 2013; Albert et al., 2014; Huang et al., 2014; Cavallini et al., 2015; Yoshida et al., 2015). These studies focused mostly on leaves, fruits, flowers, or in vitro cultivated hairy roots. None has investigated the function of these genes in cambium and/or in differentiating xylem, nor their effects over lignin content and composition. Moreover, no gene belonging to WPS-I has been characterized to date in any plant species.
With the aim to better understand the role of WPS-I R2R3 MYBs, we functionally characterized a representative member, EgMYB88, shown to be highly and preferentially expressed in the cambial region. We showed that it behaves as an autoactivator of Gal4 in yeast. Given the considerable difficulty to obtain transgenic eucalypts, we decided to overexpress EgMYB88 in both Arabidopsis and poplar, either as a native form or fused to an active repressor motif [Ethylene-responsive element binding factor-associated Amphiphilic Repression (EAR)] to transform it into a dominant repressor (Hiratsu et al., 2003). As could be expected from a gene absent in Brassicaceae, the Arabidopsis transgenic lines showed no phenotypic differences compared to controls. In contrast, poplar transgenic lines overexpressing EgMYB88 showed a substantial increase in phenolic glycosides and flavonoids concomitant with a modification of the lignin
structure (increase in the S/G ratio). Poplar lines overexpressing EgMYB88-EAR showed a significant reduction of flavonoids and soluble oligolignols accompanied by a reduction of the lignin content. Altogether, these results suggest that the main role of EgMYB88 in the cambial region, and likely of its orthologs in poplar, is to control specific branches of the phenylpropanoid metabolism.
MATERIALS AND METHODS
Phylogenetic Analysis
Sequences of MYB proteins from E. grandis, P. trichocarpa, V. vinifera, and A. thaliana from a phenylpropanoid metabolism-related super clade were obtained from Soler et al. (2015). It includes members of S4 (with AtMYB6 and AtMYB8), S5, S6, S7, S15, SAtMYB5, SAtMYB82, WPS-I, WPS-II, and WPS-III. For P. trichocarpa, we updated the protein sequences from the last genome version (3.0). Two gene models from version 2.2 were not included in the analysis: POPTR_0019s05200 was absent in version 3.0, whereas the new amino acid sequence prediction of POPTR_0018s08500 (Potri.018G049000) lacked part of the R3 MYB domain.
Amino acid sequences were aligned using MAFFT with the FFT-NS-i algorithm (Katoh et al., 2002) and used to construct a Neighbor-joining phylogenetic tree using Mega5 (Tamura et al., 2011) with 1000 bootstrap replicates. Sequences were compared using the complete deletion method and the evolutionary distances were computed with the Jones–Taylor– Thornton substitution model using the rate variation among sites with a gamma distribution of 1, as done bySoler et al. (2015). A distant R2R3-MYB gene involved in the lignin biosynthesis, AtMYB52 (Cassan-Wang et al., 2013) was also used to root the phylogenetic reconstruction.
Gene Cloning and Vector Construction
EgMYB88 coding sequence was obtained from Eucalyptus gunnii (Eg) xylem cDNA using the primers CACCCATAT GGAGAAATCATCAGCTGCAA and GAGCTCTCCTGATCT CTCATCACA with the Phusion taq (Finnzymes). EgMYB88 sequence from E. gunnii (accession number KX470407) was highly similar to EgrMYB88 (Egr indicates E. grandis) sequence (Eucgr.F04423.1), with just one nucleotide change at the R3 MYB domain which do not modify the amino acid sequence. Amplicon was then inserted in the pENTR D-TOPO vector (Invitrogen) and subsequently transferred into several destination vectors using LR clonase II (Invitrogen) following manufacturer’s instructions. Destination vectors were pGBD-GTW (kindly provide by Dr Laurent Deslandes, LIPM, INRA, France) for yeast auto activation assays, pFAST-G02 (Shimada et al., 2010) for overexpression in Arabidopsis, pJCV53 (obtained from the Gateway Vectors facility from Ghent University, Belgium) for overexpression in poplar, and pH35SGEAR (kindly provided by Dr Taku Demura, NAIST, Nara, Japan) for dominant repression in Arabidopsis and poplar. Coding sequences of EgMYB1 and EgMYB2 (Goicoechea et al., 2005; Legay et al., 2007) were cloned into the pDONR207 vector (Invitrogen) and were transferred into the pGBD-GTW vector also using the LR clonase II.
Plant Material
EgMYB88 cloned into the pFAST-G02, the pJCV53, or the pH35SGEAR vectors was inserted into Agrobacterium tumefaciens GV3101 (pMP90) using freeze and thaw method. Wild type Col-0 Arabidopsis plants were transformed using the floral dip method (Clough and Bent, 1998) with A. tumefaciens harboring EgMYB88 into the pFAST-G02 and the pH35SGEAR vectors. As controls, we used wild type plants and plants transformed with the respective empty vectors. Transformed seeds from pFAST-G02 vector were screened using a fluorescent stereomicroscope with GFP filters as described inShimada et al. (2010), whereas seedlings transformed with the pH35SGEAR vector were screened using MS ½ media supplemented with hygromcycin (20 µg/ml). More than 10 transformed independent lines without any visible phenotype as compared to controls were obtained for each construct and screened by conventional RetroTranscriptase-quantitative Polymerase Chain Reaction (RT-qPCR) to assess the level of transgene expression. For detailed characterization of their phenotypes, three lines were selected for each construct based on high transgene expression levels (Figure S1). Plants were grown in a growth chamber in short day conditions (9 h light and 15 h dark) to promote secondary growth. Sampling was done in plants from at least 8 weeks old, when the inflorescence stems were fully developed and the first siliques were clearly observed. The base of the inflorescence stem was kept in ethanol 80% for histochemistry analysis. The rest of the inflorescence stem without leaves and siliques (except the first 5 cm, which were discarded because the proportion of xylem tissue was very low) was immediately frozen in liquid nitrogen. Five plants samples were pooled for each independent line. They were subsequently milled to powder using a ball-mill (MM400, Retsch) with liquid nitrogen to keep them protected from degradation, and kept at −80◦C for lignin quantification. Similarly, hypocotyls were
harvested, pooled, frozen in liquid nitrogen, milled to powder and kept at −80◦C for Pyrolysis-Gas Chromatography/Mass
Spectrometry (Py-GC/MS) phenolic profiling.
Hybrid Populus tremula x P. alba (INRA clone 717-1-B4) was maintained on MS-1B media (Duchefa) supplemented with 2% sucrose, 0.5 mg/L of IAA (indole-3-acetic acid, Duchefa), and 0.5 mg/L of IBA (indole-3-butyric acid, Sigma). Hybrid poplar was transformed with A. tumefaciens harboring EgMYB88 into the pJCV53 and the pH35SGEAR vectors following the protocol described byGallardo et al. (1999). As controls we used both wild type plants and plants transformed with the empty vectors. Selection of transformants was performed using kanamycin (50 µg/ml) for the pJCV53 and hygromycin (20 µg/ml) for pH35GEAR transformed plantlets. Several transformed plantlets were obtained for each construct without any visible phenotype as compared to controls, and screened by conventional RT-qPCR to assess the level of transgene expression. For detailed characterization of their phenotypes, three lines were selected for each construct according to transgene expression levels (Figure S2); however, for plants overexpressing EgMYB88 into the pJCV53 vector we did not chose the lines with the highest transgene expression as they did not multiply well in vitro. Selected plants were then acclimated for 3 weeks in a growth
chamber in long day conditions (16 h light and 8 h dark) and then transferred into a greenhouse for 2 months. Sampling was done taking a 5 cm portion of the base of the stem and kept it in ethanol 80% for histochemistry analysis. The subsequent 5 cm portion of the base of the stem, taken for transcriptomics, as well as the rest of the stem (except the first 12 internodes, discarded because the proportion of xylem was low), taken for biochemistry, were immediately debarked, frozen in liquid nitrogen, milled to powder and kept at −80◦C for transcriptomic
and biochemical analyses.
Yeast Autoactivation Tests
Yeast cells, strain Y2HGold (Clontech), were transformed with the plasmid pGBD-GTW using the Yeast Transformation System 2 (Clontech) following manufacturer’s instructions and plating them on a Synthetically Defined medium without Tryptophan (SD-Trp). Plasmid pGBD-GTW contains a gene which confers the ability to grow on media without Tryptophan. Transformed yeast cells were resuspended in NaCl 0.9% solution until OD600
of 2 and then plated in different selective media. After 3 days incubation at 30◦C, growing of yeast cells was visible.
Transcriptomic Analysis
Total RNA was extracted from Arabidopsis leaves using the protocol for “vegetative tissues” from Oñate-Sánchez and Vicente-Carbajosa (2008)and from poplar leaves and debarked stems using the protocol from Southerton et al. (1998). RNA was further digested using TurboDNase (Ambion) to remove residual traces of contaminating DNA. One Microgram of RNA was retrotranscribed into cDNA using the High Capacity RNA to cDNA kit (Applied Biosystems) and diluted 5 times before use as template in conventional or microfluidic RT-qPCR.
Conventional RT-qPCR was performed on cDNA from Arabidopsis and poplar leaves to assess the level of transgene expression in technical triplicates using ABI 7900HT real-time PCR system (Applied Biosystems) with the Power SYBR Green PCR Master Mix (Applied Biosystems). PCR conditions were 95
◦C for 10 min, followed by 40 cycles of 95◦C for 15 s and 60◦C for
1 min. After amplification, a dissociation step was performed to confirm the presence of a simple amplicon. Transcript abundance was calculated using the 2−11Ctmethod, with the housekeeping gene actin2 (ACT2,Legay et al., 2010) for Arabidopsis and the housekeeping gene cell division cycle2 (CDC2,Legay et al., 2010) for poplar to normalize data. Control samples were used to standardize results.
Microfluidic RT-qPCR was performed on cDNA from poplar debarked stems to assess the levels of phenylpropanoid metabolism genes using the Biomark R 96.96 Dynamic Array
platform (Fluidigm) as described inCassan-Wang et al. (2012). After amplification, a dissociation step was performed to confirm the presence of a simple amplicon. Transcript abundance was calculated using the 2−11Ct method, with the geometric mean of five validated housekeeping genes to normalize the results [Ubiquitin (UBQ), CDC2 (Legay et al., 2010), HK1, HK3, and HK11 (Sixto et al., 2016)]. Control samples were used to standardize the results. Finally, data was used in MeV (Saeed et al., 2003) to generate a heatmap.
Genes analyzed by microfluidic RT-qPCR were selected according to their importance in the phenylpropanoid metabolism or in cambium activity and differentiation, based on literature search (Ranocha et al., 2002; Shi et al., 2010; Berthet et al., 2011; Sun et al., 2011; Huang et al., 2012; Vanholme et al., 2013; Zhu et al., 2013; Liu et al., 2014a,b; Chedgy et al., 2015; Etchells et al., 2015; Yoshida et al., 2015). Primer sequences were obtained from literature whenever possible or designed either using Quantprime (Arvidsson et al., 2008) or Primer3 (Rozen and Skaletsky, 2000). Primer sequences for RT-qPCR are detailed in Table S1.
Histological Analysis
Arabidopsis and poplar stems were cut into 90 µm-thick sections using a vibratome (VT 100S, Leica). Due to the strong lignification of secondary xylem of poplar stems, vibratome was equipped with a Sapphire blade (Delaware Diamond Knives). Lignified secondary cell walls were stained with phloroglucinol-HCl reagent (VWR) and observed immediately under a bright-field inverted microscope (DM IRBE, Leica) equipped with a CDD color camera (DFC300 FX, Leica).
Biochemical Analysis
Milled samples from Arabidopsis and poplar stems were lyophilized and then subjected to exhaustive extraction with water, then ethanol, ethanol/toluene (50/50) and acetone in a Soxhlet apparatus. Recovered extractive-free samples were dried at 60◦C overnight. Lignin content was evaluated in Arabidopsis
using the acetyl bromide lignin method on 10 mg samples as described bySoler et al. (2016). Klason procedure was performed as previously described (Méchin et al., 2014) to quantify the acid-insoluble lignin on 50 mg of poplar samples.
The poplar lignin structure was analyzed using the thioacidolysis method on 10 mg of extractive-free sample as described byMéchin et al. (2014). Briefly, we used 1 ml of thioacidolysis reagent per mg of sample (for 100 ml of solution: 2.5 ml of boron trifluoride, 10 ml of ethanethiol and 0.2 ml of tetracosane 1.25 mg/ml, up to 100 ml dioxane). An aliquot of this solution (5 µl) was trimethylsilylated with 100 µl of N,O-bis(trimethylsilyl)trifluoroacetamide and 10 µl of pyridine for 30 min at 60◦C. The trimethylsilylated samples were injected in a Gas Chromatography/Mass Spectrometry (GC-MS) (TSQ Quantu, Thermo Scientific) fitted with an autosampler, a splitless injector (280◦C), and a iontrap mass spectrometer operating in
the electronic impact mode with a source at 220◦C, an interface
at 280◦C, and a 50–650 m/z scanning range. The column was a ZB5-MSi (Phénomenex) operated in the temperature program mode (from 45 to 180◦C at +30◦C/min, then 180 to 260◦C at
+3◦C/min) with helium carrier gas at 1.5 ml/min flow rate.
Pyrolysis–Gas Chromatography/Mass Spectrometry (Py-GC/MS) analysis were performed with 80 µg of lyophilized powder per injection using non-extracted Arabidopsis hypocotyls. Powder was applied to a pyrolyzer equipped with an auto sampler (PY-2020iD and AS-1020E, Frontier Lab) connected to a GC/MS (7890A/5975C, Agilent). Pyrolysate separation and analysis, including peak detection, integration, normalization, and identification was done according toGerber et al. (2012).
Metabolite Profiling
A total of 30 mg of lyophilized powder from poplar stems was extracted with 1 mL methanol 70% blended for 1 min using an Ultra-thurrax and then centrifuged at 10,000 g for 10 min. The supernatant was transferred to a new tube and one additional mL was added to the pellet, vortexed and let for 2 h at room temperature. The mixture was centrifuged again at 10,000 g for 10 min and the recovered supernatant was mixed with the first one. The 2 mL solution was evaporated in a speed-vacuum until dryness. Then, dried pellet was dissolved in 500 µL methanol 70% and passed through 0.22 µm filter.
Extracts (1 µL) were analyzed on Ultra-High Performance Liquid Chromatography (U-HPLC) system (Shimadzu) equipped with a photoDiode Array Detector (DAD) and a mass spectrometer. Sample was separated on a C18 kinetex (100 × 2.1 mm) column (Phenomenex). The mobile phase consisted in 0.1% formic acid in ultra-pure water (solvent A) and 0.1% formic acid in methanol (solvent B).
The molecules were eluted through a gradient elution from 1 to 99% B for 13 min with a flow rate of 400 µL/min and then 3 min in 99% B. The column was then re-equilibrated to 1% B prior to the next run. Mass spectrometry analysis was carried out in ESI negative mode. Quantification was performed by measuring the area under each peak at 280, 320, or 350 nm, depending on the lambda max of each molecule. Total metabolic signal was performed at 280 nm. Due to co-eluting signal at 280 nm, catechin quantification was realized by measuring the area under peak at m/z 289, corresponding to the [M-H]−of the molecule. Experimental exact masses and MS fragments were compared to metabolomics data banks (Respect: http://spectra.psc.riken.jp/; Mass Bank: http://massbank.jp/, DNP: http://dnp.chemnetbase. com/) and data available in the literature in order to identify the nature of the metabolites.
RESULTS
The WPS-I Belonging Gene EgrMYB88 Is
Highly and Preferentially Expressed in the
Cambial Region
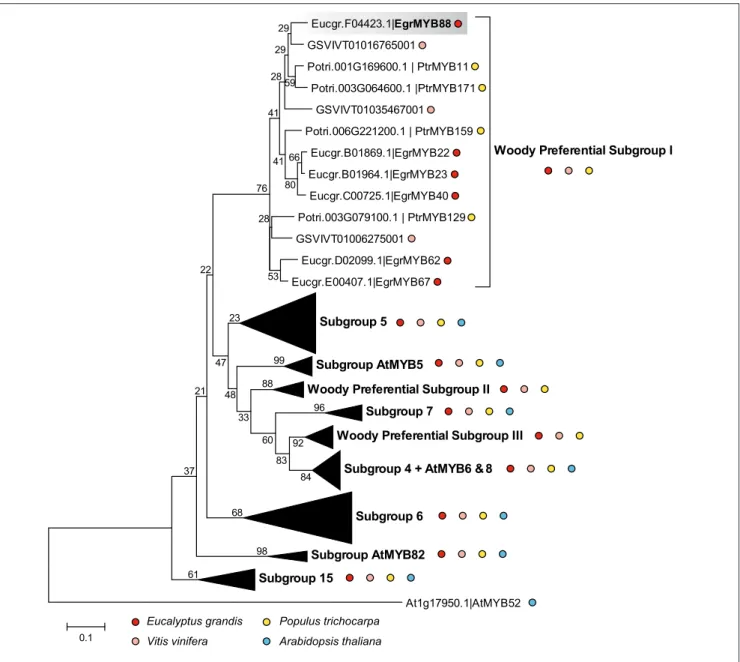
Based on the phylogeny of the whole R2R3-MYB family in E. grandis (Soler et al., 2015), we selected the genes from the WPS-I and from closely related subgroups (S4, S5, S6, S7, SAtMYB5, SAtMYB82, WPS-II, and III) that constitute a phenylpropanoid metabolism-related super-clade. We reconstructed a phylogenetic sub-tree using sequences of E. grandis, A. thaliana, P. trichocarpa, and V. vinifera (Figure 1). WPS-I is supported by a high bootstrap value and is clearly separated from the other subgroups. It contains six genes from E. grandis, four from poplar, three from grapevine, but none from Arabidopsis.
No segmental, whole genome or tandem duplications were previously detected for any of the WPS-I genes in the E. grandis genome (Soler et al., 2015). However, giving the extremely high sequence conservation (98% similarity at the protein level) between EgrMYB22 and EgrMYB23, the corresponding genes likely derived from a relatively recent duplication event further
supported by their close location on the same chromosome (Figure S3, Table S2). All the other members of the WPS-I subgroup are located on different chromosomes. The EgrMYB88 protein sequence is the most divergent from the other Eucalyptus WPS-I members (Table S2). It has two putative orthologs in P. trichocarpa, PrtMYB11 and PtrMYB171 (Figure 1, Table S2).
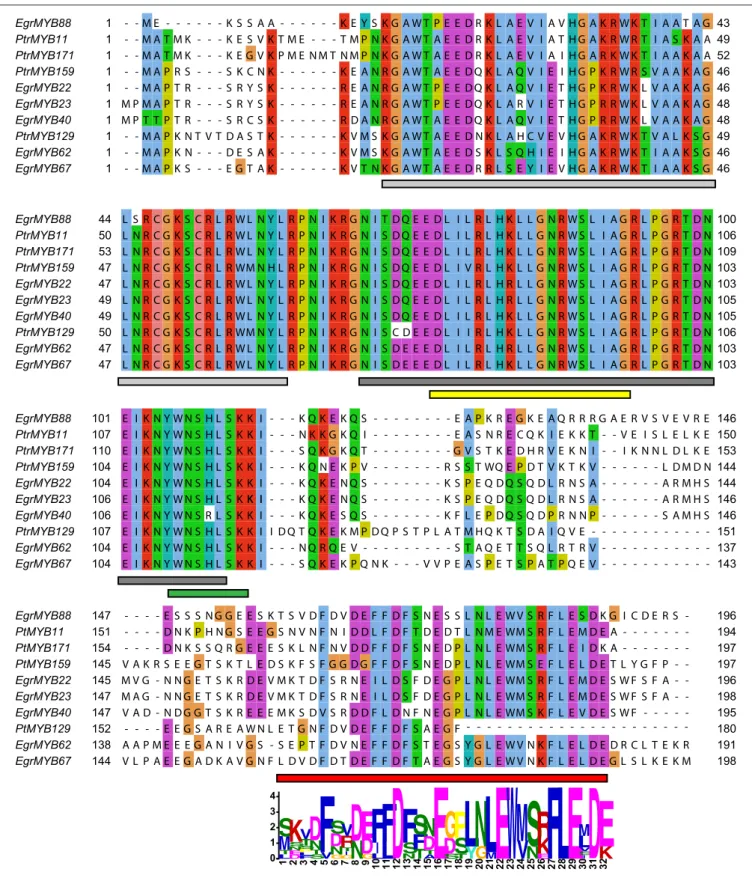
The six E. grandis and the four P. trichocarpa proteins exhibit high sequence homology in the R2R3-MYB domain, and also a conserved motif in the C-terminal region (Figure 2). This motif specific of the subgroup suggests similar function of the WPS-I genes. Moreover, as found for many other R2R3-MYB genes, a predicted motif for interaction with basic Helix-Loop-Helix (bHLH) proteins was also detected [(DE)Lx2(RK)x3Lx6Lx3R;
Figure 2] (Zimmermann et al., 2004), which indicates that the function of these genes may be modulated by protein-protein interactions.
Because WPS-I closely related subgroups such as S6 and S7 involved in flavonoids biosynthesis were shown to be post-transcriptionally repressed by microRNAs, (mostly miR828 and/or miR858;Xia et al., 2012), we examined if the genes of WPS-I could also be targets of these microRNAs. By performing an in silico search, we found that the miRNA828 recognition sequence located at the end of the R2R3-MYB domain was highly conserved (Figure 3) in all the WPS-I genes from Eucalyptus and poplar with the exception of EgrMYB40. No cleavage site for miR858 was found in any of these genes (data not shown). These results are in agreement with a Eucalyptus degradome analysis showing that EgrMYB22, 23, 62, 67, and 88, but no EgrMYB40, were cleaved by miR828 (Carocha and Paiva, personal communication).
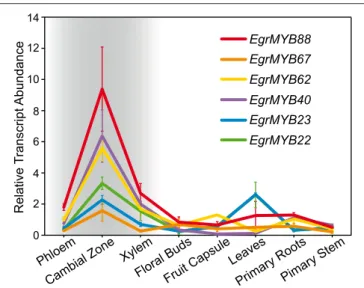
We then analyzed the transcript abundance of the genes from WPS-I in different Eucalyptus organs and tissues previously described in Soler et al. (2015). All of them showed the highest expression in the cambial region although some were also expressed in other tissues/organs (Figure 4). EgrMYB22, for instance was also highly expressed in leaves. EgrMYB88 was preferentially expressed in the vascular tissues (xylem and phloem) and exhibited the highest expression in the cambial region. The expression of its orthologs in P. tremula was obtained from Popgenie database (Sjödin et al., 2009) based on the RNAseq survey performed bySundell et al. (2015). Similarly to EgMYB88, PtMYB11, and PtMYB171 were highly expressed in wood, but exhibited distinct expression profiles in other non-woody tissues (Figure S4). Because of the importance of the vascular cambium and differentiating xylem in the secondary growth characteristic of woody plants, we decided to investigate the function of EgrMYB88 by cloning its coding sequence from E. gunnii growing in Southwest France (EgMYB88). Nucleotide coding sequence is nearly identical between EgrMYB88 and EgMYB88, with just a base change at the R3 MYB domain that do not modify the amino acid sequence.
EgMYB88 Behaves as a Transcriptional
Activator in Yeast
To determine if EgMYB88 is a transcriptional activator, we fused it to the Gal4 binding domain and investigated its
Eucgr.F04423.1|EgrMYB88 GSVIVT01016765001 Potri.001G169600.1 | PtrMYB11 Potri.003G064600.1 |PtrMYB171 GSVIVT01035467001 Potri.006G221200.1 | PtrMYB159 Eucgr.B01869.1|EgrMYB22 Eucgr.B01964.1|EgrMYB23 Eucgr.C00725.1|EgrMYB40 Potri.003G079100.1 | PtrMYB129 GSVIVT01006275001 Eucgr.D02099.1|EgrMYB62 Eucgr.E00407.1|EgrMYB67
Woody Preferential Subgroup I
Subgroup 5
Subgroup AtMYB5
Woody Preferential Subgroup II Subgroup 7
Woody Preferential Subgroup III
Subgroup 4 + AtMYB6 & 8
Subgroup 6 Subgroup AtMYB82 Subgroup 15 At1g17950.1|AtMYB52 99 98 96 92 88 84 83 66 80 59 53 41 29 29 28 41 28 76 68 61 60 33 48 23 47 22 21 37 0.1 Eucalyptus grandis Vitis vinifera Populus trichocarpa Arabidopsis thaliana
FIGURE 1 | Neighbor-Joining phylogenetic tree constructed with R2R3-MYB members of phenylpropanoid metabolism-related super clade. The proteins included belong to the subgroups S4, S5, S6, S7, S15, SAtMYB5, SAtMYB82, WPS-I, WPS-II, and WPS-III from E. grandis (red dots), V. vinifera (pink dots), P. trichocarpa(yellow dots), and A. thaliana (blue dots). The distant protein AtMYB52 (Cassan-Wang et al., 2013), involved in the lignin biosynthesis, was used to root the tree. The WPS-I is expanded to show the different members from E. grandis, P. trichocarpa and V. vinifera, and the absence of genes from Arabidopsis. EgrMYB88 is highlighted with a gray background. Bootstrap values are shown on the internodes.
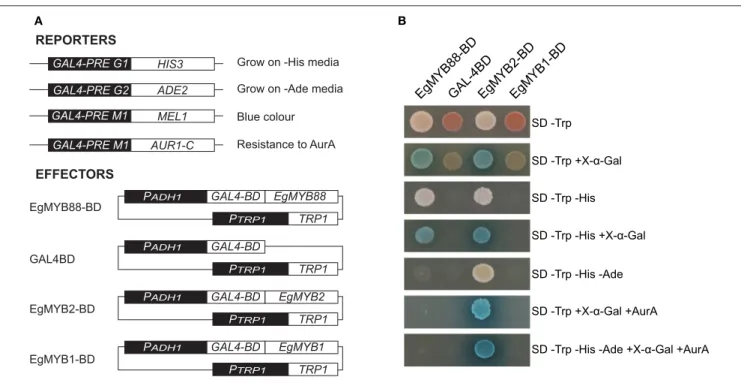
capacity to activate the transcription of four reporter genes in yeast (Figure 5A). EgMYB88 was able to activate the reporter gene HIS3 and MEL1, as revealed by the ability of the yeast transformed with EgMYB88 to grow on selective media lacking Histidine and to metabolize X-α-Gal (5-bromo-4-chloro-3-indolyl alpha-D-galactopyranoside) producing blue colonies (Figure 5B). EgMYB88 was, however, unable to induce the reporter gene ADE2 and AUR1C, since the yeast transformed with EgMYB88 did not grow on media lacking both Adenine and Histidine, or containing the antibiotic Aureobasidin A in addition to X-α-Gal. Thus, EgMYB88 behaves as an activator in yeast, but its activity seems weaker than that of EgMYB2, a known
transcriptional activator (Goicoechea et al., 2005), which was able to activate the four reporter genes (Figure 5B). In contrast, EgMYB1, a known transcriptional repressor (Legay et al., 2007; Soler et al., 2016), as well as the effector empty vector, were unable to activate any of the reporter genes.
Overexpression of EgMYB88 or
EgMYB88-EAR
Does Not Show Effects in
Arabidopsis
As a first step to functionally characterize EgMYB88 in planta, we used the 35S Cauliflower Mosaic Virus promoter
EgrMYB88 PtrMYB171 PtrMYB11 PtrMYB159 EgrMYB22 PtrMYB129 EgrMYB62 EgrMYB67 EgrMYB88 PtrMYB159 EgrMYB22 PtrMYB129 EgrMYB62 EgrMYB67 EgrMYB88 PtrMYB159 EgrMYB22 PtrMYB129 EgrMYB62 EgrMYB67 EgrMYB88 PtMYB159 EgrMYB22 PtMYB129 EgrMYB62 EgrMYB67 1 1 1 1 1 1 1 1 43 52 49 46 46 49 46 46 - - M E - - - K S S A A - - - K E Y S K G A W T P E E D R K L A E V I A V H G A K R W K T I A A T A G - - M A T M K - - - K E G V K P M E N M T N M P N K G A W T A E E D R K L A E V I A I H G A R K W K T I A A K A A - - M A T M K - - - K E S V K T M E - - - T M P N K G A W T A E E D R K L A E V I A T H G A K R W R T I A S K A A - - M A P R S - - - S K C N K - - - K E A N R G A W T A E E D Q K L A Q V I E I H G P K R W R S V A A K A G - - M A P T R - - - S R Y S K - - - R E A N R G A W T P E E D Q K L A Q V I E T H G P K R W K L V A A K A G EgrMYB40 1 M P T T P T R - - - S R C S K - - - R D A N R G A W T A E E D Q K L A Q V I E T H G P R R W K L V A A K A G 48 EgrMYB23 1 M P M A P T R - - - S R Y S K - - - R E A N R G A W T P E E D Q K L A R V I E T H G P R R W K L V A A K A G 48 - - M A P K N T V T D A S T K - - - K V M S K G A W T A E E D N K L A H C V E V H G A K R W K T V A L K S G - - M A P K N - - - D E S A K - - - K V M S K G A W T A E E D S K L S Q H I E I H G A K R W K T I A A K S G - - M A P K S - - - E G T A K - - - K V T N K G A W T A E E D R R L S E Y I E V H G A K R W K T I A A K S G 44 47 47 50 47 47 100 103 103 106 103 103 L S R C G K S C R L R W L N Y L R P N I K R G N I T D Q E E D L I L R L H K L L G N R W S L I A G R L P G R T D N PtrMYB171 53 L N R C G K S C R L R W L N Y L R P N I K R G N I S D Q E E D L I L R L H K L L G N R W S L I A G R L P G R T D N 109 PtrMYB11 50 L N R C G K S C R L R W L N Y L R P N I K R G N I S D Q E E D L I L R L H K L L G N R W S L I A G R L P G R T D N 106 L N R C G K S C R L R WM N H L R P N I K R G N I S D Q E E D L I V R L H K L L G N R W S L I A G R L P G R T D N L N R C G K S C R L R W L N Y L R P N I K R G N I S D Q E E D L I L R L H R L L G N R W S L I A G R L P G R T D N EgrMYB40 49 L N R C G K S C R L R W L N Y L R P N I K R G N I S D Q E E D L I L R L H K L L G N R W S L I A G R L P G R T D N 105 EgrMYB23 49 L N R C G K S C R L R W L N Y L R P N I K R G N I S D Q E E D L I L R L H R L L G N R W S L I A G R L P G R T D N 105 L N R C G K S C R L R WM N Y L R P N I K R G N I S C D E E D L I I R L H K L L G N R W S L I A G R L P G R T D N L N R C G K S C R L R W L N Y L R P N I K R G N I S D E E E D L I L R L H R L L G N R W S L I A G R L P G R T D N L N R C G K S C R L R W L N Y L R P N I K R G N I S D E E E D L I L R L H K L L G N R W S L I A G R L P G R T D N 101 104 104 107 104 104 146 144 144 151 137 143 E I K N Y W N S H L S K K I - - - K Q K E K Q S - - - E A P K R E G K E A Q R R R G A E R V S V E V R E PtrMYB171 110 E I K N Y W N S H L S K K I - - - S Q K G K Q T - - - G V S T K E D H R V E K N I - - I K N N L D L K E 153 PtrMYB11 107 E I K N Y W N S H L S K K I - - - N K K G K Q I - - - E A S N R E C Q K I E K K T - - V E I S L E L K E 150 E I K N Y W N S H L S K K I - - - K Q N E K P V - - - R S S T WQ E P D T V K T K V - - - L D M D N E I K N Y W N S H L S K K I - - - K Q K E N Q S - - - K S P E Q D Q S Q D L R N S A - - - A R M H S EgrMYB40 106 E I K N Y W N S R L S K K I - - - K Q K E S Q S - - - K F L E P D Q S Q D P R N N P - - - S A M H S 146 EgrMYB23 106 E I K N Y W N S H L S K K IK I - - - K Q K E N Q S - - - K S P E Q D Q S Q D L R N S A - - - A R M H S 146 E I K N Y W N S H L S K K I I D Q T Q K E K M P D Q P S T P L A T M H Q K T S D A I Q V E E I K N Y W N S H L S K K I N Q R Q E V S T A Q E T T S Q L R T R V E I K N Y W N S H L S K K I S Q K E K P Q N K V V P E A S P E T S P A T P Q E V -147 145 145 152 138 144 196 197 196 180 191 198 E S S S N G G E E S K T S V D F D V D E F F D F S N E S S L N L E W V S R F L E S D K G I C D E R S -PtMYB171 154 - - - - D N K S S Q R G E E E S K L N F N V D D F F D F S N E D P L N L E WM S R F L E I D K A - - - 197 PtMYB11 151 - - - - D N K P H N G S E E G S N V N F N I D D L F D F T D E D T L N M E WM S R F L E M D E A - - - 194 V A K R S E E G T S K T L E D S K F S F G G D G F F D F S N E D P L N L E WM S E F L E L D E T L Y G F P M V G N N G E T S K R D E V M K T D F S R N E I L D S F D E G P L N L E WM S R F L E M D E S W F S F A -EgrMYB40 147 V A D - N D G G T S K R E E E M K S D V S R D D F L D N F N E G P L N L E WM S K F L E V D E S W F - - - 195 EgrMYB23 147 M A G - N N G E T S K R D E V M K T D F S R N E I L D S F D E G P L N L E WM S R F L E M D E S W F S F A - - 198 E E G S A R E A W N L E T G N F D V D E F F D F S A E G F -A -A P M E E E G -A N I V G S - S E P T F D V N E F F D F S T E G S Y G L E W V N K F L E L D E D R C L T E K R V L P A E E G A D K A V G N F L D V D F D T D E F F D F T A E G S Y G L E W V N K F L E L D E G L S L K E K M 0 1 2 3 4 LT
M
S
1D E NSK
2F LP ST V 3S T ND
4VF
5G ND
S
6G I TR
V
7N
D
8GD
E
9L IF
1 0L
F
1 1D
12N SF
1 3TF
S
1 4A TD
N
1 5E
16SD
G
1 7TS
P
1 8Y
L
1 9G
N
2 0ML
2 1E
22W
23V
M
2 4N
S
2 5EK
R
2 6F
27L
28E
29SI VL
M
3 0D
31K
E
3 2FIGURE 2 | Amino acid sequence alignment of the E. grandis and P. trichocarpa genes belonging to the WPS-I. Amino acid are colored according to their similarity degree using the ClustalX option of Jalview (Waterhouse et al., 2009; http://www.jalview.org/help/html/colourSchemes/clustal.html). Light gray and dark gray rectangles at the bottom of the alignment indicate the R2 and the R3 MYB domains, respectively. Yellow rectangle indicates the bHLH interaction motif described by
Zimmermann et al. (2004). Green rectangle indicates the region that, at the mRNA level, is targeted by the miR828 (Xia et al., 2012). Red rectangle indicates the position of the conserved C-terminal motif, whose sequence obtained using the MEME Suite (Bailey et al., 2009) is indicated below.
R2 R3 C-TERMINAL REGION MYB DOMAIN 10 20 t g g a a c t c t c a t t t g a g c a a g a t g g a a t t c t c a t t t g a g c a a g a t g g a a t t c t c a t t t g a g c a a g a Consensus T G G A A T T C T C A T T T G A G C A A + A 5’-UGGAACUCUCAUUUGAGCAAGA-3’ ||||| |||||||||||||||| 3’-ACCUUAUGAGUAAACUCGUUCU-5’ 337 316 334 343 355 364 t g g a a c t c t c a t t t g a g c a a a a t g g a a c t c t c a t t t g a g c a a a a t g g a a c t c t c g t c t g a g c a a a a 325 331 331 346 352 352 t g g a a t t c t c a t t t g a g c a a a a 325 346 EgrMYB88 PtrMYB11 PtrMYB171 EgrMYB22 EgrMYB23 EgrMYB40 PtrMYB159 EgrMYB62 EgrMYB67 t g g a a t t c t c a t t t g a g c a a g a t g g a a t t c t c a t t t g a g c a a a a 325 325 346 346 PtrMYB129 334 t g g a a t t c t c a t t t g a g c a a g a355 EgrMYB88 miR828 A B
FIGURE 3 | Sequence region targeted by miR828 among the E. grandis and P. trichocarpa members of WPS-I. (A) Gene nucleotide sequence alignment colored according to their degree of identity percentage using Jalview (Waterhouse et al., 2009; http://www.jalview.org/help/html/ colourSchemes/pid.html). (B) Alignment between the EgMYB88 mRNA and the miR828 showing one single mismatch among 22 nucleotides. Sequence targeted by miR828 is based onXia et al. (2012).
promoter (Pro35S) to overexpress in Arabidopsis either its native form (Pro35S:EgMYB88) or a dominant repression form (Pro35S:EgMYB88-EAR). The fusion with the EAR motif was previously shown to efficiently convert transcriptional activators into strong repressors (Hiratsu et al., 2003). Several independent transgenic plants were obtained for each of the two constructs, which were phenotypically similar to the controls (wild-type plants and lines containing empty vectors) after visual inspection. We selected three lines for each construct (Figure S5) in order to further characterize their phenotypes by performing histochemical and biochemical analyses. Sections at the basis of the inflorescence stems were stained in red with phloroglucinol-HCl, a common stain for lignin. No differences in the staining intensity nor in the xylem structure were observed in the Pro35S:EgMYB88 and/or Pro35S:EgMYB88-EAR lines compared to controls (Figure 6). Lignin contents assessed using the acetyl bromide method on extractive-free cell walls of Arabidopsis inflorescence stems were similar in Pro35S:EgMYB88, Pro35S:EgMYB88-EAR lines and controls (Table 1), in agreement with the histological observations. In order to have a wider overview of cell wall composition, we performed Py-GC/MS analysis of non-extracted Arabidopsis hypocotyls. The comparison between the transgenic lines and the controls did not reveal any differences (Table S3).
0 2 4 6 8 10 12 14 EgrMYB22 EgrMYB23 EgrMYB62 EgrMYB67 R e la ti ve T ra n scri p t Ab u n d a n ce EgrMYB88 EgrMYB40 Phloe m Camb ial Z one Xylem Flora l Buds Fruit C apsu le Leave s Prima ry Ro ots Pima ry St em
FIGURE 4 | Transcript abundance data of the different Eucalyptus genes from WPS-I. Expression data (means ± standard deviation) in different organs and tissues from Eucalyptus was extracted fromSoler et al. (2015). Vascular tissues are highlighted with a gray background. EgrMYB88 is the gene with the highest expression in vascular tissues.
Lignin Structure Is Altered in Poplars
Overexpressing EgMYB88 While Lignin
Content Is Reduced When Overexpressing
EgMYB88-EAR
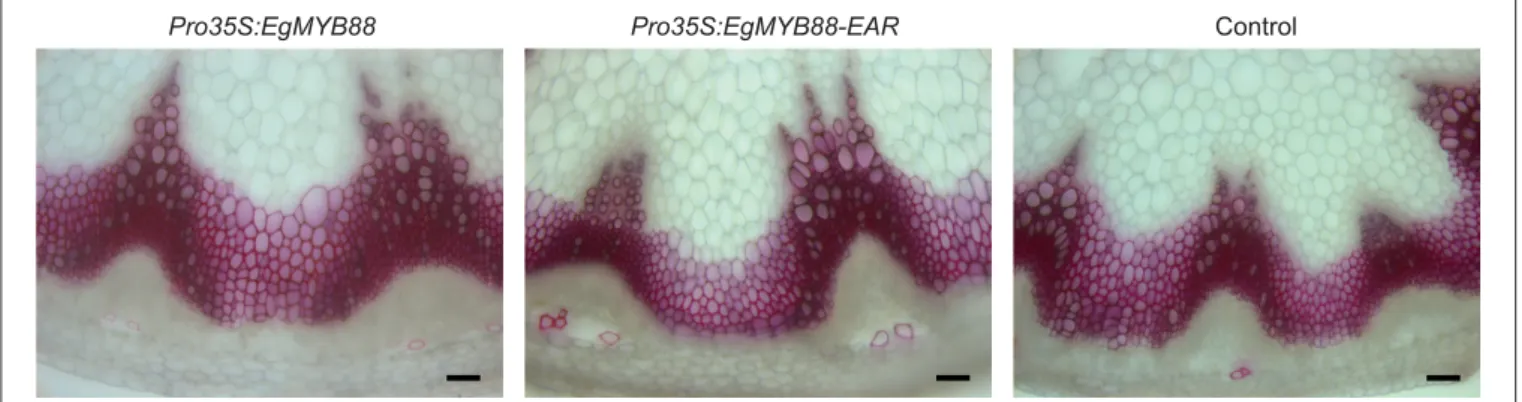
Poplar plants were transformed with the same kind of constructs, i.e., Pro35S:EgMYB88 and Pro35S:EgMYB88-EAR. Transgenic lines generated in vitro did not show any visible differences as compared to control lines. Three independent lines per construct (Figure S6) were acclimated and transferred into the greenhouse for a deeper characterization by histochemical and biochemical analyses. The Pro35S:EgMYB88 and Pro35S:EgMYB88-EAR plants were grown in two separate batches together with their appropriate controls. None of the lines showed differences in their overall xylem structure, including cell wall thickness (observed in mature xylem cells as well as in differentiating xylem close to the vascular cambium), vessel frequency and size (Figure 7). The intensity of the phloroglucinol-HCl staining of Pro35S:EgMYB88 xylem was similar to that of their controls, whereas a weaker red color was observed in the xylem of Pro35S:EgMYB88-EAR lines, suggesting a reduction of the lignin content (Figure 7).
These histochemical observations were confirmed by Klason lignin quantification (Table 2). The insoluble lignin content of Pro35S:EgMYB88 poplar plants was unchanged as compared to their corresponding controls (Table 2) while the Pro35S:EgMYB88-EAR poplar plants exhibited a small but significant reduction (6%) of the Klason lignin content (Table 3). Lignin structure was then analyzed by thioacidolysis, which specifically targets the lignin units (S and G) involved only in labile β-O-4 linkages (Méchin et al., 2014). When normalized relative to the Klason lignin content, the thioacidolysis yield was not significantly different between the Pro35S:EgMYB88
EgMYB1 -BD EgMYB8 8-BD EgMYB2 -BD GAL -4BD SD -Trp SD -Trp +X-α-Gal SD -Trp -His SD -Trp -His +X-α-Gal SD -Trp -His -Ade
SD -Trp -His -Ade +X-α-Gal +AurA SD -Trp +X-α-Gal +AurA
PTRP1 TRP1 PADH1 GAL4-BD EgMYB88
PTRP1 TRP1 PADH1 GAL4-BD
PTRP1 TRP1 PADH1 GAL4-BD EgMYB2
PTRP1 TRP1 PADH1 GAL4-BD EgMYB1 EgMYB88-BD GAL4BD EgMYB2-BD EgMYB1-BD GAL4-PRE G1 HIS3 ADE2 MEL1 AUR1-C EFFECTORS REPORTERS
Grow on -His media Grow on -Ade media Blue colour Resistance to AurA A B GAL4-PRE G2 GAL4-PRE M1 GAL4-PRE M1
FIGURE 5 | Yeast auto-activation tests of EgMYB88 fused to the DNA binding domain of Gal4. (A) Reporter and effector constructs used in the assay. The reporter constructs consists of the cis-regulatory elements to which Gal4 binds before the four reporter genes tested. The effector constructs consist of fusion proteins with the Gal4 binding domain (BD) at the N-terminal end. As controls, we tested the empty vector as well as two well-known Eucalyptus genes, one acting as an activator (EgMYB2,Goicoechea et al., 2005) and the other as a repressor (EgMYB1,Legay et al., 2007). (B) Growth of yeast cells in different selective media. Growth in auxotrophic media (SD) without Tryptophan (Trp) indicates the presence of the effector plasmid. Growth in the absence of Histidine (His) or Adenine (Ade) are indicative of activation of HIS3 and ADE2 reporter genes. Growth in presence of the antibiotic Aureobasidin A (AurA) indicates the activation of AUR1-C, which confers resistance to this antibiotic. Blue color represent the activation of MEL1 reporter gene, able to produce a blue precipitate in presence of
5-bromo-4-chloro-3-indolyl alpha-D-galactopyranoside (X-α-Gal).
lines and their controls, meaning that the total amount of G and S lignin units involved only in β-O-4 linkages was unaffected (Table 2). However, Pro35S:EgMYB88 plants showed a significant different proportion of lignin units, with an increase in S units and a decrease in G units, resulting in a higher S/G ratio (13% higher than controls, Table 2). The thioacidolysis yield was not affected in the Pro35S:EgMYB88-EAR poplar xylem, but the proportion of S and G units were slightly affected resulting in a tendency of lower S/G ratio, although not statistically significant (Table 3).
Overexpression of EgMYB88 and
EgMYB88-EAR
Have Distinct but Not
Strictly Opposite Effects on Poplar
Secondary Metabolism
We also analyzed the effects of EgMYB88 and EgMYB88-EAR on the profiles of soluble secondary metabolites in debarked stems of transgenic poplar lines. The Liquid Chromatography with photoDiode Array Detection–Mass Spectrometry (LC-DAD-MS) analysis of the water-methanol extracts revealed a complex composition of molecules absorbing at 280 nm. Among them, the 21 main different peaks were quantified, of which 14 could be attributed to a compound name or family (Figure S7).
The total content of phenolic secondary metabolites was increased by 12% in Pro35S:EgMYB88 plants compared to controls. This increase was mostly due to salicinoid phenolic
glycosides and to the flavonoid catechin, although some unidentified compounds were also increased (Table 4, Table S4). The three salicinoid phenolic glycosides detected were tremulacin, salicortin, and salireposide, which increased by 87, 70, and 56%, respectively as compared to controls. The level of the flavonoid catechin was also strongly increased (about 2.6 fold compared to controls). In the Pro35S:EgMYB88-EAR poplar plants, the total content of secondary metabolites was not significantly different from controls, neither were the contents of phenolic glycosides (Table 5, Table S5). However, the contents of catechin and oligolignols were significantly reduced by about 40% and 18%, respectively. The oligolignols G(8-O-4)SP(8-5)G [coniferyl alcohol (8-O-4) sinapyl p-hydroxybenzoate (8-5) coniferyl alcohol], G(8-O-4)SP(8-5)G′[coniferyl alcohol (8-O-4) sinapyl p-hydroxybenzoate (8-5) coniferaldehyde] and a putative oligolignol not yet identified, were reduced by 35, 36, and 24%, respectively.
The Transcript Levels of Phenylpropanoid
Metabolism Genes Show Opposite
Tendencies in EgMYB88 and
EgMYB88-EAR
Transgenic Poplars
To investigate the main modifications in gene expression induced by the overexpression of EgMYB88 and EgMYB88-EAR in transgenic poplars, we analyzed the transcript levels of key genes involved in the phenylpropanoid metabolism and in cambium
Pro35S:EgMYB88 Pro35S:EgMYB88-EAR Control
FIGURE 6 | Transverse sections of inflorescence stems of transgenic Arabidopsis plants overexpressing EgMYB88 either as a native form or fused to an EAR motif. Detail of Arabidopsis inflorescence stems where lignin are stained in red by phloroglucinol-HCl. Scale bars: 50 µm. Images shown are representative of the three independent lines analyzed for each construction (Pro35S:EgMYB88 and Pro35S:EgMYB88-EAR, specified in Figure S1).
TABLE 1 | Lignin content in Arabidopsis inflorescence stems evaluated by acetyl bromide.
Pro35S:EgMYB88 Pro35S:EgMYB88-EAR Controls
Acetyl bromide lignin (%)
15.48 ± 1.55 14.66 ± 0.45 15.37 ± 0.59
Data represent the means ± standard deviation of three biological replicates for Pro35S:EgMYB88 and Pro35S:EgMYB88-EAR and five biological replicates for controls. Each biological replicate consisted of a pool of five plants from the same line (selected lines are specified in Figure S1). Acetyl bromide lignin is expressed as % of dry weight. No statistical differences were found using a Student’s t test with a P-value < 0.05.
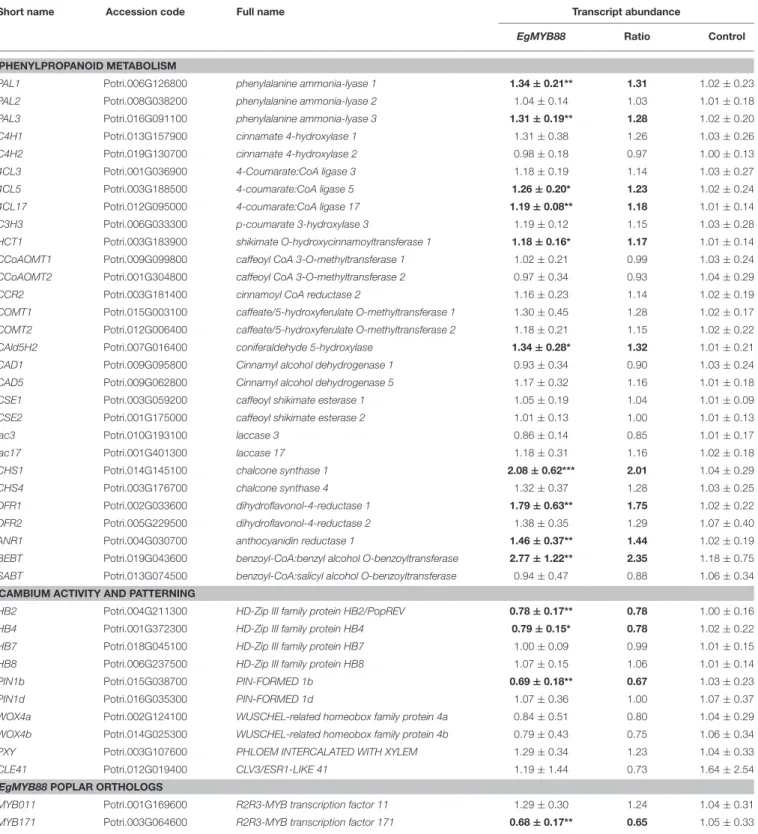
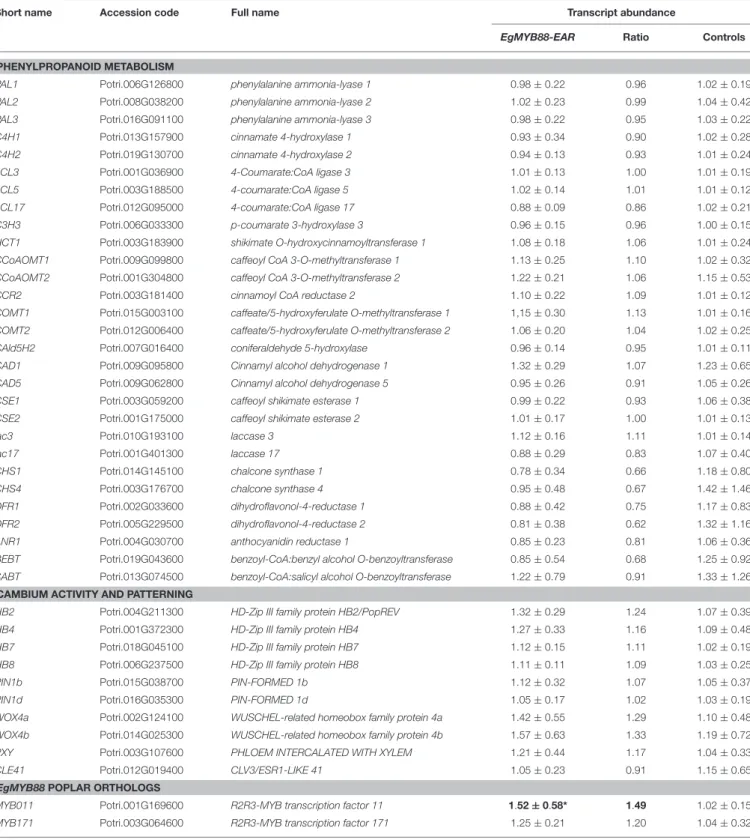
activity and patterning by microfluidic qPCR. In general, as can be seen in the overall picture of Figure 8, Pro35S:EgMYB88 and Pro35S:EgMYB88-EAR showed opposed tendencies, meaning that genes induced in one transgenic type tend to be repressed in the other, and vice versa. However, whereas transcript abundance levels were clearly altered in Pro35S:EgMYB88, they were only moderately altered in Pro35S:EgMYB88-EAR plants (Tables 6, 7). Most of the genes involved in the biosynthesis of phenylpropanoids, including those of lignin, flavonoids, and phenolic glycosides branches, were induced either significantly or at least showed a tendency to be up-regulated in Pro35S:EgMYB88 poplar plants (Figure 8, Table 6). In contrast, they were repressed in Pro35S:EgMYB88-EAR poplars although not significantly because of the high variation found among plants (Figure 8, Table 7). Interestingly, genes involved in the biosynthesis of flavonoids and salicinoid phenolic glycosides were the most induced ones in Pro35S:EgMYB88 poplars (Figure 8, Table 6). The gene encoding benzoyl-CoA:benzyl alcohol O-benzoyltransferase (BEBT), an enzyme involved in the biosynthesis of salicortin and other salicinoid phenolic glycosides (Babst et al., 2010; Chedgy et al., 2015) was the most induced (2.4 fold induction), in agreement with the strong accumulation of phenolic glycosides found in these lines. The genes encoding chalcone synthase (CHS), dihydroflavonol-4-reductase (DFR), and anthocyanidin reductase (ANR), involved in the biosynthesis of flavonoids, were also strongly induced (Figure 8, Table 6), in agreement with the increase in catechin levels. The genes
from the general phenylpropanoid pathway (phenylalanine ammonia-lyase, PAL and 4-coumarate:CoA ligase, 4CL) were moderately induced in Pro35S:EgMYB88 poplars as was ferulate 5-hydroxylase (CAld5H), involved in the biosynthesis of sinapyl alcohol which generate S lignin units, in agreement with the increase in the S/G ratio.
Most of the genes regulating the cambial activity tested in this study were repressed or showed a tendency to be repressed in Pro35S:EgMYB88 poplars (Table 6), whereas they seemed to be induced in Pro35S:EgMYB88-EAR lines (Table 7). HB2/PopREV and HB4, respectively orthologs of Arabidopsis REVOLUTA and PHABULOSA/PHAVOLUTA (Zhu et al., 2013), and PIN1b, ortholog of Arabidopsis PIN1 (Liu et al., 2014b), were significantly repressed in EgMYB88 overexpressing poplars (22, 22, and 23% of repression, respectively). These genes are related to cambium activity and to the differentiation of vascular tissues in Arabidopsis (Gälweiler et al., 1998; Zhong and Ye, 1999) and poplar (Robischon et al., 2011).
Finally, we analyzed the transcript levels of the two poplar orthologs of EgMYB88: MYB11 and MYB171. Unexpectedly, the two genes exhibited opposite behaviors depending on the transgenic lines type. For example, in Pro35S:EgMYB88 plants, MYB171 was clearly repressed (35% repression), whereas MYB11 was not significantly affected (Table 6). In contrast, MYB171 was not significantly altered in Pro35S:EgMYB88-EAR plants whereas MYB11 was clearly induced (40% induction) (Table 7).
DISCUSSION
Our study focused on the R2R3 MYB genes from subgroup WPS-I which are present preferentially in woody perennial plants exhibiting secondary growth (Soler et al., 2015). To the best of our knowledge, none of the genes belonging to this subgroup has been functionally characterized so far in any species. In Eucalyptus, the six genes of this subgroup have not been tandem-duplicated in contrast to most of the genes belonging to the woody-preferential and woody-expanded
Pro35S:EgMYB88 Pro35S:EgMYB88-EAR Controls
A
B
FIGURE 7 | Transverse sections of stems from transgenic poplar plants overexpressing EgMYB88 either as a native form or fused to an EAR motif. (A) Detail of the cambial region and of the first layers of differentiating xylem cells. (B) Detail of mature xylem cells. Sections were stained using phloroglucinol-HCl which stains the lignin in red. Scale bars: 25 µm. Images shown are representative of the three independent lines analyzed for each construction (Pro35S:EgMYB88 and Pro35S:EgMYB88-EAR, specified in Figure S2). One single control representative of the two poplar batches is shown.
TABLE 2 | Lignin content and structure in stems of Pro35S:EgMYB88 poplar transgenic lines evaluated by Klason (KL) and thioacidolysis.
Lines % KL Lignin derived S and G thioacidolysis monomers: total yield and relative molar frequencies
Total yield (µmol/g KL) % S % G S/G
Pro35S:EgMYB88 17.49 ± 0.59 2890 ± 357 64.6 ± 1.9* 35.4 ± 1.9* 1.83 ± 0.16* Controls 17.96 ± 0.91 2949 ± 1042 61.6 ± 3.1 38.5 ± 3.1 1.62 ± 0.21
Data represent the means ± standard deviation of eight Pro35S:EgMYB88 poplar (i.e., two-three individual plants for each of the three selected lines specified in Figure S2A) and seven control plants. Klason lignin is expressed as % of dry weight, and thioacidolysis yield is expressed relative to Klason lignin. Statistics were calculated with Student’s t-test,*P-value < 0.05. Significant differences relative to the control values are highlighted in bold.
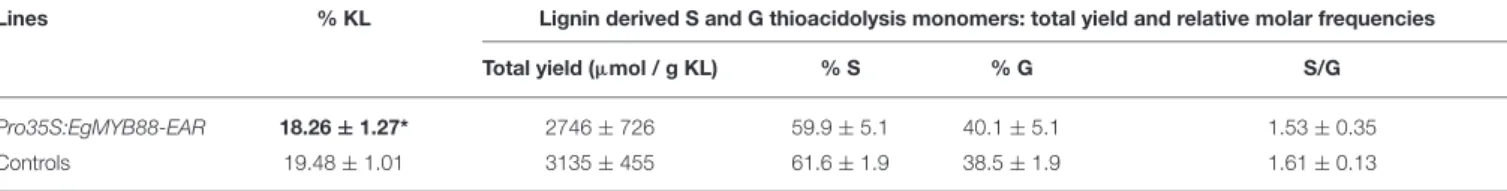
TABLE 3 | Lignin content and structure in stems of Pro35S:EgMYB88-EAR poplar transgenic lines evaluated by Klason (KL) and thioacidolysis.
Lines % KL Lignin derived S and G thioacidolysis monomers: total yield and relative molar frequencies
Total yield (µmol / g KL) % S % G S/G
Pro35S:EgMYB88-EAR 18.26 ± 1.27* 2746 ± 726 59.9 ± 5.1 40.1 ± 5.1 1.53 ± 0.35 Controls 19.48 ± 1.01 3135 ± 455 61.6 ± 1.9 38.5 ± 1.9 1.61 ± 0.13
Data represent the means ± standard deviation of nine Pro35S:EgMYB88-EAR poplar (i.e., three individual plants for each of the three selected lines specified in Figure S2B) and nine control plants for Klason lignin, whereas seven Pro35S:EgMYB88-EAR poplar (i.e., two-three individual plants for each of the three selected lines specified in Figure S2B) and nine control plants were used for thioacidolysis. Klason lignin is expressed as % of dry weight, and thioacidolysis yield is expressed relative to Klason lignin. Statistics were calculated with Student’s t-test,*P-value < 0.05. Significant differences relative to the control values are highlighted in bold.
subgroups (Soler et al., 2015). Five of the six WPS-I Eucalyptus genes and the four poplar genes are targets of miR828, the same miR which targets R2R3 MYBs from several subgroups, many being involved in the regulation of the anthocyanin and
the lignin pathways (Xia et al., 2012). Moreover, miR828 was also shown to target GhMYB2, which is involved in cotton fiber development (Guan et al., 2014). In Eucalyptus, miR828 belong to a cluster of miRs regulated during reaction wood formation
TABLE 4 | Metabolic profiling in stems of Pro35S:EgMYB88 transgenic poplar lines.
Compounds name Pro35S:EgMYB88 Controls Sum peak area
(x1000)
Ratio Sum peak area (x1000)
Total metabolite signal 4175.7 ± 52.4*** 1.1 3721.7 ± 122.2 Catechin (flavonoid) 80.3 ± 26.8* 2.6 30.4 ± 3.1 Sinapaldehyde 337.0 ± 65.6 1.2 276.4 ± 16.0 Salicinoid phenolic glycosides 242.4 ± 26.4** 1.7 142.9 ± 3.7
Salicortin 91.7 ± 13.7** 1.7 53.8 ± 1.9 Salireposide 80.3 ± 4.6*** 1.6 51.6 ± 0.7 Tremulacin 70.4 ± 11.4** 1.9 37.6 ± 2.8 Oligolignols 498.1 ± 76.8 1.0 515.3 ± 30.1 G(8-O-4)S(8-5)G 102.4 ± 12.5 0.9 110.3 ± 7.5 G(8-O-4)S(8-5)G′ 102.5 ± 9.4 0.9 108.7 ± 8.7 G(8-O-4)G(8-O-4)S(8-8)S 39.1 ± 7.4 1.0 39.7 ± 7.5 G(8-O-4)SP(8-5)G 93.8 ± 28.1 1.2 78.5 ± 17.3 G(8-O-4)SP(8-5)G′ 36.2 ± 6.1 1.0 36.7 ± 10.6 Putative oligolignol 124.1 ± 36.8 0.9 133.5 ± 21.2 Unidentified compounds 404.5 ± 12.2*** 1.3 318.9 ± 9.0
Data represent the means ± standard deviation of three Pro35S:EgMYB88 poplar (each Pro35S:EgMYB88 plant belongs to one of the three selected independent lines specified in Figure S2A) and three control plants. Statistics were calculated with Student’s t-test, ***P-value < 0.001, **P-value < 0.01, *P < 0.05. Significant differences relative to controls are highlighted in bold. G(8–O–4)S(8–5)G consists in coniferyl alcohol (8-O-4) sinapyl alcohol (8-5) coniferyl alcohol; G(8–O–4)S(8–5)G′ consists in coniferyl alcohol
(8-O-4) sinapyl alcohol (8-5) coniferaldehyde; G(8–O–4)G(8–O–4)S(8–8)S consists in coniferyl alcohol (8-O-4) coniferyl alcohol (8-O-4) sinapyl alcohol (8-8) sinapyl alcohol; G(8–O–4)SP(8–5)G consists in coniferyl alcohol O-4) sinapyl p-hydroxybenzoate (8-5) coniferyl alcohol; G(8–O–4)SP(8–(8-5)G’ consists in coniferyl alcohol (8-O-4) sinapyl p-hydroxybenzoate (8-5) coniferaldehyde.
(Carocha and Paiva, personal communication) suggesting that WPS-I genes can be controlled post-transcriptionally in response to a mechanical stress. In addition, the transcriptional activities of the WPS-I genes could be modulated through interactions with other proteins, as suggested by the presence of a well conserved bHLH interacting motif among all the genes from the subgroup. Indeed, many R2R3-MYBs interact with bHLH and WD40 proteins, thereby specifying their functions (Ramsay and Glover, 2005). Such interactions were shown to contribute to the tight regulation of the flavonoid biosynthetic genes (Xu et al., 2015).
The transcript profiles of all Eucalyptus MYBs from WPS-I revealed a high expression in the cambial region, reinforcing the idea that they may be involved in some aspects of wood formation. We selected EgrMYB88, which had the highest expression and was also preferentially expressed in this tissue. We showed that EgMYB88 acts as an autoactivator in yeast, suggesting that it is also a transcriptional activator in plants. We functionally characterized EgMYB88 in Arabidopsis and poplar, two model plants previously shown to be useful to decipher the function of Eucalyptus MYB genes (Legay et al., 2010). When overexpressed in Arabidopsis, either in its native form or fused to an EAR motif, EgMYB88 did not produce any phenotype evaluated either at the macroscopic, histologic or biochemical levels. This lack of phenotype could be expected
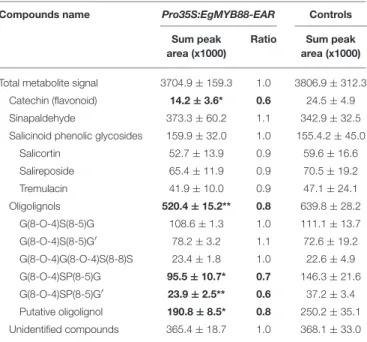
TABLE 5 | Metabolic profiling in stems of Pro35S:EgMYB88-EAR transgenic poplar lines.
Compounds name Pro35S:EgMYB88-EAR Controls Sum peak
area (x1000)
Ratio Sum peak area (x1000)
Total metabolite signal 3704.9 ± 159.3 1.0 3806.9 ± 312.3 Catechin (flavonoid) 14.2 ± 3.6* 0.6 24.5 ± 4.9 Sinapaldehyde 373.3 ± 60.2 1.1 342.9 ± 32.5 Salicinoid phenolic glycosides 159.9 ± 32.0 1.0 155.4.2 ± 45.0
Salicortin 52.7 ± 13.9 0.9 59.6 ± 16.6 Salireposide 65.4 ± 11.9 0.9 70.5 ± 19.2 Tremulacin 41.9 ± 10.0 0.9 47.1 ± 24.1 Oligolignols 520.4 ± 15.2** 0.8 639.8 ± 28.2 G(8-O-4)S(8-5)G 108.6 ± 1.3 1.0 111.1 ± 13.7 G(8-O-4)S(8-5)G′ 78.2 ± 3.2 1.1 72.6 ± 19.2 G(8-O-4)G(8-O-4)S(8-8)S 23.4 ± 1.8 1.0 22.6 ± 4.9 G(8-O-4)SP(8-5)G 95.5 ± 10.7* 0.7 146.3 ± 21.6 G(8-O-4)SP(8-5)G′ 23.9 ± 2.5** 0.6 37.2 ± 3.4 Putative oligolignol 190.8 ± 8.5* 0.8 250.2 ± 35.1 Unidentified compounds 365.4 ± 18.7 1.0 368.1 ± 33.0
Data represent the means ± standard deviation of three Pro35S:EgMYB88-EAR poplar (each Pro35S:EgMYB88-EAR plant belongs to one of the three selected independent lines specified in Figure S2B) and four control plants. Statistics were calculated with Student’s t-test,**P-value < 0.01, *P < 0.05. Significant differences relative to controls are highlighted in bold. G(8–O–4)S(8–5)G consists in coniferyl alcohol (8-O-4) sinapyl alcohol (8-5) coniferyl alcohol; G(8–O–4)S(8–5)G’ consists in coniferyl alcohol (8-O-4) sinapyl alcohol (8-5) coniferaldehyde; G(8–O–4)G(8–O–4)S(8–8)S consists in coniferyl alcohol (8-O-4) coniferyl alcohol (8-O-4) sinapyl alcohol (8-8) sinapyl alcohol; G(8–O–4)SP(8–5)G consists in coniferyl alcohol (8-O-4) sinapyl p-hydroxybenzoate (8-5) coniferyl alcohol; G(8–O–4)SP(8–5)G’ consists in coniferyl alcohol (8-O-4) sinapyl p-hydroxybenzoate (8-5) coniferaldehyde.
since this gene is absent from the Brassicaceae, suggesting that EgMYB88 is not active in the herbaceous model Arabidopsis due to the lack of either appropriate DNA-binding elements in target genes and/or absence of protein partners necessary for the proper function of the gene. It is also possible that miR828 modulates EgMYB88 expression in the transgenic plants resulting in moderate phenotypes in poplar and no phenotypes in Arabidopsis.
In poplar plants, EgMYB88 is able to directly or indirectly activate the phenylpropanoid pathway, as shown by the accumulation of catechin and salicinoid phenolic glycosides in the wood-forming tissues of EgMYB88-overexpressing plants, and also by the induction of many phenylpropanoid biosynthetic genes. The regulation of the phenylpropanoid pathway is also supported by the phenotype of poplars overexpressing EgMYB88-EAR, showing a decrease of catechin levels and lowered transcript levels of many phenylpropanoid biosynthetic genes. However, the phenotype of poplars overexpressing EgMYB88-EAR is not exactly the opposite of that of poplars overexpressing EgMYB88, as the former did not show changes in the levels of salicinoid phenolic glycosides, but a reduction in the level of soluble oligolignols concomitant with a reduction of lignin level. Oligolignols are soluble oligomers constituted of monolignols that polymerize similarly to lignin (Morreel et al., 2010; Vanholme et al., 2010) and, in
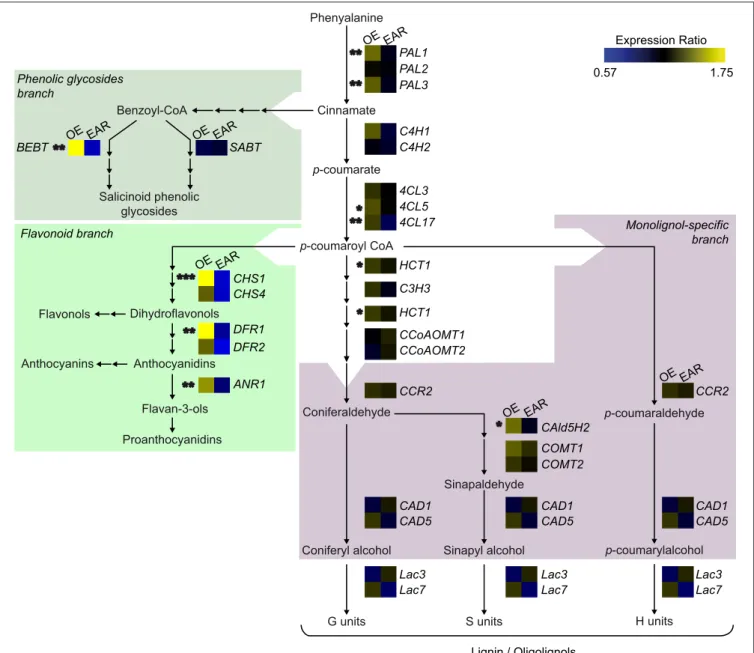
Flavonols Phenyalanine Cinnamate Benzoyl-CoA p-coumarate p-coumaroyl CoA Anthocyanins Proanthocyanidins H units p-coumarylalcohol
Coniferyl alcohol Sinapyl alcohol G units S units Sinapaldehyde Coniferaldehyde p-coumaraldehyde Salicinoid phenolic glycosides Lignin / Oligolignols PAL1 PAL2 PAL3 C4H1 C4H2 4CL3 4CL5 4CL17 C3H3 HCT1 HCT1 CCoAOMT1 CCoAOMT2 CCR2 CCR2 COMT1 COMT2 CAld5H2 CAD1 CAD5 CAD1 CAD5 CAD1 CAD5 Lac3 Lac7 Lac3 Lac7 Lac3 Lac7 CHS1 CHS4 DFR1 DFR2 ANR1 BEBT SABT OE EAR EAR EAR EAR OE OE OE OE EAR OE EAR ** ** *** * * * *** ** ** ** Dihydroflavonols Anthocyanidins Flavan-3-ols 0.57 1.75 Expression Ratio Monolignol-specific branch Flavonoid branch Phenolic glycosides branch
FIGURE 8 | Transcript abundance of genes involved in the phenylpropanoid metabolism in transgenic poplars overexpressing EgMYB88 either as a native form or fused to an EAR motif. The genes are placed in a schematic representation of the pathways leading to lignin, flavonoids, and salicinoid phenolic glycosides, where relevant intermediates are shown (adapted fromTakos et al., 2006; Peng et al., 2008; Jaakola, 2013; Carocha et al., 2015; Chedgy et al., 2015; Wang et al., 2015). Transcript abundance was expressed as a ratio of the abundance of a given gene in transgenic poplar plants, either overexpressing EgMYB88 (OE, shown at the left of the heatmap) or EgMYB88-EAR (EAR, shown at the right of the heat map), respective to its abundance in the corresponding controls. Values were calculated as the means of nine Pro35S:EgMYB88 (i.e., three plants for each of the three selected independent transgenic lines, specified in Figure S2A) and nine respective control poplar plants, or eight Pro35S:EgMYB88-EAR (i.e., two-three plants for each of the three selected independent transgenic lines, specified in Figure S2B) and seven respective control poplar plants. Statistical significance was calculated with Student’s t-test, ***P-value < 0.001, **P-value < 0.01, *P-value < 0.05. Gene names, expression data, and orthologs in other species are detailed in Tables 6, 7, Table S1.
general, plants that produce less lignin show a concomitant reduction of their content in oligolignols (Morreel et al., 2004; Damiani et al., 2005). Interestingly, the oligolignols that were repressed in EgMYB88-EAR overexpressing poplars were those containing sinapyl p-hydroxybenzoate (SP) compounds, formed by the acylation of a sinapyl alcohol with a p-hydroxybenzoic acid prior to their incorporation to
the growing lignin polymer. SP compounds are present in lignin from poplar as well as other plants (Morreel et al., 2004). The fact that EgMYB88-EAR overexpressing poplars contain a significant reduction of oligolignols deriving from benzoic acid, whereas EgMYB88 overexpressing plants show an important accumulation of salicinoid phenolic glycosides also deriving from benzoic acid suggests an unexpected link between these
TABLE 6 | Transcript abundance of key genes in the stems of Pro35S:EgMYB88 poplar plants.
Short name Accession code Full name Transcript abundance
EgMYB88 Ratio Control
PHENYLPROPANOID METABOLISM
PAL1 Potri.006G126800 phenylalanine ammonia-lyase 1 1.34 ± 0.21** 1.31 1.02 ± 0.23 PAL2 Potri.008G038200 phenylalanine ammonia-lyase 2 1.04 ± 0.14 1.03 1.01 ± 0.18 PAL3 Potri.016G091100 phenylalanine ammonia-lyase 3 1.31 ± 0.19** 1.28 1.02 ± 0.20 C4H1 Potri.013G157900 cinnamate 4-hydroxylase 1 1.31 ± 0.38 1.26 1.03 ± 0.26 C4H2 Potri.019G130700 cinnamate 4-hydroxylase 2 0.98 ± 0.18 0.97 1.00 ± 0.13 4CL3 Potri.001G036900 4-Coumarate:CoA ligase 3 1.18 ± 0.19 1.14 1.03 ± 0.27 4CL5 Potri.003G188500 4-coumarate:CoA ligase 5 1.26 ± 0.20* 1.23 1.02 ± 0.24 4CL17 Potri.012G095000 4-coumarate:CoA ligase 17 1.19 ± 0.08** 1.18 1.01 ± 0.14 C3H3 Potri.006G033300 p-coumarate 3-hydroxylase 3 1.19 ± 0.12 1.15 1.03 ± 0.28 HCT1 Potri.003G183900 shikimate O-hydroxycinnamoyltransferase 1 1.18 ± 0.16* 1.17 1.01 ± 0.14 CCoAOMT1 Potri.009G099800 caffeoyl CoA 3-O-methyltransferase 1 1.02 ± 0.21 0.99 1.03 ± 0.24 CCoAOMT2 Potri.001G304800 caffeoyl CoA 3-O-methyltransferase 2 0.97 ± 0.34 0.93 1.04 ± 0.29 CCR2 Potri.003G181400 cinnamoyl CoA reductase 2 1.16 ± 0.23 1.14 1.02 ± 0.19 COMT1 Potri.015G003100 caffeate/5-hydroxyferulate O-methyltransferase 1 1.30 ± 0.45 1.28 1.02 ± 0.17 COMT2 Potri.012G006400 caffeate/5-hydroxyferulate O-methyltransferase 2 1.18 ± 0.21 1.15 1.02 ± 0.22 CAld5H2 Potri.007G016400 coniferaldehyde 5-hydroxylase 1.34 ± 0.28* 1.32 1.01 ± 0.21 CAD1 Potri.009G095800 Cinnamyl alcohol dehydrogenase 1 0.93 ± 0.34 0.90 1.03 ± 0.24 CAD5 Potri.009G062800 Cinnamyl alcohol dehydrogenase 5 1.17 ± 0.32 1.16 1.01 ± 0.18 CSE1 Potri.003G059200 caffeoyl shikimate esterase 1 1.05 ± 0.19 1.04 1.01 ± 0.09 CSE2 Potri.001G175000 caffeoyl shikimate esterase 2 1.01 ± 0.13 1.00 1.01 ± 0.13
lac3 Potri.010G193100 laccase 3 0.86 ± 0.14 0.85 1.01 ± 0.17
lac17 Potri.001G401300 laccase 17 1.18 ± 0.31 1.16 1.02 ± 0.18
CHS1 Potri.014G145100 chalcone synthase 1 2.08 ± 0.62*** 2.01 1.04 ± 0.29 CHS4 Potri.003G176700 chalcone synthase 4 1.32 ± 0.37 1.28 1.03 ± 0.25 DFR1 Potri.002G033600 dihydroflavonol-4-reductase 1 1.79 ± 0.63** 1.75 1.02 ± 0.22 DFR2 Potri.005G229500 dihydroflavonol-4-reductase 2 1.38 ± 0.35 1.29 1.07 ± 0.40 ANR1 Potri.004G030700 anthocyanidin reductase 1 1.46 ± 0.37** 1.44 1.02 ± 0.19 BEBT Potri.019G043600 benzoyl-CoA:benzyl alcohol O-benzoyltransferase 2.77 ± 1.22** 2.35 1.18 ± 0.75 SABT Potri.013G074500 benzoyl-CoA:salicyl alcohol O-benzoyltransferase 0.94 ± 0.47 0.88 1.06 ± 0.34
CAMBIUM ACTIVITY AND PATTERNING
HB2 Potri.004G211300 HD-Zip III family protein HB2/PopREV 0.78 ± 0.17** 0.78 1.00 ± 0.16 HB4 Potri.001G372300 HD-Zip III family protein HB4 0.79 ± 0.15* 0.78 1.02 ± 0.22 HB7 Potri.018G045100 HD-Zip III family protein HB7 1.00 ± 0.09 0.99 1.01 ± 0.15 HB8 Potri.006G237500 HD-Zip III family protein HB8 1.07 ± 0.15 1.06 1.01 ± 0.14 PIN1b Potri.015G038700 PIN-FORMED 1b 0.69 ± 0.18** 0.67 1.03 ± 0.23 PIN1d Potri.016G035300 PIN-FORMED 1d 1.07 ± 0.36 1.00 1.07 ± 0.37 WOX4a Potri.002G124100 WUSCHEL-related homeobox family protein 4a 0.84 ± 0.51 0.80 1.04 ± 0.29 WOX4b Potri.014G025300 WUSCHEL-related homeobox family protein 4b 0.79 ± 0.43 0.75 1.06 ± 0.34 PXY Potri.003G107600 PHLOEM INTERCALATED WITH XYLEM 1.29 ± 0.34 1.23 1.04 ± 0.33 CLE41 Potri.012G019400 CLV3/ESR1-LIKE 41 1.19 ± 1.44 0.73 1.64 ± 2.54
EgMYB88POPLAR ORTHOLOGS
MYB011 Potri.001G169600 R2R3-MYB transcription factor 11 1.29 ± 0.30 1.24 1.04 ± 0.31 MYB171 Potri.003G064600 R2R3-MYB transcription factor 171 0.68 ± 0.17** 0.65 1.05 ± 0.33
Short name, full name and accession number (P. trichocarpa genome v3.0) are indicated for each gene. Transcript abundance (mean ± standard deviation) was calculated from nine Pro35S:EgMYB88 poplar (i.e., three plants for each of the three selected independent transgenic lines specified in Figure S2A) and nine control plants. Ratios of transcript abundance in transgenic poplars relative to controls are also indicated. Statistics were calculated with Student’s t-test,***P-value < 0.001, **P-value < 0.01, *P-value < 0.05. Significant differences relative to the control values are highlighted in bold. Primer sequences are indicated in Table S1.