HAL Id: hal-01605965
https://hal.archives-ouvertes.fr/hal-01605965
Submitted on 22 May 2019
HAL is a multi-disciplinary open access
archive for the deposit and dissemination of
sci-entific research documents, whether they are
pub-lished or not. The documents may come from
teaching and research institutions in France or
abroad, or from public or private research centers.
L’archive ouverte pluridisciplinaire HAL, est
destinée au dépôt et à la diffusion de documents
scientifiques de niveau recherche, publiés ou non,
émanant des établissements d’enseignement et de
recherche français ou étrangers, des laboratoires
publics ou privés.
determined by the thermodynamic
control of the Pta-AckA pathway
Brice Enjalbert
*, Pierre Millard
*, Mickael Dinclaux, Jean-Charles Portais & Fabien Létisse
Escherichia coli excretes acetate upon growth on fermentable sugars, but the regulation of this
production remains elusive. Acetate excretion on excess glucose is thought to be an irreversible process. However, dynamic 13C-metabolic flux analysis revealed a strong bidirectional exchange of acetate between E. coli and its environment. The Pta-AckA pathway was found to be central for both flux directions, while alternative routes (Acs or PoxB) play virtually no role in glucose consumption. Kinetic modelling of the Pta-AckA pathway predicted that its flux is thermodynamically controlled by the extracellular acetate concentration in vivo. Experimental validations confirmed that acetate production can be reduced and even reversed depending solely on its extracellular concentration. Consistently, the Pta-AckA pathway can rapidly switch from acetate production to consumption. Contrary to current knowledge, E. coli is thus able to co-consume glucose and acetate under glucose excess. These metabolic capabilities were confirmed on other glycolytic substrates which support the growth of
E. coli in the gut. These findings highlight the dual role of the Pta-AckA pathway in acetate production
and consumption during growth on glycolytic substrates, uncover a novel regulatory mechanism that controls its flux in vivo, and significantly expand the metabolic capabilities of E. coli.
More than a century ago, Harden reported that the enterobacterium Escherichia coli excretes acetate when grow-ing on excess fermentable sugars1. This phenomenon has been extensively investigated due to its physiological
and applicative importance2–7. In E. coli, the main, constitutive, pathway of acetate production involves a
combi-nation of the phosphate acetyl-transferase (Pta) and acetate kinase (AckA). This way, acetyl-coA is converted into acetyl-phosphate then into acetate which is excreted7. Another route to form acetate is through oxidative
decar-boxylation of pyruvate by pyruvate oxidase PoxB8,9. E. coli is also able to consume acetate as a carbon and energy
source to support growth. Acetate can be metabolized by two alternative pathways: the reversible Pta-AckA path-way (a low affinity route with a KM for acetate of 7–10 mM)2,10, or the high affinity, irreversible acetyl-coA
syn-thetase, Acs (with a KM for acetate of 200 μ M)2,11,12. Both pathways lead to the formation of acetyl-CoA (Fig. 1).
E. coli cells growing on excess glucose produce acetate but consume it only after the glucose is totally
con-sumed7. This diauxic behavior is due to the catabolite repression exerted by glucose on acetate utilization. When
glucose is in excess, the EIIA component of the phosphoenolpyruvate-carbohydrate phosphotransferase system PTS (the main glucose transport system in E. coli), mostly exists in its unphosphorylated form. This leads to the inhibition of adenylyl cyclase. Therefore cAMP levels are low and the transcriptional activator cAMP receptor protein (CRP), which is needed to transcribe acs, is inactive. The repression of acs expression prevents acetate consumption during the period of growth on glucose. In the absence of glucose, cAMP is produced and binds to CRP, which leads to acs expression and allows cells to consume acetate.
Consistent with the control of acs expression, simultaneous consumption of acetate and glucose is observed when catabolite repression is partially impaired13 or weakened14–17. In these conditions, acs is expressed and
acetyl-CoA synthetase (Acs) is active, enabling acetate consumption to occur. The activity of Acs, in concert with the constitutive activity of Pta and AckA, results in setting up a metabolic cycle (Pta-AckA-Acs cycle) in which the acetate produced from glucose by Pta-AckA can be utilized by Acs15–17. This cycle leads to the simultaneous
production and consumption of acetate.
Due to catabolite repression, the simultaneous consumption of glucose and acetate is normally expected not to occur. However, it was recently observed that acetate can be taken up and metabolized during exponential growth of wild-type E. coli K-12 strains on a mixture of glucose and acetate18. This observation was made in conditions
LISBP, Université de Toulouse, CNRS, INRA, INSA, Toulouse, France. *These authors contributed equally to this work.
Correspondence and requests for materials should be addressed to J.-C.P. (email: portais@insa-toulouse.fr) Received: 11 October 2016
Accepted: 28 December 2016 Published: 10 February 2017
of glucose excess. The ability of E. coli K-12 to consume acetate in such conditions is highly intriguing since acs is not expressed due to catabolite repression. This observation suggests acetate can still be utilized by another pathway upon glucose excess. Hence, it is likely that catabolite repression is not the unique determinant of acetate utilization in E. coli.
The first objective of this study was therefore to clarify the pathway by which acetate is consumed upon growth on excess glucose, i.e. in conditions of catabolite repression. The second objective was to identify the mech-anism(s) that control(s) acetate metabolism in such conditions. To address these questions, we designed and carried out dynamic 13C-labeling experiments to quantify acetate production and consumption fluxes
individ-ually, and to identify the metabolic pathways supporting the fluxes. The results pointed out that the Pta-AckA pathway was responsible for both fluxes, and thermodynamic and kinetic in silico analyses suggested this pathway is thermodynamically controlled in vivo by extracellular acetate level. The proposed regulatory mechanism was validated experimentally on glucose and two other glycolytic substrates (gluconate and fucose). To evaluate the strength of the regulatory mechanism, experiments were carried out in conditions for which catabolite repres-sion exerts its control on acetate metabolism, i.e. in batch cultures of the E. coli K-12 wild-type strain growing on excess glucose or on mixtures of glucose and acetate. The findings of this study have broad implications in our understanding of E. coli metabolism and its regulation.
Results
Acetate enters the TCA cycle during growth on glucose.
We first verified that excretion and uptake of acetate actually occur simultaneously when E. coli K-12 MG1655 cells were grown on minimal medium sup-plemented with 15 mM glucose. Small amounts of uniformly 13C-labeled acetate were added to the cultures eitherin mid-exponential growth phase – during which acetate accumulated in the culture medium – or after glucose exhaustion, during which acetate is consumed. When 13C-acetate was added during the latter phase,
incorpora-tion of the 13C-label was observed in virtually all central carbon metabolites (Fig. 2). This includes not only
inter-mediates of the TCA cycle, but also interinter-mediates of carbohydrate pathways, indicating that acetate feeds both oxidative metabolism and gluconeogenesis in these conditions, as expected. When 13C-acetate was added during
exponential growth on glucose, incorporation of 13C label was observed in TCA cycle intermediates, indicating
assimilation of the exogenously supplied acetate. No 13C label was incorporated into intermediates of glycolysis,
which is consistent with a low – if any – gluconeogenic activity in this condition. These results confirmed that extracellular acetate can enter into the cell and be metabolized even on excess glucose18. This utilization of acetate
occurs while acetate was accumulating in the culture medium at the same time. In other words, the net accumu-lation of acetate in the medium upon glucose metabolism results from the balance between acetate production and acetate consumption, revealing the existence of a permanent and bidirectional exchange of acetate between the cells and the medium.
Acetate is simultaneously produced and utilized via the Pta-AckA pathway.
To evaluate the magnitude of the acetate exchange between cells and medium under excess glucose, we measured the separate unidirectional fluxes of acetate production and of acetate consumption. A dynamic 13C-labeling experiment wascarried out by growing E. coli on minimal medium containing a binary mixture of 15 mM U-13C-glucose with
1 mM unlabeled acetate (Fig. 3a). While the concentration of uniformly labeled acetate (produced from glu-cose) increased along growth as a result of the production of acetate from glucose, the initial unlabeled pool decreased with time. A model was developed to simulate the labelling dynamics (Fig. 3b), in which the evolu-tions of the labeled and unlabeled pools of acetate were described as separate ODEs (see Methods section). The unidirectional fluxes of acetate production and acetate consumption were calculated by fitting the experimental data with the model. Acetate production and consumption were measured to be 7.7 ± 0.5 and 5.7 ± 0.5 mmol. gDW−1.h−1, respectively. The values of the unidirectional fluxes were three- to four-fold higher than the net acetate
Figure 1. Representation of E. coli pathways involved in acetate metabolism, in Systems Biology Graphical Notation format (http://sbgn.org)45. Circles represent metabolites and rounded rectangles represent enzymes.
accumulation rate (2.2 mmol.gDW−1.h−1) and were of the same order of magnitude as the specific glucose
con-sumption rate (Fig. 3c).
The two pathways involved in acetate metabolism (i.e. the Pta-AckA and the Acs pathways) have different cofactor requirements (Fig. 1). The net cofactor balance of the complete acetyl-CoA/acetate cycle depends on the metabolic routes that are used for acetate production and acetate consumption, respectively. These routes can ultimately have an impact on the cellular energy balance. This is known to occur under glucose limitation, where acetate production via Pta-AckA and re-consumption via Acs lead to an energy-dissipating cycle, with a net balance of one ATP hydrolyzed into ADP per acetyl-coA recycled17. Assuming the simultaneous production
and consumption of acetate observed in our study occurs entirely via the Pta-AckA-Acs cycle, the corresponding ATP expenditure would represent up to 5.7 mmol.gDW−1.h−1, i.e. 16% of the overall ATP needs of the cell19. To
evaluate the actual impact of the simultaneous acetate production and consumption on cellular energetics, the contribution of each route to acetate production or consumption were quantified in strains deleted for enzymes from each pathway (Δ poxB, Δ acs and Δ ackA; Fig. 3c). The net acetate accumulation fluxes in the Δ acs and Δ poxB strains were similar to those of the wild-type. Consistently, the unidirectional fluxes of acetate production and acetate consumption were similar in the three strains. In contrast, the net accumulation of acetate in the Δ ackA strain was reduced by 71% compared to the wild-type. In this mutant, the unidirectional fluxes of acetate production and acetate consumption were reduced by about 90% compared to the wild-type. These data demon-strate that neither Acs nor PoxB play a role in acetate consumption in this condition while the Pta-AckA pathway can be responsible for both acetate production and acetate consumption. The latter pathway alone is sufficient to maintain a significant bidirectional flux of acetate. Contrary to the Pta-AckA-Acs cycle, this bidirectional process does not result in ATP wasting, and hence should have a minor impact on the ATP balance in E. coli.
E. coli can consume acetate and glucose simultaneously.
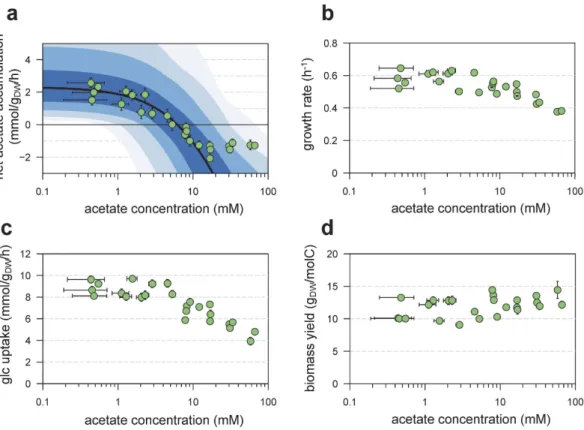
The bidirectional flux of acetate, due to the reversibility of the Pta-AckA pathway, suggested that increasing extracellular acetate concentration could move the balance towards lower acetate production, and possibly towards net acetate consumption. If so, then extra-cellular concentration of acetate in the medium would decline. The free energy of the pathway (Δ GPta-AckA) wascalculated from the concentrations of relevant metabolites (see Methods). The sign of Δ GPta-AckA changed when
acetate concentrations reached 6 mM, indicating that the net acetate flux could be reversed under the physiolog-ical range of metabolite concentrations. To get more quantitative insights into this question, a kinetic model of the Pta-AckA pathway was developed using parameters measured in this study or obtained from the literature (Fig. 4a; see Methods). This model was used to simulate the operation of the pathway for a wide range of acetate concentrations (from 10 μ M to 100 mM). Consistent with experimental observations, the model predicted the accumulation of acetate in the medium at low acetate concentrations (below 10 mM). The Pta-AckA flux was predicted to decrease non-linearly when the acetate concentration increased, and then to reverse for acetate con-centrations above 10 mM, resulting in net acetate consumption (Fig. 4a).
The predictions were tested experimentally by growing E. coli on minimal medium supplemented with glucose plus different concentrations of acetate (from 0.1 mM to 64 mM). Growth rate μ, specific glucose consumption rate qGlc, and specific acetate production rate qac, were estimated for each condition (Fig. 4a–c). Growth rates and qGlc were stable for acetate concentrations up to 8 mM (Fig. 4b and c), and then monotonously decreased as acetate concentration increased, consistently with previous reports5,20. In contrast, q
ac dropped as soon as the
Figure 2. Incorporation of 13C atoms in central metabolites after a pulse of 13C-acetate during exponential growth on glucose or during the acetate consumption phase. E. coli K-12 MG1655 was grown on M9
supplemented with 15 mM glucose. 13C-acetate was added at a final concentration of 1 mM in mid exponential
phase (dark grey bars) or during the phase of net acetate consumption (light grey bars). Intracellular metabolites were collected before each isotopic switch and one hour after the addition of labeled acetate, and the molecular
13C-enrichments of central metabolites were quantified by mass spectrometry. Results are displayed as the ratio
between the 13C-enrichments of metabolite before and after the pulse. Asterisk (*) represents a p-value lower
acetate extracellular concentration was above 1 mM (Fig. 4a). At an initial acetate concentration of 5.5 mM, qac reached zero meaning that acetate no longer accumulated in the culture medium. This is in excellent agreement with the value of 6 mM predicted by the kinetic model. Above the threshold concentration of 5.5 mM, qac was negative indicating that the extracellular concentration of acetate decreased in the culture medium. At acetate concentrations above 32 mM, acetate uptake was stabilized at 1.7 ± 0.3 mmol.gDW−1.h−1, which is lower than the
predicted value (Fig. 4b). This may indicate saturation of acetate uptake or strong feedback inhibition by the rest of metabolism. These data also mean that glucose and acetate can be co-consumed by E. coli.
Exposure of E. coli cells to high acetate concentrations results in decreased growth rates while the growth yield
YX/S remains constant (Fig. 4d). This confirms that the bidirectional operation of the Pta-AckA pathway does not massively dissipate energy otherwise one could expect a reduced growth yield.
The Pta-AckA pathway supports acetate consumption in the presence of glucose.
To confirm that the Pta-AckA pathway is actually responsible for acetate consumption under excess glucose, the net flux ofFigure 3. Quantification of acetate consumption and production fluxes by dynamic 13C-metabolic flux analysis. (a) Time-course profiles of glucose and total, labeled and unlabeled extracellular acetate
concentrations. E. coli was grown on M9 supplemented with 15 mM 13C-glucose and 1 mM unlabeled acetate.
The concentration of the four isotopomers of acetate was quantified by NMR every 30 minutes until the cells had consumed all the glucose (red circles). Unlabeled and 1,2-13C
2-acetate are shown in yellow and
blue, respectively. Concentrations of 1-13C
1- and 2-13C1-acetate remained negligible (< 0.1 mM) during the
experiment. Total acetate concentration (in green) was calculated by summing the concentrations of all its isotopomers. Circles represent measurements, lines represent the best fit with their 95% confidence intervals (shaded areas). (b) Graphical representation of the model used to quantify acetate production and uptake fluxes. Details on this model are provided in the Methods section. (c) Glucose and acetate fluxes in E. coli K-12 MG1655 WT and its derivatives Δ ackA, Δ acs and Δ poxB strains. The experimental data shown in panel a were used to quantify the glucose uptake rate (red bars) and the net acetate accumulation flux (green bars) and its underlying production (blue bars) and consumption (orange bars) fluxes. Asterisk (*) represents a p-value lower than 0.01 when compared to the wild type strain.
acetate accumulation, and the unidirectional fluxes of acetate production and acetate consumption were meas-ured in the wild-type, Δ acs, Δ poxB, and Δ ackA strains for different acetate concentrations (Fig. 5). As observed above, the net accumulation of acetate in the wild-type strain reversed to a net consumption when acetate con-centration was 8 mM or above (Fig. 5a). The behavior of the Δ poxB and Δ acs strains was similar to that of the wild-type, i.e. a shift from net accumulation to net consumption with increasing acetate concentrations. The net acetate accumulation rates were 1.7 ± 0.1 and 2.0 ± 0.1 mmol.gDW−1.h-1 at 1 mM of acetate and shift to − 1.8 ± 0.1
and − 1.5 ± 0.1 mmol.gDW−1.h−1 at 32 mM of acetate for Δ acs and Δ poxB strains respectively (Fig. 5a). In contrast,
the ackA deletion virtually abolished both acetate production and consumption fluxes (Fig. 5b and c), under all tested acetate concentrations. A weak acetate accumulation (0.6 ± 0.2 mmol.gDW−1.h−1) was still observed in this
mutant (Fig. 5a and b). This production can be due to the AckA independent transfer of phosphate by acetyl-P resulting in acetate formation21 or to the operation of biosynthetic pathways (methionine, cysteine, arginine, etc.)
in which acetate is a metabolic by-product17. These results confirmed that, in the range of acetate concentrations
tested, the Pta-AckA pathway is responsible for both the production and consumption of acetate, with no signif-icant role of Acs and PoxB.
The metabolic control of the Pta-AckA pathway ensures a rapid response of E. coli to changes
in acetate availability.
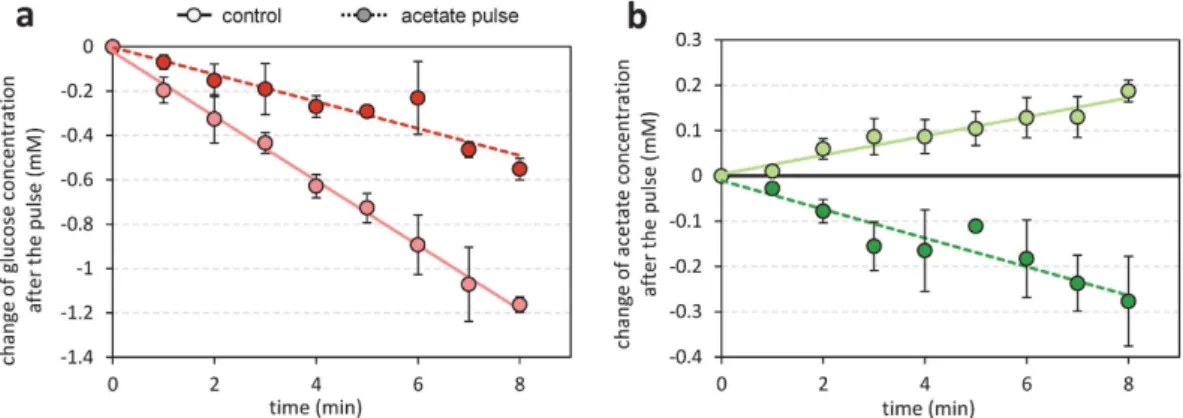
An intuitive advantage of the proposed regulatory mechanism is that it could enable a rapid response of the Pta-AckA flux to changes in acetate availability. To evaluate the timing of this response,E. coli was grown on glucose, and in mid-exponential phase acetate was added to the culture to suddenly increase
the acetate concentration from 3 to 30 mM. Changes in glucose and acetate concentrations were monitored every minute after the acetate pulse for 8 minutes and compared to a control experiment where no acetate was added (Fig. 6). The glucose consumption rate was reduced after the acetate pulse (Fig. 6a) which is consistent with the results obtained in steady-state conditions (Fig. 4b). Remarkably, while the acetate concentration increased in the control experiment, it decreased in the one or two minutes after the acetate pulse (Fig. 6b). Therefore, the addition of acetate provoked a rapid reversal of the net acetate flux from accumulation towards utilization. This fast response confirms the actual control of the Pta-AckA pathway in vivo by extracellular acetate levels and is consistent with the thermodynamic control of this pathway.
Figure 4. In silico analysis of the Pta-AckA pathway, and experimental validation of model predictions.
The steady-state flux through the Pta-Ack pathway was simulated for different acetate levels (panel a, black line), with kinetic parameters taken from the literature and concentrations of ADP, ATP, CoA, acetyl-CoA and phosphate set to experimental values. To investigate the robustness of these predictions, sensitivity analysis was carried out by uniformly sampling all concentrations and parameters within ± 10%, ± 20%, ± 30% and ± 40% of their experimental values (dark blue to light blue, respectively). These predictions were compared to experimental values (green dots). Experimental growth rates (b), glucose uptake rates (c) and growth yields (d) for different acetate levels.
Acetate is not only a by-product of glycolytic carbon sources but is also their potential
co-substrate.
We showed that glucose and acetate can be co-substrates for E. coli provided the latter com-pound is present in sufficiently high concentrations in the medium. We investigated whether this could also be the case for other glycolytic carbon sources, notably for some nutrients assumed to support growth of E. coli in the human gut. This was tested by growing E. coli on gluconate and fucose with or without addition of 32 mM acetate in the medium. As observed on glucose, acetate was produced from gluconate or fucose as sole carbon sources. When 32 mM acetate was added to the medium, acetate was utilized simultaneousy with the glycolytic substrates (Fig. 7). These observations extend the findings made on glucose and indicate that acetate is not only a by-product of glycolytic nutrients but can also be their co-substrate, depending solely on its extracellular concentration.Discussion
The data reported in this work show that E. coli can consume both acetate and glucose simultaneously upon expo-nential growth on excess glucose, in contrast to what is usually considered for this organism. This acetate con-sumption is not supported by acetyl-CoA synthetase. Not only is this enzyme repressed by catabolite repression in these conditions, but the simultaneous consumption of glucose and acetate is observed – to the same extent
Figure 5. Net acetate accumulation flux and unidirectional production and consumption fluxes in
E. coli K-12 MG1655 WT, ΔackA, Δacs and ΔpoxB grown on glucose and different acetate concentrations.
Dynamic 13C-metabolic flux analyses were carried out in which cells were grown in a medium containing
uniformly 13C-labelled glucose + 1, 8, 12 or 32 mM of unlabeled acetate. The fluxes of net acetate accumulation
(a) and individual acetate production (b) and consumption (c) were quantified by fitting to experimental data, as detailed in the Methods. Asterisk (*) represents a p-value lower than 0.01 when compared to the wild type strain grown in the same condition.
and even at very high acetate concentrations – in a mutant deleted for the acs gene. The potential contribution of PoxB to this phenomenon can also be eliminated. This acetate utilization is supported by the Pta-AckA pathway. Though known to be reversible, the latter pathway is considered to be involved only in acetate production. Our data show that the Pta-AckA pathway alone can support both the production and consumption of acetate upon excess glucose. Indeed, the pathway allows two opposite processes to occur concomitantly, including the con-version of acetyl-CoA into acetate and the reverse concon-version of acetate into acetyl-CoA. The two unidirectional fluxes were measured and were significant. They were in the range of glucose uptake, and were 3–4 times higher than the net flux of acetate production or utilization. The overall result (acetate production or consumption) is the net balance between the two opposite processes. The net direction of the Pta-AckA pathway upon excess glucose, i.e. net production or net utilization of acetate, is controlled thermodynamically and is basically deter-mined by the extracellular concentration of the compound. The experimental data and the kinetic model of the Pta-AckA pathway presented in this work are consistent and indicate that acetate is produced when its external concentration is below a threshold value of 8 mM. Above this threshold value, acetate is consumed.
The two main pathways of acetate metabolism in E. coli, i.e. the Pta-AckA and Acs pathways, appear to have very different mechanisms of control. Acs is controlled by catabolite repression, which is an active regulation process. This repression prevents the operation of the Pta-AckA-Acs cycle and hence avoids the spillage of energy. The Pta-AckA pathway is controlled thermodynamically – i.e. a passive process – which can have various ben-efits. First, the unidirectional fluxes of acetate production and acetate utilization are instantaneously adapted to the external concentration of acetate. This allows fine tuning of acetate metabolism according to its availability. Moreover, this regulatory mechanism allows metabolism to switch rapidly from acetate dissimilation to acetate assimilation during glycolytic growth, for instance in response to a sudden increase in acetate availability. Indeed, as shown by the acetate pulse experiments, the thermodynamic response time of the Pta-AckA pathway is of the order of 2 minutes, which is much faster than the time needed to functionally express new enzymes by hierarchi-cal regulation (i.e. Acs). This ability to react fast is likely beneficial to face sudden changes in acetate concentration
Figure 6. Short-term response of the Pta-AckA flux to an acetate pulse. E. coli was grown on M9
supplemented with 15 mM glucose. Changes in concentration of glucose (a) and acetate (b) were measured in mid-exponential growth phase with (dark green line) or without (control experiment, light green line) addition of acetate (at a final concentration of 30 mM) in mid-exponential growth phase.
Figure 7. E. coli can co-consume acetate and glycolytic carbon sources. E. coli was grown on M9
supplemented with 15 mM gluconate or fucose. Growth rates, glycolytic substrate uptake rates and acetate accumulation rates were measured with or without acetate added initially to the medium (at a concentration of 32 mM). Asterisk (*) represents a p-value lower than 0.01 when compared to the same condition without acetate added initially to the medium.
pool through the thermodynamic control of the Pta-AckA pathway. This, in turn, would regulate many cellular processes, and likely result in fine tuning of metabolism according to acetate availability.
Our data indicate that acetate metabolism in E. coli is controlled to a large extent by the environment through the thermodynamic control of the Pta-AckA pathway. This control allows the bacterium to consume acetate even in conditions of glucose excess, provided the external concentration in acetate is high enough. This contrasts with the general consideration that acetate can be consumed only after exhaustion of glycolytic carbon sources. Our results indicate that the mode of utilization of glycolytic substrates and acetate by E. coli can be either sequen-tial or concomitant depending on acetate availability. The net production of acetate by glucose-utilizing cells is abolished when the external concentration of acetate is 8 mM. Neither glucose uptake nor cell growth are altered in this condition, indicating that (net) acetate production is not an absolute requirement for E. coli to grow on glucose, be it to conserve energy27, or to control toxic organic acid pools28. In the laboratory, growth of E. coli on
glucose is typically carried out in conditions resulting in low accumulation of acetate. In such conditions, the thermodynamics of the Pta-AckA pathway favors acetate production. The net production of acetate upon (expo-nential) growth on glucose can be the result of the thermodynamic driving force in the Pta-AckA pathway that drives acetate metabolism towards acetate production. In contrast to laboratory conditions, acetate concentration in the intestine is high (between 30 and 100 mM)29–31, well above the 8 mM threshold. From the thermodynamic
point of view, such levels of acetate favor the net consumption of this compound in the intestine. It is therefore very likely that E. coli co-consumes acetate together with sugars in the intestine, in contrast to what is currently assumed32.
Methods
Bacterial strains.
Escherichia coli K-12 MG1655 was selected as the model wild-type strain. BW25113mutants33 were used to create their equivalent in the MG1655 background by bacteriophage P1-mediated
transduction. Constructions were validated by PCR using internal, external and kanamycin-related primers (Supplementary Table S1). The list of strains is given in Supplementary Table S2.
Cultures.
E. coli was grown in M9 mineral medium complemented with 15 mM glucose34. Sodium acetate(prepared in solution at pH 7) was added to reach the required concentration. Acetate labelling assay was per-formed by adding 1.4 mM fully 13C-labeled acetate during mid-exponential phase or 2.4 mM one hour after
glucose exhaustion. For 13C-labeling experiments designed for flux calculation, unlabeled glucose was replaced
by uniformly 13C-labeled glucose (Eurisotop, France). Cultures were performed in duplicate or triplicate in
shake-flasks at 37 °C and 200 rpm, in a volume of 200 mL. Growth was monitored by optical density at 600 nm using a Genesys 6 spectrophotometer (Thermo, USA), and a correlation factor of 0.37 gDW/L/OD unit was used
to calculate biomass concentration.
Extracellular metabolome analysis.
Concentrations of labeled and unlabeled glucose and acetate were quantified in filtered broth (0.2 μ m, Sartorius, Germany) by 1D 1H-NMR on a Bruker Ascend 800 MHzspectrom-eter equipped with a 5 mm QCI cryoprobe (Bruker, Germany), as detailed previously35.
Intracellular metabolome analysis.
Intracellular metabolites were extracted from cells exponentially-growing on glucose (without acetate initially present in the medium) using the differential sam-pling method. Adenine nucleotides (ATP and ADP) were measured by LC-MS and quantified using the Isotope Dilution Mass Spectrometry approach36. Absolute intracellular concentrations of ADP and ATP were calculatedassuming a cytosolic volume of 1.77 × 10⁻³ L/g DW37.
For isotopic analyses, samples (500 μ L) of culture broth were collected in 3 mL of quenching solution (20% H2O/40% methanol/40% acetonitrile) maintained at − 20 °C38. Cellular extracts were dried, suspended in 200 μ L
water, and analyzed by mass spectrometry as described previously39. The 13C contents of intracellular metabolites
were quantified from their isotopic patterns after correction for naturally abundant isotopes using the IsoCor soft-ware40. Statistical differences in labeling incorporation between the glucose consumption phase and the acetate
= − ⋅ ⋅ dt0 qS Glc X0 (2) = − ⋅ ⋅ dGlc dt1 qS Glc X1 (3) = ⋅ ⋅ − ⋅ ⋅ dAce dt 0 v3 AcCoA0 X v4 Ace X0 (4) = ⋅ ⋅ − ⋅ ⋅ dAce dt1 v3 AcCoA X1 v4 Ace X1 (5) = ⋅ ⋅ ⋅ + ⋅ ⋅ − + ⋅ ⋅ + µ ⋅ dAcCoA
dt 0 2 v1 Glc X0 v4 Ace X0 ( 3v v2) AcCoA0 X AcCoA0 (6)
= ⋅ ⋅ + ⋅ − + ⋅ + µ ⋅
dAcCoA
dt 1 2 v1 Glc X1 v4 Ace X1 ( 3v v2) AcCoA X1 AcCoA1 (7) where the subscript 0 represents the unlabeled metabolite and 1 represents the 13C-metabolite.
Glc , Glc , Ace , Ace , AcCoA , and AcCoA0 1 0 1 0 1 represent the abundances of the corresponding isotopic species
relative to the total metabolite pool.
The system of ODEs defined by Eqs 1–7 was implemented in Fortran, and simulations were performed using the lsoda function of the deSolve package of R (v2.15, www.r-project.org), as detailed previously41. Free
parameters (fluxes: μ, qS, v3, v4; and initial concentrations: Glc0, Glc1, Ace0, Ace1) were estimated using the nlsic
algorithm developed by Sokol et al.42, by fitting the time-course concentrations of biomass, labeled glucose, and
labeled and unlabeled acetate. Sensitivity analyses were carried out using the Monte-Carlo method (with 1,000 iterations). The relative standard deviations on the estimated parameters were below 10%. The scripts used to per-form 13C-flux calculations are distributed in Supplementary Information under an open source license to ensure
reproducibility and reusability.
Statistical differences in fluxes between the wild-type and mutant strains were calculated using Student’s paired t-tests with two tailed distributions.
In silico analyses of the Pta-AckA pathway.
Gibbs energy of the Pta-AckA pathway (ΔGPta-AckA) was calculated for a wide range of acetate levels (10 μ M to 100 mM) using the following equation:∆GPta AckA− = ∆GPta AckA0 − +R T⋅ ⋅ lnΠ (8)
with
Π = ⋅ ⋅
⋅ ⋅
ATP CoA Ace
AcCoA ADP P (9)
and
∆GPta AckA0 − = − ⋅R T⋅ ln
(
KeqPta⋅KeqAckA)
(10)where R is the universal gas constant (R = 8.3143 J.K–1.mol–1), T is the temperature (T = 310 K), Π is the mass
action ratio (calculated from reactant concentrations, eq. 9), and Keq is the equilibrium constant of the reaction (KeqAckA = 174 and KeqPta = 0.0281)43. Reactant concentrations were fixed at the values measured in this study
(ATP = 2.4 ± 0.5 mM, ADP = 0.61 ± 0.18 mM) or elsewhere (P = 10 mM; CoA = 1.22 mM; AcCoA = 0.61 mM)44.
To investigate the impact of changes of acetate concentration on the flux through the Pta-AckA pathway, a kinetic model of this pathway was constructed. Rate laws and parameter values were taken from the literature43,
8. Abdel-Hamid, A. M., Attwood, M. M. & Guest, J. R. Pyruvate oxidase contributes to the aerobic growth efficiency of Escherichia coli. Microbiol. Read. Engl. 147, 1483–1498 (2001).
9. Chang, Y. Y., Wang, A. Y. & Cronan, J. E. Expression of Escherichia coli pyruvate oxidase (PoxB) depends on the sigma factor encoded by the rpoS(katF) gene. Mol. Microbiol. 11, 1019–1028 (1994).
10. Kakuda, H., Hosono, K., Shiroishi, K. & Ichihara, S. Identification and characterization of the ackA (acetate kinase A)-pta (phosphotransacetylase) operon and complementation analysis of acetate utilization by an ackA-pta deletion mutant of Escherichia coli. J. Biochem. (Tokyo) 116, 916–922 (1994).
11. Kumari, S. et al. Regulation of acetyl coenzyme A synthetase in Escherichia coli. J. Bacteriol. 182, 4173–4179 (2000).
12. Kumari, S., Tishel, R., Eisenbach, M. & Wolfe, A. J. Cloning, characterization, and functional expression of acs, the gene which encodes acetyl coenzyme A synthetase in Escherichia coli. J. Bacteriol. 177, 2878–2886 (1995).
13. Flores, N. et al. Adaptation for fast growth on glucose by differential expression of central carbon metabolism and gal regulon genes in an Escherichia coli strain lacking the phosphoenolpyruvate:carbohydrate phosphotransferase system. Metab. Eng. 7, 70–87 (2005). 14. Castaño-Cerezo, S., Bernal, V., Röhrig, T., Termeer, S. & Cánovas, M. Regulation of acetate metabolism in Escherichia coli BL21 by
protein N(ε )-lysine acetylation. Appl. Microbiol. Biotechnol. 99, 3533–3545 (2015).
15. Valgepea, K., Adamberg, K. & Vilu, R. Decrease of energy spilling in Escherichia coli continuous cultures with rising specific growth rate and carbon wasting. BMC Syst. Biol. 5, 106 (2011).
16. Renilla, S. et al. Acetate scavenging activity in Escherichia coli: interplay of acetyl–CoA synthetase and the PEP–glyoxylate cycle in chemostat cultures. Appl. Microbiol. Biotechnol. 93, 2109–2124 (2012).
17. Valgepea, K. et al. Systems biology approach reveals that overflow metabolism of acetate in Escherichia coli is triggered by carbon catabolite repression of acetyl-CoA synthetase. BMC Syst. Biol. 4, 166 (2010).
18. Kotte, O., Volkmer, B., Radzikowski, J. L. & Heinemann, M. Phenotypic bistability in Escherichia coli’s central carbon metabolism. Mol. Syst. Biol. 10, 736 (2014).
19. Orth, J. D. et al. A comprehensive genome-scale reconstruction of Escherichia coli metabolism—2011. Mol. Syst. Biol. 7, 535 (2011). 20. Xu, B., Jahic, M. & Enfors, S.-O. Modeling of overflow metabolism in batch and fed-batch cultures of Escherichia coli. Biotechnol.
Prog. 15, 81–90 (1999).
21. Phue, J.-N., Lee, S. J., Kaufman, J. B., Negrete, A. & Shiloach, J. Acetate accumulation through alternative metabolic pathways in ackA. Biotechnol. Lett. 32, 1897–1903 (2010).
22. Weinert, B. T. et al. Acetyl-phosphate is a critical determinant of lysine acetylation in E. coli. Mol. Cell 51, 265–272 (2013). 23. Kuhn, M. L. et al. Structural, kinetic and proteomic characterization of acetyl phosphate-dependent bacterial protein acetylation.
PLoS One 9, e94816 (2014).
24. Prüss, B. M. & Wolfe, A. J. Regulation of acetyl phosphate synthesis and degradation, and the control of flagellar expression in Escherichia coli. Mol. Microbiol. 12, 973–984 (1994).
25. Klein, A. H., Shulla, A., Reimann, S. A., Keating, D. H. & Wolfe, A. J. The intracellular concentration of acetyl phosphate in Escherichia coli is sufficient for direct phosphorylation of two-component response regulators. J. Bacteriol. 189, 5574–5581 (2007). 26. McCleary, W. R. & Stock, J. B. Acetyl phosphate and the activation of two-component response regulators. J. Biol. Chem. 269,
31567–31572 (1994).
27. el-Mansi, E. M. & Holms, W. H. Control of carbon flux to acetate excretion during growth of Escherichia coli in batch and continuous cultures. J. Gen. Microbiol. 135, 2875–2883 (1989).
28. Warnecke, T. & Gill, R. T. Organic acid toxicity, tolerance, and production in Escherichia coli biorefining applications. Microb. Cell Factories 4, 25 (2005).
29. Argenzio, R. A., Southworth, M. & Stevens, C. E. Sites of organic acid production and absorption in the equine gastrointestinal tract. Am. J. Physiol. 226, 1043–1050 (1974).
30. Cummings, J. H. & Englyst, H. N. Fermentation in the human large intestine and the available substrates. Am. J. Clin. Nutr. 45, 1243–1255 (1987).
31. Macfarlane, G. T., Gibson, G. R. & Cummings, J. H. Comparison of fermentation reactions in different regions of the human colon. J. Appl. Bacteriol. 72, 57–64 (1992).
32. Fabich, A. J. et al. Comparison of carbon nutrition for pathogenic and commensal Escherichia coli strains in the mouse intestine. Infect. Immun. 76, 1143–1152 (2008).
33. Baba, T. et al. Construction of Escherichia coli K-12 in-frame, single-gene knockout mutants: the Keio collection. Mol. Syst. Biol. 2, 2006.0008 (2006).
34. Nicolas, C. et al. Response of the central metabolism of Escherichia coli to modified expression of the gene encoding the glucose-6-phosphate dehydrogenase. FEBS Lett. 581, 3771–3776 (2007).
35. Enjalbert, B., Letisse, F. & Portais, J.-C. Physiological and molecular timing of the glucose to acetate transition in Escherichia coli. Metabolites 3, 820–837 (2013).
36. Millard, P., Massou, S., Wittmann, C., Portais, J.-C. & Létisse, F. Sampling of intracellular metabolites for stationary and non-stationary 13C-metabolic flux analysis in Escherichia coli. Anal. Biochem. 465, 38–49 (2014).
37. Chassagnole, C., Noisommit-Rizzi, N., Schmid, J. W., Mauch, K. & Reuss, M. Dynamic modeling of the central carbon metabolism of Escherichia coli. Biotechnol. Bioeng. 79, 53–73 (2002).
38. Rabinowitz, J. D. & Kimball, E. Acidic acetonitrile for cellular metabolome extraction from Escherichia coli. Anal. Chem. 79, 6167–6173 (2007).
We thank MetaToul (Metabolomics & Fluxomics facilities, Toulouse, France, http://www.metatoul.fr), which is part of the national infrastructure MetaboHUB-ANR-11-INBS-0010 (The French National Infrastructure for Metabolomics and Fluxomics, www.metabohub.fr), for access to NMR and MS facilities. The support of Lindsay Peyriga, Edern Cahoreau and Matthieu Guionnet is gratefully acknowledged. B.E. received the support of the INRA (Institut National de la Recherche Agronomique), the INSA (Institut National des Sciences Appliquées) [program ”Chaire d’excellence”], and the French Agence Nationale de la Recherche (ANR, Project n° ANR-06-BYOS-0003-03). P.M. received the support of the INRA [program CJS] and of the EU in the framework of the Marie-Curie FP7 COFUND People Program, through the award of an AgreenSkills’ fellowship (under grant agreement n° 267196).
Author Contributions
B.E., P.M., M.D., J.C.P. and F.L. conceived and designed the study. B.E., M.D. and P.M. performed the experiments. P.M. developed the models. B.E., P.M., M.D., J.C.P. and F.L. contributed to data analysis and interpretation. B.E. wrote the initial version of the manuscript. B.E., P.M., M.D., J.C.P. and F.L. contributed to writing and have read and approved the manuscript.
Additional Information
Supplementary information accompanies this paper at http://www.nature.com/srep Competing financial interests: The authors declare no competing financial interests.
How to cite this article: Enjalbert, B. et al. Acetate fluxes in Escherichia coli are determined by the
thermodynamic control of the Pta-AckA pathway. Sci. Rep. 7, 42135; doi: 10.1038/srep42135 (2017).
Publisher's note: Springer Nature remains neutral with regard to jurisdictional claims in published maps and
institutional affiliations.
This work is licensed under a Creative Commons Attribution 4.0 International License. The images or other third party material in this article are included in the article’s Creative Commons license, unless indicated otherwise in the credit line; if the material is not included under the Creative Commons license, users will need to obtain permission from the license holder to reproduce the material. To view a copy of this license, visit http://creativecommons.org/licenses/by/4.0/