Publisher’s version / Version de l'éditeur:
Canadian Geotechnical Journal, 9, 2, pp. 127-136, 1972-10-01
READ THESE TERMS AND CONDITIONS CAREFULLY BEFORE USING THIS WEBSITE.
https://nrc-publications.canada.ca/eng/copyright
Vous avez des questions? Nous pouvons vous aider. Pour communiquer directement avec un auteur, consultez la
première page de la revue dans laquelle son article a été publié afin de trouver ses coordonnées. Si vous n’arrivez pas à les repérer, communiquez avec nous à PublicationsArchive-ArchivesPublications@nrc-cnrc.gc.ca.
Questions? Contact the NRC Publications Archive team at
PublicationsArchive-ArchivesPublications@nrc-cnrc.gc.ca. If you wish to email the authors directly, please see the first page of the publication for their contact information.
NRC Publications Archive
Archives des publications du CNRC
This publication could be one of several versions: author’s original, accepted manuscript or the publisher’s version. / La version de cette publication peut être l’une des suivantes : la version prépublication de l’auteur, la version acceptée du manuscrit ou la version de l’éditeur.
Access and use of this website and the material on it are subject to the Terms and Conditions set forth at
Downdrag measurements on a 160-ft floating pipe test pile in marine
clay
Bozozuk, M.
https://publications-cnrc.canada.ca/fra/droits
L’accès à ce site Web et l’utilisation de son contenu sont assujettis aux conditions présentées dans le site LISEZ CES CONDITIONS ATTENTIVEMENT AVANT D’UTILISER CE SITE WEB.
NRC Publications Record / Notice d'Archives des publications de CNRC:
https://nrc-publications.canada.ca/eng/view/object/?id=202e3326-292a-431c-909c-a2cc55aba0a7 https://publications-cnrc.canada.ca/fra/voir/objet/?id=202e3326-292a-431c-909c-a2cc55aba0a7
Downdrag Measurements on a 160-Ft Floating Pipe
Test Pile in Marine Clay'
M. Bozozu~.r
Geofeclctricnl Section, Divisiorc of Bliilr/icig Resenrclc, Nutiorin/ Resenrclr Corrtrcil of Cntrnc/n, Ottawn, Cntrarlrr. KIA OR6
Received September 10, 197 1 Accepted December 23, 1971
Large negative skin friction loads were observed on a 160ft (49 m) steel pipe test pile floating in marine clay. The test pile was driven, open-ended, on the centerline of a 30 ft (9 m) high granular approach fill on the Quebec Autoroute near Berthierville. Since the installation was made in 1966 the fill has settled 21 in. (53 cm), dragging the pile down with it. Negative skin friction acting along the upper surface of the pile was resisted by positive skin friction acting along the lower end as it penetrated the underlying clay. Under these conditions the pile con~pressed about :in. (2 cm). Analysis of the axial strains indicated that a peak compressive load of 140 t developed at the in- flection point between negative and positive skin friction 73 f t (22111) below the top of the pile. Negative and positive skin friction acting on the upper surface of the pile exceeded the 01 sit11 shear strength and approached the drained strength of the soil where excess pore water pressures had dissipated. At the lower end where the positive excess pore pressures were high and relative move- ment between the pile and the soil was large, the positive skin friction approached the remoulded strength a s measured with the field vane. Skin friction was increasing, however, as positive escess pore pressures dissipated.
This paper shows that skin friction loads are related LO the combination of (a) in sit11 horizontal effective stresses, (b) horizontal stresses due t o embankment loads, and (c) horizontal stresses due to differential settlement of the fill.
On a observe des charges negatives considerable~ de frottement superficielle sur un p i e ~ tubulaire d'essai de 160 pi (49 m) flottant dans I'argile marine. On a enfonce le pieu d'essai, avec section ouverte. dans la ligne centrale d'un remblai d'approche de 30 pi (9 rn) de hauteur sur I'autoroute de Quebec pres de Berthierville. Depuis qu'on a effectuecette ~ n i s e en place en 1966 le re~nblai s'est tasse cie 21 po (53 crn), entrainant le pieu dans sa descente. La friction negative superficielle agissant 5 la partie suptrieure du pieu s'est opposte <I la friction positive sur le bout inferieur durant son enfoncement. Sous ces conditions le pieu s'est compresse d'g peu pres 2. po (2 cni). L'analyse de la contrainte axiale a indique qu'une charge ultinle cie compression de 140 t s'est developpee au point d'inflection entre le frotternent superficiel ntgatif et positif a 73 pi (22 nl) plus bas que la partie s ~ ~ p e r i e ~ ~ i - e du pieu. Le frottement superficiel positif et ntgatif agissant sur la surface s~lperieure ciu pieu exceda In resistance au cisaillement en place et approcha la resistance drainee du sol ou les excks sur la pression de I'eau interstitielle s'etaient dissipts. A la partie inferieure ou I'exces sur la pression de l'eau interstitielle posi- tif etait Clevees et le mouvement relatif entre le pie^^ et le sol etait important, le frottement superficiel positif s'approchait A la resistance renianiee telle que mesuree avec le scissometre sur place. Le frotte- lnent superficiel augmentait, cependant,
a
mesure que les exces sur la pression de l ' e a ~ ~ interstitielle positif se dissipaient.La presente communication montre le rapport des charges de frottement s~~perficiel avec la con]- binaison (a) des efforts horizontaux effectifs en place, (b) des efforts horizontaux dus nux charges du remblai et enfin (c) des efforts horizonta~lx dus au tassement differentiel du remblai.
'Paper presented at the Canadian Soils Conference, Halifax, Nova Scotia, September, 1971.
128 ('.\NADIAN GEOTECHNIC
The limited access, high speed Quebec Autoroute traverses deep deposits of com- pressible marine clay along the north shore of the St. Lawrence River between Montreal and Quebec City. At Berthierville. where bedrock is at a depth of 270 ft (82 m), a rail- way overhead and a highway overpass are separated by a 30-ft (9 m) high granular embankment with stabilizing berms. The estimated settlement under this fill is about 10 ft (3 m). The highway overpass is supported on end-bearing piles which are subjected to a substantial load from negative skin friction. Field measurements on the magnitude and distribution of negative skin friction load on two of the centerline piles have been reported elsewhere (Bozozuk and Labrecque 1968; Bozozu k 1970).
In addition, a 12 in. ( 3 0 c m ) diameter hollow steel pipe pile 160 ft (49 m) long was instrumented and driven vertically on the centerline of the fill into the underlying clay. The upper part was subjected to negative skin friction as the soil settled and the lower part to positive skin friction as the pile penetrated the underlying clay.
The magnitude and distribution of skin fric- tion loads generated in the floating pile over a period of 5 years are reported and compared with ~ r e d i c t e d values based on in situ liori- zontal ellfective stresses and the influence of embankment loading. The ~ l n i t skin fric- tion exerted along the surface of the pile was determined from the load distribution curve and compared with the strength of the ~111.- rounding soil.
Description of Test Site Soil5
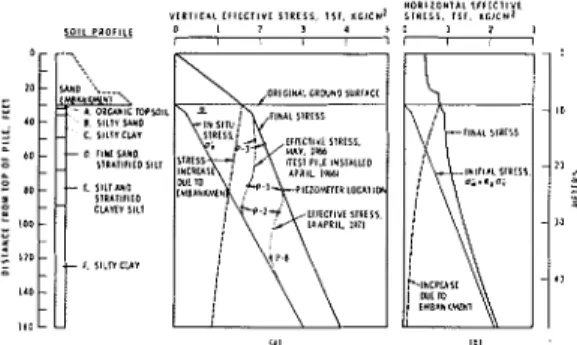
The subsoils are marine deposits of the ancient Champlain Sea (Karrow 1961). The profile shown in Fig. I is made up of a shallow organic topsoil (A), followed by layers of silty sand (B), silty clay (C), fine sand and stratified silt (D). and silt and stratified clayey silt ( E ) to a depth of 59 ft (18 m). These layers rest upon a thick silty clay layer (F), which extends to 240 ft (73 m) and is underlain by a further 30 ft (9 m) oC fine sand overlying bedrock at 270ft (82 m).
In the upper 59 ft (18 m) the liquid limits of the cohesive soils are equal to or less than
the in sit11 water contents. which vary from
28 to 60C,';. The soils are overconsolidated by about 0 . 3 tsf (kg/cm2) and have a shear strength between 300 and 1200 psf (0.15 to 0 . 5 9 kg/cm?) as measured by a field vane. In layer F the water contents vary from 35 to 60:;; the soil is overconsolidated by 0 . 8 tsf (kglcm2); and shear strength varies from 1200 to more than 1800 psf (0.59 to 0.88 kg/cm2) at a depth of 110 ft (34 m). The engineering properties of these soils have been described in detail (Bozozuk and Labrecque
1968).
Enlbanktnent
The interconnecting fill between the railway overhead and the highway overpass is 30 ft (9 m) high, 90 ft (27 m) wide, about 400 ft (122 m) long with side slopes of 2:1, and is stabilized with 7ft (2 m) high berms 300 ft (92 m) wide from toe to toe. The fill was constructed in two stages. The berms and 15 ft (5.6 m) of embankment were first left in place for about 6 months, during which time they settled about 3 ft (I m) (Bozozuk and Labrecque 1968, see Fig. 5). In the second stage the embankment was con- structed to a height about 4 ft above finished grade. From October 1964 to May 1966, when the steel pipe pile was installed, the total settlement amounted to about 5 4 f t ( 1 . 7 m).
Vertical and horizontal stresses exerted on the foundation clay under the centerline of the embankment were determined, assuming plane strain conditions and using the linear elastic theory proposed by Baladi (1967) and Perloff et 01. (1967). In situ stresses, load increments due to the fill and final vertical and horizontal effective stresses used
in the analysis are shown in Fig. I.
Instrumentation Test Pi/(>
The test pile was a 12 i n . (30 cm) diameter
( i
i n . ( 6 . 4 mm) thick wall) circular steel pipe driven vertically on the centerline of the granular embankment to a depth of 160ft (49 m) below the top of the fill. It was as- sembled in five sections, with individual sections butt welded together. Two transits set 90" apart were ~ ~ s e d to align the pile vertically prior to welding and driving. AfterFIG. 1 . Distribution of vertical and horizontal effec- tive stresses under centerline of embankment.
each section had been driven, the pile was cleaned for its full length, resulting in a vertical, clean open-ended pile with its lower end 130 ft (40 m) below the original surface of the ground.
Eight deformation gauges (Bozozuk and Jarrett 1967) were spaced at 45' intervals around the outside of the pile, their lengths selected to provide measurements of axial deformation over 20 ft (6 m) intervals. Pairs of gauges were mounted in casings of equal length positioned diagonally opposite each other to maintain axial symmetry. In one casing the reference inner rod extended for the full length of the casing; in the other, the rod terminated at an intermediate plug located 20 ft (6 m) from the bottom end.
The gauge casings. of $ in. (1.9 cm) diameter iron pipe, were mounted on each section of the pile before it was driven. They were carefully aligned along the long axis, then welded to the pile for the full length of the gauge. During driving the casings were joined with machined sleeves and welded in place. After the pile had been driven the casings were filled with light oil and inner rods o f t in. (0.6 cm) diameter iron pipe were install- ed. Special brass fittings mounted on the top of each deformation gauge permitted measure- ment of relative movements to & 0.0001 in.
(& 0.0025 mm), using a micrometer and a dial gauge.
As the casings were welded continuously to the outside of the test pile, they became an integral part of it. Their presence increased the contact area with the soil and increased the cross-sectional area of steel, which varied with depth as shown in Table 1.
TABLE 1. with the
Physical dimensions of steel pipc test pile* deformation gauges attached by continuous
welding on thc oustide
Perimeter of Location Total cross-sectional section in along pile, area of steel contact with soil
feet square inches feet
'Test pile. 12-in. (30 cm) dinmetcr a n d 160 i t ( 4 9 m) long, in- stnllcd t o depth of I30 f t (40 ~ n ) I~elow t h r orixinnl xrouncl snriacc. fnstt~un.~entcrtion of' Soil
Observations on the behavior of the foundation soil under the embankment were made with settlement gauges and Geonor piezometers installed at the locations described by Bozozuk and Jarrett (1967). Four piezo- meters provided measurements of excess pore water pressures from 20 to 87 ft (6 to 27 m) below the original ground surface. Six settlement gauges and a deep bench- mark provided measurements of vertical settlements from the ground surface to a depth of 145 ft (44 m) adjacent to the test installa- tion.
Estimate of Skin Friction
Studies by Johannessen and Bjerrum (1965) suggest that negative skin friction is related to vertical effective stress through the follow- ing equation: r, = o',, K tan
@':,
whereo', is the vertical effective stress and K tan
a',
is the adhesion factor relating o',, to skin friction. This relation holds if the surcharge causing consolidation is uniform and of infinite areal extent, in which case the final vertical effective stress varies linearly with depth. For a highway embankment or earth dam supported on compressible clay, the vertical stress increases linearly with depth to the base of the fill, then decreases non- linearly with depth from the base of the fill. For the latter case the observed negative skin friction loads in piles do not correlate well with the vertical effective stress.Skin friction can be related to the horizontal effective stress acting on the pile. For a surcharge that is uniform and has an infinite area, the horizontal stress would vary linearly
with depth and would be related directly to the vertical effective stress. For the highway embankment the total horizontal stresses would consist or (a) the in situ horizontal stress: (b) the horizontal stress due to the embankment loading, (c) the horizontal stresses generated at The top of the fill owing to differential settlement as shown schemat- ically in Figure 2. (d) the horizontal forces due to displacement of soil caused by driving displacement type piles. The latter forces can be neglected for non-displacement type piles. Skin Friction Looll.~ Due to In Situ Hoi.izontnl
Efective Stress
Consider a non-displacement type circular pile driven a depth, L, into a uniform isotropic clay deposit with the groundwater table at the surface. The soil is subiected to a small. uniform vertical pressure,
(I,
of infinite areal extent that causes consolidation of the underlying clay. If the pile is floating, the consolidating clay imposes negative skin friction loads on the upper part of the pile that are resisted by positive skin friction at the lower end. Assuming that the pile is incom~ressible in relation to the soil and that t i e skin friction is related to the hori- zontal effective earth pressure acting on the pile, then the unit skin friction is given by [ l a ] F = M . KO c',, tan (1,'where
cD' = effective friction angle of the soil
c', = vertical effective stress
KO = coefficient relating horizontal to vert- ical effective stress
M = friction factor for the soil acting on
the pile surface, where 0
<
M<
1Except for the friction factor, M , this equation, is similar to that proposed by Johannessen and Bjerrum (1965).
At the end of consolidation the unit skin friction can be obtained from
[ l b ] F = M . KO y: Z tan @' where
Z = depth below the ground surface
y: = submerged unit weight of the soil For a pile of circumference, C, the increment of load due to skin friction will be given by
C O M P R E S S I O N
F l y ---:.--
I . .
. . J .,., - - - - ; - - - -
FIG. 2. Generation of horizontal stresses under centerline of embankment on compressible clay. The total negative skin friction load to depth,
D, will therefore be
[3a1 P,,,, =
({
M.KO y: tan @' C Zd: which can be simplified to!)
l3b1 P,,,, =
p , ~
z d z0 Integrating
[3cI ',leg = PIC 0'12
where
[3dl
p,
= M K, y i tana'
The above load will be resisted by positive friction generated in the pile from D t o L. Hence L Pal " =
c
(.
Z d zfi
or [4bI P,,, = p2C ( L 2 - D 2 ) / 2Assuming that the pile carries no load in end bearing, then for equilibrium conditions
Pneg = Ppos Hence [5a] plC D2i2 = PZC (L2 - D 2 ) / 2 l f 81 = Or then [2] (/I) = M K , yf Z tan 0' Cdz [5bl D = ~ ! d 2
ROZOZUK: DOWNDR
which is the location of the neutral point between negative a n d positive skin friction loads for the above soil conditions.
T h e effect of varying the soil constants o n the location of the neutral point can be investigated by solving equation [5a] for various ratios of p,,, t o ppos. F o r p ,,,, = 3Bp0,, the neutral point occurs at L12, for
B,,,
= (+)pp0, at ~ ' 5 ~ 1 2 . Fig. 3 gives load distribution curves for these examples a n d the location of the neutral point for various ratios of pnc,. t o p,,,.
If, for example, a dense sand layer e x ~ s t s near the surface of the ground s o thatfine,
is large, the neutral point will develop close t o the ground surface. If, how- ever, the lower end of the pile penetrates a dense sand layer in which ppos is large, then the neutral point will shift to the bottom of the pile.T O estimate the skin friction loads generated in the test pile, values for @', KO, a n d M must
be known. Onry a limited number of soil tests were available giving the effective friction angle 4)' of the soil. These are summarized in
Table 2. KO was not measured. I n most nor- mally consolidated clays it can be estimated from KO = I-sin cI,' (Jaky 1948). F o r overcon- solidated clays, however. this relation gives values that a r e t o o low. A value of KO = 0 . 7 was assumed for the complete soil profile. This value agrees with field measurements made in overconsolidated marine clay by Eden a n d Bozozuk (19691.
Potyondy (1961) found a relation for skin friction between various soils a n d construction materials, here defined as M. His coefficients varied from 0 . 6 for clay o n steel t o 0 . 7 for silt o n steel t o over 0 . 8 for saturated sand on steel. Because o f the nature of the soils a t the site a value of M = 0 . 7 was selected for the soil profile.
Using the dimensions in Table 1 a n d the above coefficients the load distribution was determined and plotted in Fig. 4(a). T h e maximum load was 70 t, occurring at a depth of about 86 ft (26 m) below the original ground surface.
Skin Friction Loncls Due to Ho~.izontnl Stresses Generated Dv the EtnDnnkment
Following ;he outlined procedure the in- crement of skin friction load under the centerline of the fill resulting from horizontal stresses will be given by:
16a] A P = M tan (I)'. C. AL. Ao, where (Dl, M, C are as defined previously
AL = increment of length of pile under
,,,,, 2 .- consideration
Ao, = average horizontal effective stress
Frci. 3. Ratio: Pncg/Bpol; versus the location of neutral
point along floating pile subject to negative and positive d u e to the embankment load skin friction loads due only to it1 situ stresses. actins o n AL.
TABLE 2. Friction angles applied to the various soil formations around thc steel pipe test pile
~
~ ~
CIU test results
Depth, +', [I" used in study
feet degrees Source of information Soil formation degrees .. . Sand f i l l 45 (assumed) 8-1 1 27 NRC, 154-24-1 to 8 10-1 1 3 1 Consultant's report:' 11-12 27.5 Consultant'sreport" B, C, D, E 28.25 50-53 28 NRC, 154-28-3 to 9 70-73
--
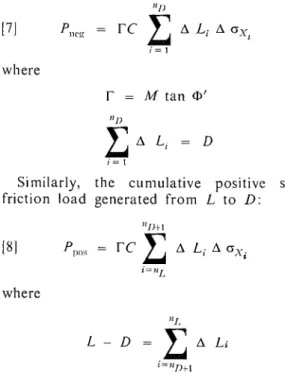
77 NRC, 154-30-2. to 8 F 23.5 90-93 25 NRC, 154-32-3 to 8 -FIG. 4. Determination of skin friction load in 12-in. (30 cm) diameter steel pipe pile floating in marine clay. The cumulative negative skin friction load to the neutral point, a distance D from the top of the pile, will be:
where
r
= M tan @'Similarly, the cunlulative positive skin friction load generated from L to D :
where
L - D = A ~i '=71n+,
Assuming @' = 45" and M = 0.85 for the sand f i l l and using the horizontal stresses due to the embankment shown in Fig. l(b), the negative and positive skin friction loads were determined and plotted in Fig. 4(b). By projecting the positive friction load curve from the bottom of the pile to intersect the negative friction load curve from the top, a peak load of 65 t is obtained about 28 ft (8 m) from the top of the pile.
T o obtain the total load generated in the floating test pile, the load distributions in
Fig. 4(a) and 4(b) were added to give the cumulative load distribution shown in Fig. 4(c). This gives a peak load of 135 t, occurring 75 ft (23 m) from the top of the pile. The load distribution curve in Fig. 4(c) can also be determined directly from the total horizontal effective stresses acting on the pile shown in Fig. l(b) and applying equations [7] and [8]. Skin Friction Londs Due to Horisontnl Stresses
Crruserl Iy Diferentinl Settlement of' the Etiihnnlcment
An embankment constructed upon a com- pressible clay subsoil will settle differentially, with the minimum occurring at the toe and increasing to a maximum under the center- line. "Bending" will induce compressive stresses near the top of the f i l l and this will be superimposed on the existing horizontal stresses, as illustrated in Fig. 2. The addi- tional horizontal stresses would increase the negative skin friction loads at the top of the pile, as suggested by the shaded area in Fig. 4(c).
A field study is currently under way to measure horizontal stresses. A 14 ft (4 m) high granular highway embankment con- structed on marine clay has been instrumented with earth pressure cells distributed vertically down the centerline and along the base of the fill. Preliminary observations indicate that the horizontal stresses are increasing at the top and decreasing at the bottom as the f i l l settles. Maximum liorizontal pressures developed, liowever, at one third of the dis- tance from the top of the fill.
Field Measurements
Settlen~ents nnrl Pore Water Pressures Vertical settlements under the centerline of the f i l l measured over the five years since the test pile was installed i n April 1966 are summarized in Fig. 5. During this time the ground surface settled 1.77 ft (54 cm) or about 25''; of the total since the fill was constructed. Most of this was due to conso- lidation of the upper 60 ft (18 m ) of the soil profile, although the amount was not measur- ed because the settlement gauge had been damaged shortly after it was installed. The settlement was 0 . 1 5 ft ( 4 . 6 cm) at 100 ft (30 m). reducing t o 0 . 0 6 ft ( 1 . 8 cm) at 145 ft
HOZOZUK: DOWNDR
N
, s . l o ! ~ s n . a h 1 1 .. - -\ s - I I I ~ ~ . am! 3 I I I I I I I I966 1961 I 9 6 8 1969 1910 1911 FIG. 5. Measured settlement under centerline of embankment since installation of steel.pipe test pile.u
0 I 0 I 0 ,I I 0
" l l f . 5
F ~ G . 6. Pile compressions. and pore water pressures at steel
relative soil movements pipe test pile after 5 years. (44 m), which was relatively sinall compared with that of the ground surface.
As the piezometers were installed about a year after the fill was completed, a consider- able amount of the excess pore pressure had dissipated. The effective stresses at that time are shown in Fig. l(a). After 5 years (April 1971) the excess pore pressures had completely dissipated to a depth of 50 ft (15 m), but they were still quite large at 90 ft (27 m), as shown in Fig. 6(a). The change in the vertical effective stress over this period is shown in Fig. ](a).
Test Pile
Measurements on the top of the test pile show that it had settled 1.54 ft (47 cm) compared with the 1 .77 ft (54 cm) the original ground surface had settled over the same period. The relative movements of the pile compared with those of the surrounding soil are plotted in Fig. 6(b). In the upper part of the profile where the excess pore pressures had dissipated relative movements were quite small, reducing to zero at a depth of about 50 ft (15 m) below the ground surface. Below 70 ft (21 m), where the excess pore pressures were high, relative movements were very
large, increasing to 1 . 4 ft (43 cm) at the bot- tom of the pile.
Compressions measured with the deforma- tion gauges showed that the pile had com- pressed axially 0 . 6 4 in. ( 1 . 6 cm) in 5 years, distributed as indicated in Fig. 6(c). For the most part it occurred within the embankment and the top 5 0 f t (15 m) of the soil profile, indicating a rapid build-up of load in this part of the pile. Compressions were small below this depth, especially in the silty clay (F) layer where the excess pore water pressures and the relative movements were large.
Load Distribution in Test Pile
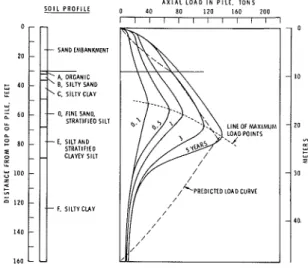
Distribution of axial load at various times over the 5 year period is plotted in Fig. 7,
sing measured compressions and assuming that the modulus of elasticity of the steel was 30
x
1 0 9 . s . i . (2.11x
10' kglcmz). The pile started to accumulate skin friction loads almost immediately. After about 1 month, the peak load was 38 t, 68 t after year, 86 t after 1 year, and 140 t after 5 years. A line drawn through the maximum load points shows that the neutral point shifted down- ward. If skin friction is related t o effective stress, this can be expected t o occur because the excess pore water pressures dissipate to greater depths with time. After 5 years the peak load of 140 t occurs 73 ft (22 m) below the top of the pile where excess pore water pressures have completely dissipated. It also occurs at a point where there is little or no relative movement between the pile and the surrounding soil.At the top of the pile, but within the embankment. the early development of the knee in the curves indicates a rapid build-up of load due to negativi skin friction. This is possible if skin friction is related to the horizontal stresses within the fill and to the horizontal stresses generated by differential settlement, but not if related only to the vertical effective stress.
Negative skin friction loads generated in the upper part of the pile are dissipated through positive skin friction below the neutral points delineated by the line drawn through the maximum load points. The shape of the curves below the neutral points indicates a rapid transfer of load to the soil
134 C \N.\DI.\N GEOTECHNICAL JOURN \L. VOL. 9 , l O i l t o a depth of about 70 ft (21 m) below the
ground surface. In this zone relative move- ments between the ~ i l e and the soil are small and most of the excess pore water pressures have dissipated. Below this depth, where the rate of load transfer is small, the excess pore water pressures are high and the relative movement between the pile and the soil exceeds 1 ft (30 cm).
At the bottom of the pile, an end-bearing load of about 11 t is indicated. It compares well with the theoretical value of 10.7 t predicted by Meyerhof (1953) :
o
= (S,, Nc+
rD) A-
where
Nc = 9 , bearing capacity factor for deep
foundations
S,, is the undrained strength of the soil yD is the overburden pressure at depth D A is the end area of the pile.
This is unexpected since the bottom end is open and should allow the underlying soil to enter the pile.
Fig. 7 compares the predicted with the observed distribution of load in the test pile.
neglects the effects of skin friction due to differential settlement of the fill. Consequently, the shape of this part of the curve should differ from that of the observed curve. Below the fill, predicted loading agrees well with that observed at 5 years; the curves are parallel for the most part, up to the neutral point. Below the neutral point there is a marked difference in shape of the curves. Because this is the region of high excess pore water pres- sures and of high relative movements, the soil may be in a partially renioulded condi- tion, especially for the bottom 50 ft (15 m) of the pile. If this is the case, the values as- sumed for the coefficients M and KO are too great. From 75 to 100 ft (23 to 30 m) from &e top of the pile tlie loads were dissipated in positive skin friction at a greater rate than was predicted, indicating that the values assumed for M and
a)'
were too small. It must be remembered, however, that the predictions are based on the condition that consolidation has been con~pleted. As this condition is approached, the fanlily of positive skin friction curves will fan out and approach the predicted curve.The good agreement between the predi'cted
load of 135 t occurring 75 ft (23 m) from the Coniparison of Skin Friction top of the ~ i l e with the measured 140 t at with Soil Strength
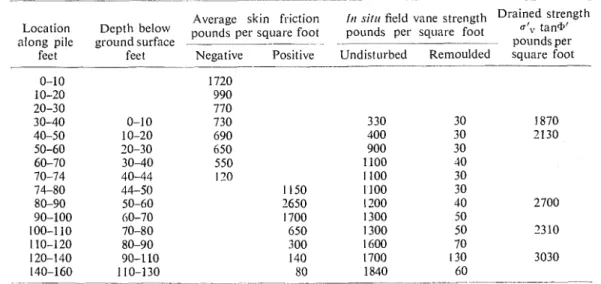
7Yft (22 m);s most encouraging, considering Using the 5 year load distribution curve of the simplifying assumptions for the coefficients Fig. 7, the average skin friction on 10 ft M , KO, bi' usedin the analysis. Within the sand (3 m) i?crements of length of pile was cal- embankment the predicted loading curve culated and compared with the shear strength of tlie surrounding soil. The undisturbed and A X I A L L O A D I N P l l t . T O N S
rolr 0 60 8 0 1 2 0 I 6 0 2 0 0 remoulded strengths of the soil were measured
I I I ~ ~ ~ - - with a field vane and the drained strengths
-
-
-
were calculated from tlie relation.
Sf,, = of,. tan (T,'.
Results are given in Table 3.
Within tlie sand embankment very large 20 unit friction is acting on the pile. It varies from over 1700 p.s.f. (0.83 kg/cm2) at the top of the f i l l to over 700 p.s.f. (0.34 kg/cni2) - 3 0 at the base. Froin tlie ground surface to 20 f t
(6 mj below the f i l l the negative skin friction is almost twice tlie undisturbed strength but only $ to the drained strength. From 20 to 40 ft (6 to 12 m) it is approximately $ the undisturbed strength.
FLG. 7. Variation of skin friction load in 12-in. 44 to 70 f t ( I 3 to 2 1 m, t h e (30-cm) diameter steel pipe pile with time. fill the unit positive skin friction exceeds the
TABLE 3 . Average skin friction determined from pile loads after 5 years compared with the strength of the
silrrounding soil.
Average skin friction Itr sifu field vane strength Drained strength Depth poilnds per square foot pounds per square foot "I" tan"
along pile ground surface - - . pounds per
feet feet Negative Positive Undisti~rbed Remoulded square foot
undisturbed strength of the soil. The maxi- m u m skin friction of 2650 p.s.f. (I .29 kg/cm?) from 50 t o 60 ft (15 to 18 m) is double tlie i~ndrained strength a n d almost equals the drained strength of 2700 p.s.f. ( 1 . 3 2 kgicm?). Below 70 ft (21 m) the skin friction decreases rapidly to the remoulded strength of tlie s01l.
This analysis indicates that there is little o r no relation between the skin friction exert- cd o n the pile a n d the in situ shear strength of the soil. In the upper part of the soil profile, where the relative movements between pile a n d soil are small a n d all excess pore pressures have dissipated, tlie unit skin friction approaches but does not exceed the drained strength. Towards the bottom end of tlie pile, where tlie excess pore pressures a n d relative movements betweer? p ~ l e a n d soil are large, the unit skin friction decreases to but does not fall below the remoulded strength of the surrounding soil.
Conclusions
1. Skin friction loads exerted on a floating pipe test pile in marine clay are related t o the efl'ective horizontal pressures acting on its surface.
2. Predicted skin friction loads compare favorably with observed loads, with respect to both location of the neutral point and magnitude of load.
3. Horizontal stresses generated in a n em- bankment as a result of differential settlement require further study.
4. Unit skin friction exerted o n the test pile is not related to the ill situ shear strength of
the soil. Where relative movements between pile a n d soil are small a n d excess pore pres- sures have dissipated, skin friction approaches but does not exceed the drained strength. Where relative movements a n d excess pore pressures are large. skin friction decreases t o the remoulded strength.
Acknowledgments
Thanks are due t o the Quebec Autoroute Authority. Terratech Ltd., a n d Labrecque, Vezina, a n d Associates for their help a n d cooperation during this study. Special thanks are also due t o colleagues in the Geotechnical Section. and to Mr. C , B. Crawford, Assistant Director of the Division, under whose direc- tion the early part of this work was carried out.
This paper is a contribution from the Divi- sion of Building Research, National Research Council of Canada, and is pl~blished with the approval of the Director of tlie Division.
BALADI, G . Y. 1967. Distribution of stresses 2nd dis- placements within and under long elastic and viscoelastic embankments. Thesis, Pi~rdue Uni- versity, School of Civil Engineering.
136 C \N.\DI.\N GlCOTIZCHNIC' \I, JOIJRN \I,. 1'01,. 9. 1972
B o z o z u ~ , M. 1970. Field observations of negative skin friction loads on long piles in marine clay. 111 Design and installation of pile foundations and cellular structures. Proceedings of Conference held at Lehigh University, April 1970. Edited by H. Y. Fang and T. D. Dismuke. Envo Publishing Co. Inc., Lehigh Valley, Pa., pp. 273-280.
B o z o z u ~ , M., and JARRETT, P. M. 1967. Instrumentation for negative skin friction studies on long piles in marine clay on the autoroutc du Quebec. Proc. Int. Bridgc Tunnel and Turnpike Assoc. 1967, pp. 44-64.
B o z o z u ~ , M., and LABRECQUE, A. 1968. Downdrag measurements on 270-ft composite piles. ASTM Spec. Tech. Publ. No. 444, pp. 1 5 4 0 .
EDEN, W. J., and B o z o z u ~ , M. 1969. Earth pressures on Ottawa outfall sewer tunnel. Can. Geotech. J.,
6 (I), pp. 17-32.
JAKY, J. 1948. Pressure in silos. Proc. Sec. Int. Conf. Soil Mech. Found. Eng. 1, pp. 103-107.
JO~IANNESSEN, I. J., and BJERRUM, L. 1965. Measurement of the compression of a steel pile to rock due to settlement of the surrounding clay. Proc. 6th Int. Conf. Soil Mech. Found. Eng. Montreal. University of Toronto Press, Toronto, 2, pp. 261-264. KARROW, P. F. 1961. The Champlain Sea and its sedi-
ments. 111 Soils in Canada. University of Toronto Press, pp. 97-108.
MEYERHOT, G . G. 1953. The investigation of the bearing capacity of some bored and driven piles in London clay. Geotechnique, 3, (7), pp. 267-282.
PERLOFF, W. H., BALADI, G . Y., and HARR, M. E. 1967. Stress distribution within and under long elastic embankments. Embankments and their Foundations, Highw. Res. Rec. No. 181, pp. 12-40.
I'OTYONDY, .I. G. 1961. Skin friction between various soils and construction materials. Geotechnique,