HAL Id: hal-00495624
https://hal.archives-ouvertes.fr/hal-00495624
Submitted on 28 Jun 2010
HAL is a multi-disciplinary open access
archive for the deposit and dissemination of
sci-entific research documents, whether they are
pub-lished or not. The documents may come from
teaching and research institutions in France or
abroad, or from public or private research centers.
L’archive ouverte pluridisciplinaire HAL, est
destinée au dépôt et à la diffusion de documents
scientifiques de niveau recherche, publiés ou non,
émanant des établissements d’enseignement et de
recherche français ou étrangers, des laboratoires
publics ou privés.
Copyright
Ultra-long range correlations of the dynamics of jammed
soft matter
Simona Maccarrone, Giovanni Brambilla, Olivier Pravaz, Agnès Duri, Matteo
Ciccotti, Jean Marc Fromental, Eugene Pashkovski, Alex Lips, David
Sessoms, Veronique Trappe, et al.
To cite this version:
Simona Maccarrone, Giovanni Brambilla, Olivier Pravaz, Agnès Duri, Matteo Ciccotti, et al..
Ultra-long range correlations of the dynamics of jammed soft matter. Soft Matter, Royal Society of
Chem-istry, 2010, 6 (21), pp.5514-5522. �10.1039/c0sm00155d�. �hal-00495624�
S. Maccarrone1 , G. Brambilla1 , O. Pravaz1 , A. Duri1 , M. Ciccotti1 , J.-M. Fromental1 , E. Pashkovski2 , A. Lips3 , D. Sessoms4 , V. Trappe4 , L. Cipelletti1 1
Laboratoire des Collo¨ıdes, Verres et Nanomat´eriaux, UMR 5587, Universit´e Montpellier II and CNRS,
34095 Montpellier, France
2
Unilever Res Labs, Trumbull, CT 06611 USA
3
Unilever Discover, Port Sunlight, UK
4
Physics Department, Universit´e de Fribourg, 1700 Fribourg, Switzerland
∗
(Dated: June 28, 2010)
We use Photon Correlation Imaging, a recently introduced space-resolved dynamic light scattering method, to investigate the spatial correlation of the dynamics of a variety of jammed and glassy soft materials. Strikingly, we find that in deeply jammed soft materials spatial correlations of the dynamics are quite generally ultra-long ranged, extending up to the system size, orders of magnitude larger than any relevant structural length scale, such as the particle size, or the mesh size for colloidal gel systems. This has to be contrasted with the case of molecular, colloidal and granular “supercooled” fluids, where spatial correlations of the dynamics extend over a few particles at most. Our findings suggest that ultra long range spatial correlations in the dynamics of a system are directly related to the origin of elasticity. While solid-like systems with entropic elasticity exhibit very moderate correlations, systems with enthalpic elasticity exhibit ultra-long range correlations due to the effective transmission of strains throughout the contact network.
PACS numbers:
I. INTRODUCTION
Soft materials such as colloidal suspensions, emulsions and surfactant phases typically exhibit increasingly slow relaxation dynamics as a result of particle crowding or because of strong interactions, either attractive or re-pulsive [1]. Work in the past years has shown that a feature shared by most of these systems is the heteroge-nous character of their slow dynamics, which result from rearrangements that are localized in space and intermit-tent in time [1–10], in analogy with molecular glass form-ers [11, 12] and driven athermal grains and foams [13–17]. For colloidal hard spheres, probably the most stud-ied soft matter model system exhibiting a glass tran-sition [18], the size ξ of dynamical clusters undergo-ing correlated rearrangements has been shown to grow with volume fraction on approaching the glass transi-tion [3, 6, 19, 20]. For supercooled samples whose dy-namics are stationary, the growth is however modest, the largest reported values of ξ being of the order of a few particle sizes [3, 6, 19, 20]. Similar results have been re-ported for weakly attractive systems [7, 8]. This agrees with numerical and experimental findings for molecular glass formers [11, 12, 21, 22] and grains [13–16]. Although the debate is still very active on whether or not the glass and the jamming transitions coincide in thermal hard spheres [23–28], and thus on how far the regime where ξ grows may extend, it is unlikely that significantly larger
∗Electronic address: lucacip@lcvn.univ-montp2.fr
correlation lengths may be measured in the supercooled regime.
Recent experiments using time-resolved light scatter-ing methods suggest that this scenario could be very different for a wide range of soft materials quenched in a nearly-arrested, out-of-equilibrium state, which we shall refer to (somehow loosely) as jammed soft sys-tems. In these experiments, very large temporal fluc-tuations of the intensity autocorrelation function were observed [9, 10, 29], suggesting that the size of regions undergoing correlated rearrangements may be a sizeable fraction of the scattering volume, i.e. that they may ex-tend over macroscopic distances. Indeed, direct measure-ments of ξ in a strongly attractive colloidal gel [30] and in concentrated soft particles [31] have shown that in these systems the correlation length of the dynamics is limited essentially only by the system size.
In this paper, we present data on a variety of soft jammed systems, showing that extremely long ranged correlations of the dynamics in jammed systems are the rule rather than the exception. The systems investigated include hard and soft spheres, colloidal gels made of at-tractive particles, biomimetic protein films, a concen-trated surfactant solution (“onion” phase) and Laponite suspensions: with the exception of the supercooled hard spheres, ξ always exceeds 1 millimeter, much larger than any structural length scale. We discuss the role of both the strength and the microscopic origin of the elastic-ity in shaping spatial correlations of the dynamics and compare our results to the behavior of jammed materials under shear [32–35].
II. MATERIALS AND METHODS A. Time resolved correlation and photon
correlation imaging
Although dynamic light scattering (DLS) is now a pop-ular and well established technique to probe the ics of soft materials [36], its usefulness to measure dynam-ical heterogeneity has been limited until recently by the spatial and temporal averages usually involved in DLS measurements. In this section, we briefly recall the main features of a series of DLS time- and space-resolved meth-ods that we have introduced in the past years. More details can be found in Refs. [4, 29, 30, 37, 38].
Time resolved correlation (TRC). Valuable informa-tion on spatial correlainforma-tions of the dynamics can be ob-tained in time-resolved measurements, even if they lack spatial resolution. Intuitively, this is due to the fact that temporal fluctuations of the dynamics are enhanced if the probed sample volume contains a limited number of statistically independent regions, as is the case when the dynamics are correlated over large distances [16]. More formally, a dynamical susceptibility χ4can be intro-duced [39], which quantifies temporal fluctuations of the dynamics, and which is proportional to the volume inte-gral of the spatial correlation of the dynamics, G4[39, 40]. In our DLS experiments, we achieve temporal resolution by using a CCD camera as a detector and by averag-ing the intensity correlation function over pixels rather than over time. The CCD is placed in the far field, so that each pixel is illuminated by light issued from the whole scattering volume at a well defined scattering an-gle θ. The dynamics are probed on a length scale ℓ ∼ 1/q, where q = 4πnλ−1sin(θ/2) is the scattering vector and n and λ are the solvent refractive index and the in-vacuo wave length of the laser that illuminates the sample, re-spectively. We measure a time-resolved intensity correla-tion funccorrela-tion (proporcorrela-tional to the square of the dynamic structure factor), defined as
cI(t, τ ) =
hIp(t)Ip(t + τ )ip hIp(t)iphIp(t + τ )ip
− 1 , (1)
which we refer to as the degree of correlation. In Eq. (1), Ip indicates the scattered intensity measured by the p-th pixel and p-the averages are taken over p-the whole CCD detector. The average dynamics and dynamical hetero-geneity are quantified by
g2(τ ) − 1 =< cI(t, τ ) >t (2) χ(τ ) = var[cI(t, τ )] =< cI(t, τ ) 2 >t− < cI(t, τ ) > 2 t, (3) where averages are taken over time and where g2 − 1 is the usual intensity correlation function measured in DLS, while χ is the equivalent for DLS of the dynamical susceptibility χ4used in numerical works. Note however that, contrary to χ4, χ is not normalized with respect to the number of particles in the scattering volume, a quantity not always easily accessible experimentally.
diaphragm lens ∆θ object plane focal plane ∆θ sample sample diaphragm lens ∆θ object plane image plane focal plane
C
C
D
beam splitter ∆θ a b image planeC
C
D
C
C
D
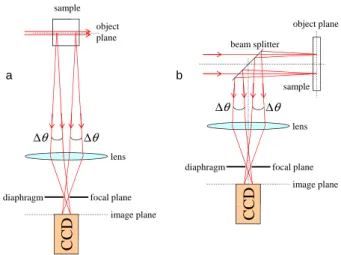
FIG. 1: Scheme of a PCI setup in two different configurations: a) 90◦scattering angle; b) backscattering. From Ref. [30] with
permission.
Photon correlation imaging (PCI). Spatial resolution may be achieved by modifying the collection optics so as to form an image of the scattering volume onto the CCD detector. This method, which we have termed pho-ton correlation imaging (PCI), has been described for a low-q setup in Ref. [30]. In Fig. 1 we show its imple-mentation for θ = 90 (a) and 180 (b) degrees, as in the experiments reported here. In both cases, an image of the illuminated sample is formed onto the CCD with magni-fication M ∼ 1, using light scattered within a small solid angle centered around a well defined scattering angle. The resulting image has a speckled appearance similar to that of conventional far-field scattering experiments. In practice, one adjusts the diaphragm aperture so as to roughly match the speckle size to the pixel size, which is typically of the order of 10 µm. Under these condi-tions, the speckle size is larger than the typical size of the scatterers (. 1 µm), which thus can not be resolved individually. Information on the local dynamics, how-ever, can still be obtained, because the relative motion of the scatterers results in fluctuations of the intensity of each speckle, as in regular DLS. In contrast to con-ventional DLS, here each speckle is illuminated by light issued from a well defined, small region of the sample, so that spatially-resolved dynamics can be measured.
In practice, we divide the CCD images in regions of interest (ROIs), each corresponding to a small volume in the sample, and apply the TRC method separately to each ROI. We compute a space- and time-resolved degree of correlation, defined as cI(t, τ, r) = hIp(t)Ip(t + τ )i r hIp(t)i rhIp(t + τ )ir − 1 , (4)
where the average is now over all pixels within a ROI corresponding to a small volume centered around r. The
ROIs must contain at least about 100 speckles for the sta-tistical noise on the local degree of correlation to be ac-ceptable: this limits the resolution of the method, which should be regarded as a coarse-grained technique. The main advantage of PCI is to decouple the size of the field of view (dictated by the magnification M ) from the length scale ℓ over which the dynamics are probed (dic-tated by q and thus the scattering angle). Thus, very restrained motion can be measured with a large field of view. This is not the case for conventional imaging meth-ods, where ℓ is a fixed fraction of the field of view.
The spatial correlation of the dynamics may be quan-tified by comparing the temporal evolution of the local degree of correlation calculated, for a given lag, for dif-ferent locations. Traces corresponding to pairs of re-gions with correlated dynamics will exhibit similar tuations, while uncorrelated ROIs yield independent fluc-tuations of cI. An example that will be discussed towards the end of this paper is given in Fig. 6. We define
f G4(τ, ∆r) = * hδcI(t, τ, r)δcI(t, τ, r + ∆r)it p var [cI(t, τ, r)] var [cI(t, τ, r + ∆r)] + r , (5) where δcI = cI− < cI >t are the temporal fluctuations of the local dynamics. This is the analogous, albeit at a coarse grained level, of the spatial correlation of the dynamics calculated in numerical and experimental work where particle trajectories are accessible [13, 19, 32, 40]. In most cases, the dynamics are isotropic and we average
f
G4over all orientations of ∆r.
An important point concerns the normalization of Eq. (5): we recall that cI contains a noise contribution due to the statistical noise associated with the finite num-ber of pixels processed for each ROI [38]. In PCI exper-iments, this contribution may be quite large, since one typically tries to reduce the size of the ROIs as much as possible in order to achieve a better spatial resolution. Distinct ROIs have uncorrelated noise; as a result, the numerator of the r.h.s. of Eq. (5) is noise-free (except for ∆r = 0), while the noise contributes to the denomina-tor by increasing its value. Thus, at spatial lags > 0 fG4 is depressed because of the noise contribution, an effect that depends on the size of the ROIs used for the anal-ysis. For systems that exhibit a finite spatial correlation of the dynamics at ∆r > 0, we introduce a normalized spatial correlation of the dynamics defined as
G4(τ, ∆r) = b(τ) fG4(τ, ∆r) , (6) where b is a time-lag dependent coefficient chosen so that G4→ 1 for ∆r → 0.
B. Experimental systems
We report below PCI measurements of heterogeneous slow dynamics on a variety of systems: “artificial skin” (Vitro-corneumr by IMS Inc.), concentrated colloidal
hard spheres, an “onion” gel, and a Laponite suspen-sion. For the sake of comparison, we recall also results obtained from concentrated soft spheres and a colloidal gel, taken from Refs. [31] and [30], respectively. For all systems, data are taken under single scattering con-ditions. The experiments on the “artificial skin” will be discussed somehow more in depth, because i) its behav-ior is representative of the main features observed for the other systems; ii) unlike most colloidal systems where the control parameters for the slow dynamics are volume fraction and interparticle potential, in “artificial skin” the slow dynamics is controlled by the relative humidity (RH). In this respect, “artificial skin” is representative of a class of materials of biological relevance whose slow dynamics are still poorly characterized and whose visco-elastic properties change dramatically with changes in hydration, as in stratum corneum, the uppermost part of the epidermis of mammalian skin [41–43]. This behavior is due to the fact that, for these materials, water acts as a plasticizer, lowering their glass transition temperature below room temperature at high RH.
The “artificial skin” is a protein-based thin film (20 − 25 µm) that mimics the properties of human stratum corneum. We mount a piece of the film on a circular frame of 10 mm of diameter to keep it flat and place it in a sealed custom-made cell that allows the relative humidity (RH) to be controlled during the PCI measure-ments. The desired value of the RH is imposed by plac-ing a saturated solution of a suitable salt in a reservoir contained in the cell. We present here results for two sat-urated salt solutions (prepared by adding 20% more in weight fraction than the solubility limit at 20◦C), yield-ing a humid (RH = 62%, usyield-ing KI) and a dry (RH = 12%, using LiCl) atmosphere, respectively. The mea-surements are performed in the backscattering geome-try depicted schematically in Fig. 1b (where the RH-controlling cell is not shown for simplicity), with θ = 180 degrees, corresponding to a typical probed length scale ℓ ∼ 30 nm. The imaged portion of the sample has a size of 4.288 × 4.288 mm2
(3.752 × 3.752 mm2
) for the dry (humid) sample; in both cases, square ROIs of size 268 × 268 µm2
were used for the PCI analysis. More de-tails on the lags used and the duration of the experiment are given in the discussion below.
The colloidal hard sphere samples are suspensions of poly-(methyl methacrylate) spheres of radius ∼ 100 [45] nm in an index matching mixture of cis/trans-decalin and tetralin. Their average dynamics have been reported in Refs. [20, 44]. For the space-resolved measurements dis-cussed here, we use the PCI geometry shown in Fig. 1a, where q = 25 µm−1, and where the size of the field of view and ROIs are 2.5 × 0.6 mm2
and 55 × 55 µm2 , re-spectively. We present data for two volume fractions, ϕ = 0.5468 (delay time τ = 20 ms, relaxation time of the dynamic structure factor τα = 0.147 s) and ϕ = 0.5957 (τ = 14 s, τα= 2350 s). All data are taken in a regime were the dynamics are stationary.
forming a dense packing of polydisperse, deformable spheres of average size of the order of a few µm [46]. Each sphere is constituted by a stacking of surfactant bilayers that roll up to form a multilamellar vesicle, or onion. The average dynamics and the rheological prop-erties of the onions have been described in Refs. [47, 48]; an optical microscopy investigation [49, 50] suggests that their dynamics is correlated at least up to length scales comparable to the field of view accessible in those exper-iments, about 1 mm. In the PCI measurements reported here, we use the 90 degree scattering angle geometry of Fig. 1a, with a field of view of 1.9 × 0.39 mm2
and ROIs of size 130 × 130 µm2
. The delay time is τ = 1000 s, about 20 times smaller than the relaxation time of g2− 1. The dynamics slow down with time: we analyze data for 20000 < t < 60000 s (t = 0 being the time at which the surfactant solution is quenched in the gel phase by a temperature jump [47]).
Laponite RD (Rockwood, US) is a synthetic clay con-sisting of discoid charged particles. By dispersing 3.5%wt of Laponite powder into pure water, we obtain a col-loidal glassy suspension that keeps aging for several days [51, 52]. To properly weight the Laponite content, we dry the powder for 12 hours in an oven at 130 C◦. In order to prevent chemical corrosion, the Laponite powder is then dispersed in a pH 10 solution constituted of pure Millipore water and a proper amount of sodium hydrox-ide. The white dispersion is held in a magnetic stirrer for 25 minutes until it becomes almost transparent, and it is then injected into the scattering cell through a 1 µm filter in order to eliminate particle clusters. The sample is pre-pared in an inert argon atmosphere in order to prevent contact with CO2. The scattering cell is then sealed in or-der to preserve this pure condition. The final step before measurements consists of a 3 minute centrifugation at 3000 rpm, to eliminate small gas bubbles that may have formed during the process. This sets the age zero of the sample (t = 0) with an incertitude of a few minutes. The data shown here refer to 2.0×10⁵
sec < t < 2.5×10⁵ sec; they were taken using a special cell as described at the end of the next section.
III. RESULTS
As a representative example of dynamical heterogene-ity in jammed systems, we first describe in some detail the behavior of “artificial skin” films. We show in Fig. 2 both the average dynamics and the dynamical suscepti-bility for a film in humid (RH = 62%, a) and dry (RH = 12%, b) atmosphere. The data shown here are obtained by processing the full images and by averaging over sev-eral tens of thousands of sec (36000 sec for the sample at RH = 12% and 22500 sec for RH = 62%). The temporal intensity correlation functions (black squares, left axis) exhibit a decay on a very long time scale, of the order of 104
sec. For the dry sample, g2− 1 appears to be more noisy than for the humid one, with an additional
0.0
0.1
0.2
10
-510
-410
-310
-210
10
210
310
410
50.0
0.1
0.2
10
-510
-410
-3g
2(
τ
)-1
χ
(
τ
)
a
b
τ (sec)
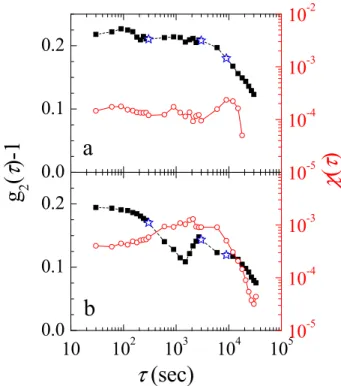
FIG. 2: Intensity time autocorrelation function, g2− 1 (left
axis and solid black squares), and dynamical susceptibility, χ (right axis and open circles), for the “artificial skin” sample, as measured in the backscattering configuration schematized in Fig. 1b. a: relative humidity = 62%; b: relative humidity = 12%. Note the enhanced dynamical heterogeneity in dry atmosphere, as shown by the higher values of χ. The three lags indicated by open stars are those for which the spatial correlation of the dynamics is shown in Fig.4.
decay at earlier times, τ ≈ 400 sec. This “noisiness” is due to enhanced dynamical heterogeneity, as compared to the humid sample: as discussed below, the dynamics of the dry sample are intermittent in time and corre-lated in space over very large distances: as a result, the temporal and spatial averages performed in calculating g2− 1 are poorer than for the humid sample. In both panels, we show also the dynamical susceptibility χ(τ ) (open circles and right axis). For the humid sample, χ depends weakly on τ , barely exhibiting a peak on the time scale of the decay of g2− 1. A peak in χ is a distinc-tive feature of dynamical heterogeneity [13, 22, 38, 40], while the noise contribution to the dynamical suscepti-bility is essentially flat for time delays smaller than the decay time of the intensity correlation function [37, 38]. Thus, the data in Fig. 2a suggest that the dynamics for the humid sample are mildly heterogeneous and that the noise contribution dominates the measured χ, with the exception of the small peak around τ = 104
sec. By contrast, the dynamical susceptibility of the dry sample presents a well-developed peak, about a factor of three higher than the short-τ value of the dynamical suscep-tibility and more than a decade higher than χ at large delay times. This suggests that the dynamics of the dry
0.0 0.1 0.2 0.3 0 1x10 4 2x10 4 3x10 4 0.0 0.1 0.2 10 0 10 1 10 2 c I ( t = 1 5 0 s e c ) d c b t (sec) c I ( t = 9 0 s e c ) a PDF[c I ]
FIG. 3: For a representative ROI, degree of correlation cI
at a fixed delay τ as a function of time and its PDF for the “artificial skin” in humid ( RH = 62%, τ = 150 sec, panels a and b) and dry (RH = 12%, τ = 90 sec, panels c and d) atmosphere. Note that the dry sample exhibits large temporal fluctuations.
sample are highly heterogeneous.
In order to gain further insight on the nature of the dynamical heterogeneity of “artificial skin”, we plot in Fig. 3 the temporal evolution of the degree of correla-tion, cI, calculated for a time delay much smaller than the relaxation time of g2 (τ = 150 and 90 sec for the humid and dry sample, respectively). We focus on small delays because this allows us to capture better the im-pact of individual rearrangement events, since at larger τ several events may occur in between two images. The signal shown here have been calculated for an individ-ual ROI, but are representative of the general behavior of all ROIs. For the humid sample, cI exhibits modest fluctuations symmetrically distributed around its mean value (panel a). Moreover, the probability distribution function (PDF) of cI, shown in panel b, is close to Gaus-sian. We have shown in previous work [29, 37, 38] that this is typical of a signal dominated by the measurement noise, which is particularly high when the degree of cor-relation is calculated over the limited number of pixels of a small portion of the image, as required by a space-resolved analysis. Panels c and d show cI and its PDF, respectively, for the dry sample. In contrast to the hu-mid film, sudden drops of the degree of correlation can be easily observed, corresponding to sudden rearrangement events in the sample. As a result the PDF of the degree of correlation is skewed, with a tail associated with the intermittent drops of cI. In other systems, the shape of the PDF has been shown to be well fitted by a Gum-bel distribution [38], often observed in the statistics of rare events in systems with extended spatial and tempo-ral correlations [53]. Here, the dynamics were too slow
0.0
0.5
1.0
0
2
4
6
0.0
0.5
1.0
300 sec 3000 sec 9000 sec 300 sec 3000 sec 9000 seca
G
4(
∆
r)
b
∆
r
(mm)
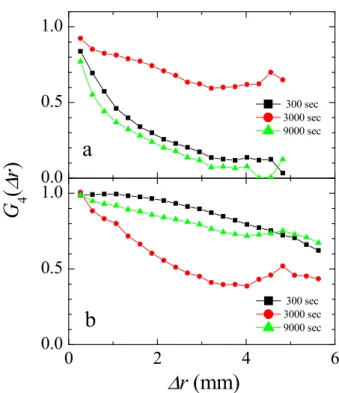
FIG. 4: Spatial correlation of the dynamics, G4(∆r), for the
“artificial skin” samples in humid (RH = 62%, a) and dry (RH = 12%, b) atmosphere. The curves are labeled by the temporal lag at which the dynamics were probed.
to allow us to accumulate enough statistics to make any quantitative statement on the shape of the PDF. We note however that the analysis of the temporal evolution of cI and its PDF confirms the differences between the two samples discussed in relation to Fig. 2: the dynamics of the dry sample are much more heterogeneous than those of the humid one.
Since the dynamics measured on the full field of view (Fig. 2) exhibit significant fluctuations, we expect them to be spatially correlated over macroscopic distances. The spatial correlation of the dynamics calculated ac-cording to Eqs. (5) and (6) is shown in Fig. 4, for the two samples, and for the three time lags indicated by open stars in Fig. 2. Quite generally, G4 is significantly larger than zero up to distances of the order of 1 mm (for the humid sample) or even several mm (for the dry sample). This is remarkable, since all relevant structural length scales are much smaller. Furthermore, the range of the spatial correlations of the dynamics is much longer for the dry sample than for the humid one; together with the enhanced intermittency under dry conditions seen in Fig. 3, this explains why the dynamical susceptibility of the dry sample is higher than that of the wet one, as shown in Fig. 2. Interestingly, the time lag dependence of G4is different for the two values of RH. At high RH, the range of G4is maximum at intermediate time delays and decreases at small and large τ . This is similar to what re-ported in numerical work on supercooled molecular glass formers [40] and experiments on grains [14], suggesting
that dynamical heterogeneity progressively build up with time, starting from individual events that are relatively limited in size. Eventually, at very large time lags, one expects G4 to decay on short length scales, since many uncorrelated events will have occurred everywhere in the sample. The shorter range of G4at τ = 9000 sec observed in Fig. 4a probably corresponds to the onset of this large τ regime. For the dry sample in panel b, G4is highly cor-related over a very long range for essentially all probed lags, indicating that individual events extend over several millimeters. We don’t have currently an explanation for the somehow faster decay of G4at intermediate lags; the long range of G4at the largest probed lag (τ = 9000 sec) indicates that on this time scale the regime where many uncorrelated events have occurred throughout the sam-ple is not yet attained. Longer lags could not be reliably analyzed due to the limited duration of the experiment.
Summarizing, the dynamics of the “artificial skin” are markedly heterogeneous under dry conditions, asso-ciated with intermittent rearrangement events. These events imply the motion of the scatterers over just a few nanometers (we recall that the full decay of g2− 1 corre-sponds to displacements of the order of 30 nm); however, whenever they occur, they impact essentially the whole sample, since the spatial correlation of the dynamics ex-tends over several mm. For the humid sample, dynamical heterogeneities are less pronounced; the range of spatial correlations, although reduced in comparison to that of the dry sample, is still on the order of 1-2 mm, much larger than any structural length scale in the sample. The change in dynamical behavior under different RH condi-tions observed here for the “artificial skin” is related to the loss of rigidity upon hydration and is reminiscent of the sensitivity to humidity of biological tissues. Indeed, humidity plays a key role in controlling biomechanical properties of stratum corneum [54], whose elastic mod-ulus, e.g., increases by several orders of magnitude with decreasing RH [42, 43].
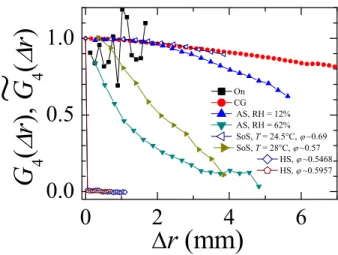
One may wonder whether similar dynamical features are observed also in other glassy or jammed soft matter systems that, similarly to the “artificial skin”, are charac-terized by ultraslow dynamics and a viscoelastic behavior where the solid-like response dominates. To address this question, we plot in Fig. 5 the spatial correlation func-tion of the dynamics of a series of systems: concentrated hard spheres at the onset of the supercooled regime and in the deep supercooled regime, soft spheres below and above random close packing (data taken form Ref. [31]), an onion gel, a colloidal gel (data taken from Ref. [30]), and the dry “artificial skin” film already shown in Fig. 2. With the exception of the soft spheres and the colloidal gel, for which data were taken in a low-angle configura-tion (q ∼ 1 µm−1), all data are collected either at θ = 90 or 180 degrees. For all samples, we calculate the spatial correlation of the dynamics at a time lag τ much shorter than the relaxation time of the corresponding g2− 1, in order to capture as much as possible the characteristics of single events. Quite generally, very long range
correla-0 2 4 6 0.0 0.5 1.0 On CG AS, RH = 12% AS, RH = 62% SoS, T = 24.5°C, ~0.69 SoS, T = 28°C, ~0.57 HS, ~0.5468 HS ~0.5957 r (mm) G 4 ( r ) , G 4 ( r ) ~
FIG. 5: Spatial correlation of the dynamics for all systems that we have studied except for Laponite, as indicated by the label (On: onion gel; CG: colloidal gel, from Ref. [30]; AS: “artificial skin”, τ = 300 sec; SoS: soft spheres, from [31]; HS: hard spheres). Data for Laponite are shown in Fig. 6 below. All spatial correlation functions have been normalized according to Eq. (6), except for the hard spheres, for which f
G4 is shown (see Eq. (5)), rather than G4.
tions of the dynamics are observed for all samples, up to several mm, once again much larger than any structural length scale and comparable to the system size. In partic-ular, data for the onions, albeit somehow noisy due to the relatively small number of available pixels and the lim-ited duration of the experiment (about twice the relax-ation time of g2− 1), confirm and extend the long-range correlation of the dynamics observed, for a smaller field of view, by microscopy [49, 50]. Even for the “artificial skin” under humid conditions and the less compressed soft sphere system (T = 28◦C), where G4decreases more rapidly than for the other systems, spatial correlations still extend over macroscopic length scales. The only ex-ceptions are the hard spheres samples. For these systems, f
G4 drops to zero as soon as ∆r > 0; although we show here data at τ much smaller than the relaxation time of g2−1, we point out that a similar behavior is found at all τ . Since the normalization method described in Sec. II A can not be applied, we represent fG4rather than G4as for the other samples. For the less concentrated hard sphere suspension, such a sharp drop of fG4 is not surprising, since no spatial correlation of the dynamics are to be ex-pected at the onset of the supercooled regime. Indeed, at ϕ = 0.5468 the dynamics is slower than in the ϕ → 0 limit by a relatively modest factor of 100, and the shape of the dynamic structure factor differs only marginally from that in the diluted case [20]. For the most con-centrated hard sphere sample, by contrast, the system relaxation is already slowed down by a factor of about 107
compared to the ϕ ≈ 0 limit and a fully developed plateau is observed in the dynamic structure factor, re-vealing caging and glassy dynamics [20, 44]. It has been proposed that such a dramatic slow down of the
dynam-0.3
0.4
0.5
0.6
GS LB 1 1 2 3 Glass slide ROI 3 ROI 2(t
,
τ
=
200
s
ec
)
ROI 1220000
240000
0.2
t (sec)
c
I(
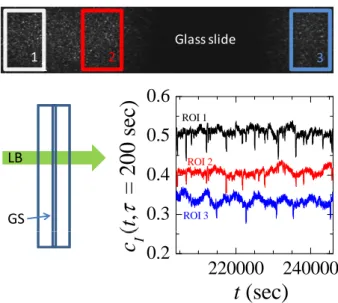
FIG. 6: Bottom left: schematic side view of the cell used for the experiment on Laponite. LB: laser beam, GS: glass slide. Top: typical CCD image of the scattering volume. The dark region corresponds to the thickness of the glass slide, view from the side. The three ROIs for which the degree of correlation is shown in the bottom right plot are highlighted. The size of the imaged region is 2.62 × 0.52mm2
. Bottom right: time dependence of cI, for a delay time τ = 200 sec,
for the three ROIs shown above. For the sake of clarity, the curves of ROIs 1 and 2 have been offset vertically by 0.2 and 0.1, respectively. Note that the signals measured on the same side of the glass slide (ROIs 1 and 2) are correlated, while signals from opposite sides are uncorrelated.
ics is associated with the growth of spatial correlations of the dynamics. Previous experiments, both by confo-cal microscopy [19] and dynamic light scattering [6, 20], indicate that the range, ξ, of such correlations does not exceed a few particles sizes, i.e. a few µm in our case. Therefore, the absence of any measurable correlation in our PCI experiment, where the smallest accessible spatial lag is 55 µm, is fully consistent with previous results. On the one hand, this negative result illustrates the limita-tions intrinsic to PCI, a coarse grained method. On the other hand, it highlights the dramatic difference between the dynamics of supercooled, stationary hard spheres and those of the other jammed, out-of-equilibrium samples, for which macroscopic spatial correlations of the dynam-ics are observed.
The results shown here suggest that system-size corre-lations of the dynamics are ubiquitous in fully jammed systems, where the solid-like behavior of the sample dom-inates over its viscous response. Indeed, in a material that is essentially solid-like, any deformation due to a local rearrangement will propagate very far before being substantially damped, leading to extended spatial corre-lations of the dynamics. Another (less attractive) expla-nation of the dynamical fluctuations reported here could be that they are due to some kind of artifact. In fact, one should be aware that measuring fluctuations in a
re-liable fashion is much more difficult than just probing the average dynamics, and many spurious effects have to be controlled and ruled out (for a discussion of some possi-ble sources of artifacts, such as temperature fluctuations and laser beam pointing instabilities, see also Ref. [38]). In order to address the role of the elastic propagation of a strain field and to demonstrate the genuine nature of the spatial correlations observed here, we discuss briefly an experiment performed on a Laponite sample using a specially devised cell.
The cell is a cylindrical tube of inner diameter ≈ 10 mm (see Fig. 6), with a microscope glass slide glued in the interior with epoxy, so as to separate the cell into two chambers. Because the glass slide is cut unevenly and does not fit perfectly the cell walls, the two cham-bers are in contact through openings of size ≈ 1 mm, so that the sample contained in the two chambers is fully equilibrated and experiences exactly the same con-ditions. The laser beam impinges perpendicularly to the glass slide, thereby illuminating both chambers, and the scattering volume is imaged at an angle θ = 90◦, as in the geometry shown in Fig. 1a. We calculate the local cI for larger-than-usual ROIs, in order to reduce the noise contribution (see Fig. 6). From the plot in Fig. 6, it is clear that the time evolution of the degree of correlation measured on the same side of the glass slide is highly correlated (ROIs 1 and 2, separated by ∆r = 0.57 mm), since most of the downward spikes corresponding to sud-den rearrangement events are co-occurrent. Indeed, fG4 calculated from the signals for ROIs 1 and 2 is as high as 0.394 (we recall that fG4is affected by the noise contribu-tion, so that an even higher value would be observed in the absence of noise). By contrast, the events recorded in ROI 3, on the opposite side of the glass slide, appear to be uncorrelated with respect of those of ROIs 1 and 2, as confirmed by low values of the correlation (e.g., fG4 = -0.015 when correlating the signals from ROIs 2 and 3).
This experiment demonstrates that the downward spikes observed in cI can not be due to some mechanical, temperature or laser beam instability, since they occur independently on either side of the glass slide. On the other hand, the data of Fig. 6 support the idea that the propagation of a strain field in a predominantly elastic medium is responsible for long range spatial correlations. Indeed, such a strain field can not propagate through the rigid glass slide, so that the dynamical activity in the two chambers is uncorrelated, while the one in a given chamber is correlated.
IV. DISCUSSION
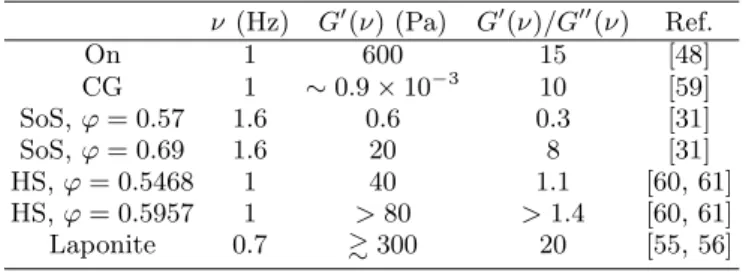
To better understand the relationship between vis-coelastic properties and spatial correlations of the dy-namics, we examine published rheological data for most of the systems investigated here and summarize the rele-vant rheological parameters in Table I, where we choose, somehow arbitrarily, ν ∼ 1 Hz as a reference frequency
TABLE I: Rheological parameters of most of the system shown in Figs. 5 and 6. The sample names are as in the caption of Fig. 5. ν (Hz) G′(ν) (Pa) G′(ν)/G′′(ν) Ref. On 1 600 15 [48] CG 1 ∼ 0.9 × 10⁻³ 10 [59] SoS, ϕ = 0.57 1.6 0.6 0.3 [31] SoS, ϕ = 0.69 1.6 20 8 [31] HS, ϕ = 0.5468 1 40 1.1 [60, 61] HS, ϕ = 0.5957 1 > 80 > 1.4 [60, 61] Laponite 0.7 &300 20 [55, 56]
for comparing different systems. Oscillatory rheology experiments for the onion gels [48] show that both the storage, G′(ν), and loss, G′′(ν), moduli are essentially frequency-independent in the range 4 × 10⁻³ Hz < ν < 10 Hz, and that G′ ∼ 600 Pa dominates over G′′by a fac-tor of ∼ 15. Similar results are obtained for the Laponite suspension [55] and for the colloidal gels [57]. Note that the magnitude of the elastic modulus of the colloidal gel (G′ ∼ 4.4 × 10⁻⁴− 1.5 × 10⁻³Pa [57–59]) is lower than that of the onion gel and of the Laponite suspension by at least 5 orders of magnitude, implying that the absolute value of G′is not a relevant parameter in determining the range of spatial correlations of the dynamics. A system-atic investigation of the shear moduli of the soft particles is presented in Ref. [31]. For the most concentrated sam-ple reported in Fig. 5 above, one finds that G′ and G′′ are nearly frequency independent and that the former is larger than the latter by almost a decade. By contrast, for the less concentrated sample both moduli are com-parable (see panels a) and b) of Fig. 3 of Ref. [31]), revealing a complex viscoelastic behavior where neither the solid-like nor the fluid-like character prevail. Since spatial correlations of the dynamics are shorter-ranged in the less concentrated sample, these observations are consistent with the notion that a fully developed elastic behavior is a necessary condition for long-range spatial correlations of the dynamics. The same trend is likely to hold for the “artificial skin”. Indeed, we find that the range of the spatial correlation of the dynamics in-creases as the RH dein-creases. Although no rheology data are available for the “artificial skin”, it is worth noting that in stratum corneum [42, 43], a material whose prop-erties the Vitro-corneumr film is designed to mimic, the elastic modulus grows by almost 3 orders of magnitude when the RH decreases from 100% to 30%.
Collectively, these results indicate that systems with long-ranged spatial correlations of the dynamics have a solid-like behavior. A close inspection of rheology data for hard sphere suspensions, for which we recall that ξ is limited to a few particle sizes at most, show that the reverse is not true. Mason and Weitz have measured the shear moduli of supercooled hard spheres [60]. Care must be taken in applying their results to our hard sphere samples, due to the unavoidable uncertainties in the
de-termination of the absolute volume fraction [44, 62]. A generally accepted approach consists in considering the separation, ǫ = (ϕc− ϕ)/ϕc, with respect to the location ϕc of the (apparent) divergence of the relaxation time as obtained from a mode coupling theory fit of τα(ϕ) [In our work, ϕc ≈ 0.59 [20], while ϕc ≈ 0.575 in Ref. [60]]. For our most diluted sample, ϕ = 0.5468 and ǫ ≈ 0.07, cor-responding roughly to the data for ϕ = 0.53 in Ref. [60]. At that volume fraction, G′ and G′′ have approximately equal magnitude in all the accessible frequency range, similarly to the case of our soft spheres at ϕ = 0.57. How-ever, no spatial correlation of the dynamics is observed in the hard spheres at ϕ = 0.5468, while ξ ∼ 2 mm for the soft spheres at ϕ = 0.57. This difference is even more striking if we consider our most concentrated hard sphere sample, for which ξ is limited to a few particle sizes [20], although the sample is solid-like (G′ dominates over G′′) and the magnitude of its elastic modulus [61] is compa-rable to that of the Laponite suspension, which exhibits systems-size dynamical correlations.
Our measurements thus indicate that, while elasticity is a necessary condition for observing extended spatial correlations of the dynamics, it is not a sufficient one. The microscopic origin of the elasticity must also play a crucial role: the differences discussed above suggest that ξ is modest in systems where the elasticity has an en-tropic origin, as for the hard spheres, and no long-lived network of contacts exists. By contrast, ξ is very large in systems where elasticity has an enthalpic origin, be it due to the bending rigidity of the protein filament net-work in “artificial skin” and the backbone in diluted gels made of strongly attractive particles, or to the bulk elas-ticity of squeezed particles, as in the soft spheres and the onions. Note that the Laponite suspension falls also in the latter category: while the platelets are not in direct contact, they interact via a screened Coulombic repulsive potential and can thus be effectively regarded as squeezed soft particles. Interestingly, recent work [63] has identi-fied a structural length scale that controls the mechani-cal properties of attractive colloidal systems: this length scale is of the order of the particle size for hard spheres, while it grows as short-ranged attractive interactions be-come increasingly important, as in colloidal gels. Our data suggest that this behavior may be mirrored by a similar growth of ξ. In repulsive, squeezed systems, the same role is presumably played by a persistent network of interparticle forces, such as that visualized by confocal microscopy in compressed emulsions [64].
In view of the above discussion, it is natural to com-pare our results to numerical and experimental work on driven jammed systems. In these works, the sample is sheared by imposing either a continuous deformation or a sinusoidal one. The dynamics are quantified by the par-ticle displacements perpendicular to the shear direction or after subtracting the affine component (for a continu-ous shear), or by comparing successive configurations at zero deformation (for oscillatory shear). For a 2D gran-ular medium sheared at a finite shear rate, Lechenault
et al. [32] find that a spatial correlation function analo-gous to our G4 decays on a length scale ξ4 on the order of ten particle sizes at the jamming transition, and that this length decreases upon further compression, although only a restrained range of densities above jamming could be probed, due to the particle stiffness. Simulations of sheared soft disks [33] indicate that above the jamming transition and at finite shear stress, σ, ξ remains moder-ate, but a scaling analysis suggests that ξ diverges in the limit σ → 0 for all densities above jamming. This is con-firmed by quasi-static shear simulations of jammed soft particles [34, 35], where it is shown that spatial correla-tions of the dynamics above jamming are limited only by the system size.
Therefore, the dynamical behavior reported here ap-pears to be due to the connected nature of the materials investigated, where a strain field can propagate over very large distances, as in fully jammed systems sheared at a vanishingly small rate. A related issue, still open, con-cerns the microscopic origin of the dynamics. The sys-tems studied in Refs. [32–35] are athermal, with no dy-namics in the absence of an external driving. Although the systems presented here are thermal and no external drive is applied to them, it is unlikely that thermal mo-tion alone is responsible for their dynamics in the jammed state. This is illustrated, e.g., by the volume fraction de-pendence of the dynamics reported for the soft spheres of Ref. [31]. In the supercooled regime, the relaxation time, τc, grows sharply with ϕ, as in hard sphere systems. Above random close packing, a different regime sets in, where τcgrows very slowly with ϕ. Thus, above jamming, the relaxation time is orders of magnitude smaller than what expected by extrapolating the behavior in the su-percooled regime, strongly suggesting that an additional relaxation mechanism has set in. We propose that, quite generally, the relaxation of internal stress may be such a mechanism in jammed soft matter. This is an appeal-ing explanation, since it would be consistent with the observed ultra-long range correlations of the dynamics. However, this conjecture still awaits for a direct experi-mental proof.
V. CONCLUSIONS
We have presented direct measurements of the corre-lation length of the slow dynamics of a variety of glassy
and jammed soft systems, obtained using the recently introduced PCI method. This technique allows one to measure coarse grained maps of the dynamical activity of a sample. Its main advantage consists in the possibil-ity of probing motion on a very small length scale, yet for a very large field of view. This is an attractive feature for jammed systems, where motion is very restrained but highly correlated spatially. Additionally, the technique does not require individual particles to be imaged; ac-cordingly, it can be applied to systems for which direct visualization by optical or confocal microscopy is not pos-sible, including turbid samples as, e.g., foams [65].
We find that in deeply jammed systems ξ is quite gen-erally very large, typically on the order of the system size. This is in striking contrast with the modest corre-lation lengths measured in glass formers, including col-loidal hard spheres. An analysis of the viscoelastic prop-erties of the various systems investigated here shows that a well developed elasticity (G′ > G′′) always accompa-nies the presence of long-ranged spatial correlations of the dynamics, regardless of the absolute magnitude of the elastic modulus. The reverse, however, is not true, as exemplified by concentrated hard sphere suspensions, whose macroscopic rheological response is predominantly solid-like, whereas the correlation length of the dynamics is limited to a few particle sizes. These results highlight the crucial role of the microscopic origin of elasticity (en-tropic vs. enthalpic) in determining the range of spa-tial correlations of the dynamics. Further work will be needed to test thoroughly these ideas, for example by varying continuously the strength of attractions in dense colloidal suspensions, so as to change progressively the nature of the elasticity [63] and, presumably, the corre-lation length ξ.
VI. ACKNOWLEDGEMENTS
S.M. has been supported by Unilever, G.B. by the R´egion Languedoc Roussillon and the CNES. L.C. ac-knowledges the support of the Institut Universitaire de France and of the ANR grant “Dynhet”. The collabo-ration between L.C. and V.T was supported in part by the CNRS (PICS N. 2410). V.T. and D.S. acknowledge financial support from the Swiss National Science Foun-dation. We thanks L. Berthier, S. Ciliberto and L. Ramos for numerous and illuminating discussions.
[1] L. Cipelletti and L. Ramos, J. Phys.: Condens. Matter, 2005, 17, R253-R285.
[2] W. K. Kegel and A. van Blaaderen, Science, 2000, 287, 290-293.
[3] E. R. Weeks, J. C. Crocker, A. C. Levitt, A. Schofield and D. A. Weitz, Science, 2000, 287, 627-631.
[4] L. Cipelletti, H. Bissig, V. Trappe, P. Ballesta and S. Mazoyer, J. Phys.: Condens. Matter, 2003, 15,
S257-S262.
[5] R. Sarcia and P. Hebraud, Physical Review E, 2005, 72, 011402-011405.
[6] L. Berthier, G. Birol, J. P. Bouchaud, L. Cipelletti, D. El Masri, D. L’Hote, F. Ladieu and M. Pierno, Science, 2005, 310, 1797-1800.
[7] Y. Gao and M. L. Kilfoil, Phys. Rev. Lett., 2007, 99, 078301.
[8] C. J. Dibble, M. Kogan and M. J. Solomon, Phys. Rev.
E, 2008, 77, 050401.
[9] P. Ballesta, A. Duri and L. Cipelletti, Nature Physics, 2008, 4, 550-554.
[10] A. Duri and L. Cipelletti, Europhysics Letters, 2006, 76, 972-978.
[11] S. C. Glotzer, Journal of Non-Crystalline Solids, 2000, 274, 342-355.
[12] M. D. Ediger, Annu. Rev. Phys. Chem., 2000, 51, 99-128. [13] O. Dauchot, G. Marty and G. Biroli, Phys. Rev. Lett.,
2005, 95, 265701.
[14] R. Candelier, O. Dauchot and G. Biroli, Phys. Rev. Lett., 2009, 102, 088001.
[15] A. S. Keys, A. R. Abate, S. C. Glotzer and D. J. Durian,
Nature Physics, 2007, 3, 260-264.
[16] A. R. Abate and D. J. Durian, Phys. Rev. E, 2007, 76, 021306.
[17] P. Mayer, H. Bissig, L. Berthier, L. Cipelletti, J. P. Gar-rahan, P. Sollich and V. Trappe, Phys. Rev. Lett., 2004, 93, 115701.
[18] P. N. Pusey and W. Vanmegen, Nature, 1986, 320, 340-342.
[19] E. R. Weeks, J. C. Crocker and D. A. Weitz, J. Phys.
Condens. Matt., 2007, 19, 205131.
[20] G. Brambilla, D. El Masri, M. Pierno, L. Berthier, L. Cipelletti, G. Petekidis, A. B. Schofield, Phys. Rev. Lett., 2009, 102, 085703-085704.
[21] C. Dalle-Ferrier, C. Thibierge, C. Alba-Simionesco, L. Berthier, G. Biroli, J. P. Bouchaud, F. Ladieu, D. L’Hote and G. Tarjus, Phys. Rev. E, 2007, 76, 041510.
[22] S. Karmakar, C. Dasgupta and S. Sastry, Proceedings of the National Academy of Sciences, 106, 3675, 2009. [23] R. D. Kamien and A. J. Liu, Phys. Rev. Lett., 2007, 99,
155501.
[24] L. Berthier and T. A. Witten, Europhys. Lett., 2009, 86, 10001.
[25] L. Berthier and T. A. Witten, Phys. Rev. E, 2009, 80, 021306.
[26] N. Xu, T. K. Haxton, A. J. Liu and S. R. Nagel, Phys. Rev. Lett., 103, 245701, 2009.
[27] Z. Zhang, N. Xu, D. T. N. Chen, P. Yunker, A. M. Al-sayed, K. B. Aptowicz, P. Habdas, A. J. Liu, S. R. Nagel and A. G. Yodh, Nature, 459, 230, 2009.
[28] H. Jacquin and L. Berthier, Soft Matter, 6, 2970, 2010. [29] H. Bissig, S. Romer, L. Cipelletti, V. Trappe and P.
Schurtenberger, Phys. Chem. Comm., 2003, 6, 21-23. [30] A. Duri, D. A. Sessoms, V. Trappe and L. Cipelletti,
Phys. Rev. Lett., 2009, 102, 085702-085704.
[31] D. A. Sessoms, I. Bischofberger, L. Cipelletti and V. Trappe, Philos. Trans. R. Soc. A-Math. Phys. Eng. Sci., 2009, 367, 5013-5032.
[32] F. Lechenault, O. Dauchot, G. Biroli, J. P. Bouchaud,
Europhys. Lett., 2008, 4, 46003.
[33] P. Olsson and S. Teitel, Phys. Rev. Lett., 2007, 99, 178001.
[34] C. Heussinger and J.-L. Barrat, Phys. Rev. Lett., 2009, 102, 218303.
[35] C. Heussinger, L. Berthier and J.-L. Barrat, Europhys.
Lett., 90, 20005, 2010.
[36] B. J. Berne and R. Pecora, Dynamic Light Scattering, Wiley, New York, 1976.
[37] A. Duri, P. Ballesta, L. Cipelletti, H. Bissig, V. Trappe,
Fluctuation and Noise Letters, 2005, 5, L1-L15.
[38] A. Duri, H. Bissig, V. Trappe, L. Cipelletti, Phys. Rev.
E, 2005, 72, 051401-051417.
[39] S. Franz et al., Philos. Mag. B, 1999, 79, 1827; S. Franz and G. Parisi, J. Phys.: Condens. Matter, 2000, 12, 6335. [40] N. Lacevic, F. W. Starr, T. B. Schroder, V. N. Novikov
and S. C. Glotzer, Phys. Rev. E, 2002, 66, 030101. [41] A. V. Rawlins, Exog. Dermatology, 2004, 3, 57-71. [42] A. C. Park, C. B. Baddiel, J.Soc.Cosmet.Chem, 1972, 23,
3-12.
[43] A. C. Park, C. B. Baddiel, J.Soc.Cosmet.Chem, 1972, 23, 13-21.
[44] D. El Masri, G. Brambilla, M. Pierno, G. Petekidis, A. Schofield, L. Berthier and L. Cipelletti, J. Stat. Mech., 2009, P07015
[45] XXX brambilla prl 10
[46] L. Ramos, D. Roux, P. D. Olmsted and M. E. Cates,
Europhys. Lett., 2004, 66, 888-894.
[47] L. Ramos and L. Cipelletti, Phys. Rev. Lett., 2001, 87, 245503.
[48] L. Ramos and L. Cipelletti, Phys. Rev. Lett., 2005, 94, 158301.
[49] S. Mazoyer, L. Cipelletti and L. Ramos, Phys. Rev. Lett., 2006, 97, 238301.
[50] S. Mazoyer, L. Cipelletti and L. Ramos, Phys. Rev. E, 2009, 79, 011501-011510.
[51] A. Mourchid, A. Delville, J. Lambard, E. Lecolier and P. Levitz, Langmuir, 1995, 11, 1942-1950.
[52] A. Knaebel, M. Bellor, J.-P. Munch, V. Viasnoff, F. Lequeux and J. L. Harden, Europhys. Lett., 2000, 52, 73-79.
[53] S. T. Bramwell, K. Christensen, J.-Y. Fortin, P. C. W. Holdsworth, H. J. Jensen, S. Lise, J. M. Lopez, M. Nicodemi, J.-F. Pinton and M. Sellitto, Phys. Rev. Lett., 2000, 84, 3744-3747.
[54] Skin Moisturization, Edited by Anthony V. Rawlings, James J. Leyden, Marcel Dekker Inc. 2002.
[55] S. Jabbari-Farouji, M. Atakhorrami, D. Mizuno, E. Eiser, G. H. Wegdam, F. C. MacKintosh, D. Bonn and C. F. Schmidt, Phys. Rev. E, 2008, 78, 061402.
[56] The data G′ = 300 Pa and G′/G′′ = 20 taken from
Ref. [55] are for a suspension at 3.2 wt%, instead of 3.5 wt% as in our experiments. From Ref. [55], we estimate that the elastic modulus increases by a factor ∼ 1.5 when the concentration increases from 3.2 wt% to 3.5 wt%. [57] T. Gisler and D. A. Weitz, Phys. Rev. Lett., 1999, 82,
1064.
[58] A. H. Krall and D. A. Weitz, Phys. Rev. Lett., 1998, 80, 778.
[59] The moduli of the very diluted colloidal gel studied here (ϕ = 6 × 10⁻⁴) are too weak to be measured by
me-chanical rheology. Estimates of the elastic modulus vary between 4.4 × 10⁻⁴ Pa and 1.5 × 10⁻³ Pa depending on
wether they are obtained form DLS measurements [58] or by extrapolating mechanical rheology data [57] taken at larger ϕ. In Table I, we use data at ϕ = 8.9 × 10⁻³
from Ref. [57] to estimate G′/G′′.
[60] T. G. Mason and D. A. Weitz, Phys. Rev. Lett., 1995, 75, 2770.
[61] In order to account for the difference in particle size (a = 105 and 210 nm in Refs. [20] and [60], respectively), in Table I we multiply the G′data of Ref. [60] by a factor
(210/105)3
, due to the scaling G′
∼ KBT /a 3
. Note that the density of our most concentrated hard sphere sample is higher than that of the densest suspension studied in Ref. [60], even when considering the difference in ϕc.
Ac-cordingly, the values of G′and G′/G′′reported in Table I
should be regarded as lower bounds.
[62] P. N. Segre, S. P. Meeker, P. N. Pusey and W. C. K. Poon, Phys. Rev. Lett., 1996, 77, 585-585.
[63] A. Zaccone, H. Wu and E. Del Gado, Phys. Rev. Lett., 2009, 103, 208301.
[64] J. Brujic, S. F. Edwards, D. V. Grinev, I. Hopkinson, D. Brujic and H. A. Makse, Faraday Discuss., 2003, 123, 207-220.
[65] D. Sessoms, H. Bissig, A. Duri, L. Cipelletti and V. Trappe, Soft Matter, 6, 3030, 2010.