Publisher’s version / Version de l'éditeur:
Vous avez des questions? Nous pouvons vous aider. Pour communiquer directement avec un auteur, consultez la
première page de la revue dans laquelle son article a été publié afin de trouver ses coordonnées. Si vous n’arrivez pas à les repérer, communiquez avec nous à PublicationsArchive-ArchivesPublications@nrc-cnrc.gc.ca.
Questions? Contact the NRC Publications Archive team at
PublicationsArchive-ArchivesPublications@nrc-cnrc.gc.ca. If you wish to email the authors directly, please see the first page of the publication for their contact information.
https://publications-cnrc.canada.ca/fra/droits
L’accès à ce site Web et l’utilisation de son contenu sont assujettis aux conditions présentées dans le site LISEZ CES CONDITIONS ATTENTIVEMENT AVANT D’UTILISER CE SITE WEB.
Interflam 2004: 10th International Fire Science & Engineering Conference
[Proceedings], pp. 233-244, 2004-07-01
READ THESE TERMS AND CONDITIONS CAREFULLY BEFORE USING THIS WEBSITE.
https://nrc-publications.canada.ca/eng/copyright
NRC Publications Archive Record / Notice des Archives des publications du CNRC : https://nrc-publications.canada.ca/eng/view/object/?id=48969798-ba49-43ff-84e2-5bf9299d7fde https://publications-cnrc.canada.ca/fra/voir/objet/?id=48969798-ba49-43ff-84e2-5bf9299d7fde
NRC Publications Archive
Archives des publications du CNRC
This publication could be one of several versions: author’s original, accepted manuscript or the publisher’s version. / La version de cette publication peut être l’une des suivantes : la version prépublication de l’auteur, la version acceptée du manuscrit ou la version de l’éditeur.
Access and use of this website and the material on it are subject to the Terms and Conditions set forth at
Structural response modelling of wood-joist floor assemblies exposed
to fires
Structural response modelling of wood-joist floor assemblies
exposed to fires
Bénichou, N.
NRCC-46750
A version of this document is published in / Une version de ce document se trouve dans :
Interflam 2004 – 10
thInternational Fire Science & Engineering Conference,
Edinburgh, Scotland, July 5-7, 2004, pp. 233-244
STRUCTURAL RESPONSE MODELLING OF
WOOD-JOIST FLOOR ASSEMBLIES EXPOSED TO FIRES
Noureddine Benichou
Institute for Research in Construction National Research Council of Canada Ottawa, Ontario, Canada, K1A 0R6
ABSTRACT
This paper describes the theoretical framework of a structural response model, which predicts the time to failure and deflection of structurally-loaded wood-joist floor assemblies. The paper also illustrates an example of a simulation that compares experimental results with analytical predictions.
INTRODUCTION
In North America, lightweight wood-framed assemblies are commonly used in the construction of walls and floors of compartments of multi-occupancy residential buildings. Wall and floor assemblies are required to have adequate fire resistance so that the fire is contained within the compartment of fire origin for a specified duration of time. This containment will delay fire spread to adjacent compartments, as well as provide for safe evacuation and rescue operations. The fire resistance can be determined using test methods. In fire resistance testing, the current practice in North America is to subject an assembly to a fire test conducted in accordance with procedures outlined in standards, namely CAN/ULC-S101-M891 and ASTM E1192. The fire resistance for specific load-bearing and non-load-bearing assemblies can also be determined using reference to ready-to-use tables or design procedures such as the component additive method found in the National Building Code of Canada3. Finally, the fire resistance can be evaluated using validated numerical models, which are becoming available with the advent of performance-based codes.
To simulate the fire resistance behaviour of wood-frame assemblies, it is essential to evaluate their thermal and structural responses when exposed to fires. The thermal response gives estimates of the temperature distribution in the assembly. The structural response calculates the structural failure of an assembly, based on this temperature distribution.
As part of a strategic research project, the National Research Council of Canada (NRC) has developed an analytical model to predict the structural fire response of lightweight wood-joist floor assemblies exposed to fires. This paper describes the theoretical framework of the structural response model, which predicts the time to failure and deflection of floor assemblies. The paper also presents a simulation comparing experimental results with model predictions.
BEHAVIOUR OF WOOD-JOIST FLOORS UNDER FIRE EXPOSURE
The behaviour of wood-joist floors when exposed to fire depends on several key factors: the layers of gypsum board separating the wood joists from the flames, the insulation between the joists, the material properties of the wood joists, and the temperatures to which the assembly is subjected. The temperature will increase in the gypsum first, followed by an increase in the joists. At temperature levels ranging between 280°C and 300°C, the wood will begin to char, causing joists deflection towards the fire. In assemblies with one layer of gypsum board, this will cause gaps in the gypsum board joints to form, allowing even more heat to reach the joists. As the wood chars further
and the cross-section of the joists decreases, the deflection will increase and the joist resistance will decrease until the overall assembly fails.
DESCRIPTION OF THE MODEL
The fire resistance of a wood-joist floor assembly is determined by the thermal and structural performance of the floor when exposed to fire. A floor assembly subjected to high temperatures can fail in three ways: structural failure due to excessive load or deflection, flame penetration through the sub-floor, or excessive temperatures on the unexposed side of the assembly. For floor assemblies, structural failure usually governs. When the stresses caused by the applied load exceeds the physical resistance of the joist, it will fail. In addition, when the span/deflection ratio drops below a certain value (usually < 30), it is said that the joist has failed due to deflection. The structural response model determines the degradation of the mechanical properties of joists at elevated temperatures, cross-section reduction, the deflection of the joist, and the time to structural failure of the assembly.
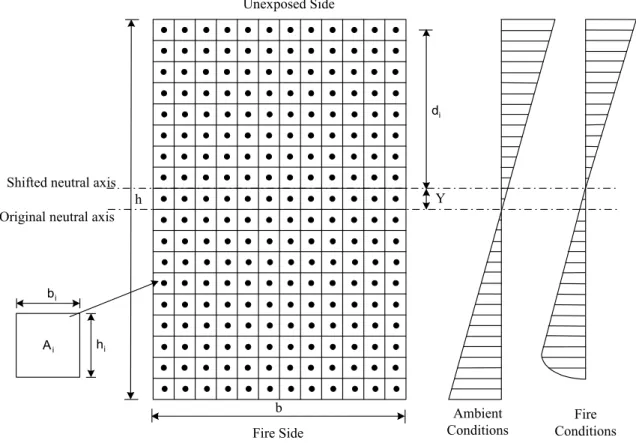
To perform the structural response calculation, the joist cross-section is divided into a number of elements in both directions (see Figure 1). The calculation of mechanical properties, inertia, moments and deflection are described in the following sections.
Fire Side Unexposed Side
Original neutral axis Shifted neutral axis
Y i d i b i h i A b h Ambient Conditions Fire Conditions
Figure 1. Cross-Section Division Diagram and Stress Diagrams
Moment Applied on the Joist
Assuming that the joist is a simply supported member with a uniform distributed load, the bending moment applied to the joist can be calculated using the following equation:
2 wx 2 wLx ) x ( M 2 − = [1]
Where M(x) is the applied moment, w is the uniform distributed load, L is the length of the joist, and x is the current position along the length. Since the equation above describes an inverted parabola, there is a maximum located at L/2. The midpoint on the joist is consequently the weakest location because the applied moment is the greatest. At L/2:
8 wL M
2
max = [2]
Resisting Moment of the Joist
The internal forces of the wood-joist allow it to resist an applied moment up to a certain value. The magnitude of the resisting moment is dependent on the yield stresses in both tension and compression. When loaded from above, the joist will be in tension below the neutral axis and in compression above the neutral axis. Since the corresponding yield stresses run in the axial direction of the joist, and in opposite directions, they create a couple around the neutral axis. The following equations govern the resisting moment relationship:
∑
= σ = m 1 i i i Ti RT *A *d M [3]∑
= σ = m 1 i i i Ci RC *A *d M [4] [5] RC RT R M M M = +Where MRT is the resisting moment due to tensile stresses, σTi is the element tensile yield stress, MRC
is the resisting moment due to compressive stresses, σCi is the element compressive yield stress, Ai is
the element area, and di is the distance from the centroid of the element to the neutral axis. The value
of di for each element changes with time and is determined by computing the shift Y (distance from
the original neutral axis to the current neutral axis) at every time step.
Yield
stresses for the
current time stepWood-joist assemblies are commonly subjected to both tensile and compressive forces, and consequently there are tensile and compressive stresses that can be found internally in the joist. Yield stress is the point when the forces loading the member exceed the elastic range, and will cause permanent deformation. The tension and compression yield stresses are affected by temperature according to the following linear relationships4:
(
)
− − σ = σ 345 20 T 1 * i 0 T Ti [6](
)
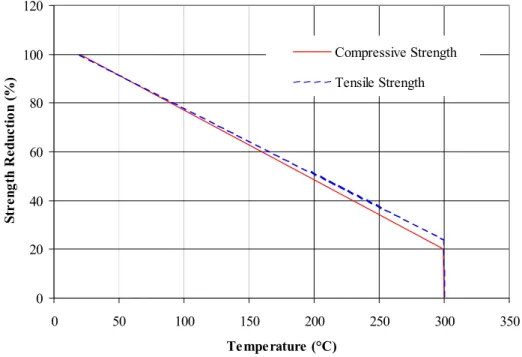
− − σ = σ 370 20 T 1 * i 0 C Ci [7] [8] C 300 T T for 0 char Ci Ti o = ≥ = σ = σWhere σTi is the element tensile yield stress at temperature Ti, σT0 is the tensile yield stress at ambient
yield stress at ambient temperature. Figure 2 shows the curve describing both tensile and compressive yield stresses of wood as a function of temperature (shown in Equations [6], [7] and [8]).
0 20 40 60 80 100 120 0 50 100 150 200 250 300 350 Te mpe rature (°C) S tr e ng th R e du c ti o n ( % ) Compressive Strength Tensile Strength
Figure 2. Yield Stress of wood as a function of temperature
Position of the neutral axis for the current time step
Once wood elements begin to char, the neutral axis of the joist will change position (moves up provided that the exposure is from below). The new position of the centroid can be calculated with the following equation:
[9] 0 A * ) ( m 1 i i Ci Ti +σ = σ
∑
=Once the location of the neutral axis is found, the value of the distance Y (see Figure 1) can be determined.
Deflection of the Joist
There are two main factors that affect the deflection of the beam (joist): loading and eccentricity of the surface of the joist.
Deflection due to load
The curvature of a beam (joist) is related to the bending moment applied to the joist and the rigidity of the material, as follows:
EI ) x ( M dx y d 1 2 2 = = ρ [10]
Substituting for the applied moment due to a uniformly distributed load in Equation [10] and integrating it twice gives the following relationship for the deflection:
2 1 4 3 C x C 24 wx 12 wLx y * ) EI ( = − + + [11]
The constants of integration (C1 and C2) can be determined by defining the boundary conditions for
the joist. For a typical joist, the deflection at each end of the beam is zero, so when x = 0 or L, y = 0. Using these values, the overall deflection due to the uniform distributed load is:
(
x 2Lx L x * EI 24 w ) x ( y = − 4 + 3 − 3)
[12]Where y(x) is the deflection, w is the distributed load, E is the modulus of elasticity defined below, I is the moment of inertia defined below, x is the position on the joist and L is the length of the beam (joist). The midpoint on the joist is the location of the maximum deflection. At L/2:
EI 384 L w 5 y 4 max = [13]
Modulus of elasticity for the current time step
The modulus of elasticity is a function of temperature, so in order to calculate the corresponding overall E value, the temperature-dependent value is taken for each remaining element of the cross-section of the joist.
∑
∑
= = = m 1 i i m 1 i i i A A * E E [14]In Equation [14], E is the average modulus of elasticity of the cross-section, Ai is the area of a single
element, and Ei is the modulus of elasticity of a single element at temperature T, given by the
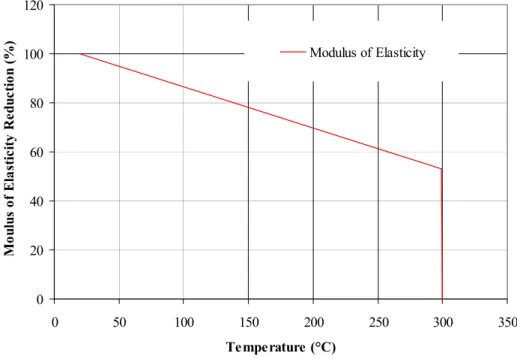
following equations: − − = char i 0 i T * 2 20 T 1 * E E [15] [16] C 300 T T for 0 Ei = ≥ char = o
Where Ti is the element temperature, Tchar is the charring temperature of an element, and E0 is the
modulus of elasticity at ambient temperature. Figure 3 illustrates the relationship defined by Equation 15, and assumes that Tchar is 300°C.
0 20 40 60 80 100 120 0 50 100 150 200 250 300 350 Te mperature (°C) M o u lu s o f El a sti c ity R e d u c ti o n (%) Modulus of Elasticity
Figure 3. Modulus of elasticity of wood as a function of temperature
Moment of inertia for the current time step
The moment of inertia is dependent on the geometry of the cross-section of the joist. Once elements begin to char, the neutral axis of the joist will change position, affecting the value of the moment of inertia. The value of the moment of inertia can then be calculated using the following equation:
∑
= + = m 1 i i 2 i 3 i i*h d *A b * 12 1 I [17]Where I is the moment of inertia, bi is the width of each element, and hi is the height of each element.
The distance di denotes the vertical distance from the element centroid to the neutral axis, and Ai
represents the area of each element.
Rigidity for the current time step
The model calculates the rigidity (product of the modulus of elasticity and the moment of inertia), for each joist in the floor, as follows:
(
)( )
[
i m 1 i 2 i i i i m 1 i 3 i i E b *h d E 12 h * b EI∑
∑
= = + =]
[18]Where bi is the element width, hi is the element depth, di is the distance from the element centroid to
the neutral axis, and Ei is the temperature-dependent modulus of elasticity of the element.
Deflection due to initial joist surface eccentricity
In addition to the deflection due to the loading, the eccentricity of the surface of the wood affects the deflection of the joist. In general, the eccentricity can be expressed with a sinusoidal equation:
π = L x sin * e ye [19]
Where ye is the magnitude of the deflection caused by eccentricity, e is the maximum eccentricity, x is
the position along the joist, and L is the length of the joist.
Overall deflection
The overall deflection of a joist can be described as the sum of the deflections due to load and eccentricity. If the downward direction is assumed to be positive, then the load and eccentricity will cause positive deflections. Consequently, the overall deflection ∆ at any given point can be expressed as:
[20]
e maz y y + = ∆Thermal Effects on the Joist
When temperatures above ambient are applied to wood, there could exist an internal thermal change of the material. In general, when temperatures are increased, the wood will have a tendency to expand outward in all directions by a small amount. However, if the wood is restrained at both ends, this will cause internal forces that are equal and opposite to the thermal expansion forces, which run in the axial direction. At each element (shown in Figure 1), a thermal force is created, which in turn creates a moment about the neutral axis. The total moment from all of these forces causes a deflection similar to the distributed load, but in the opposite direction. This has not been accounted for in this model yet, as further research is needed to quantify these factors.
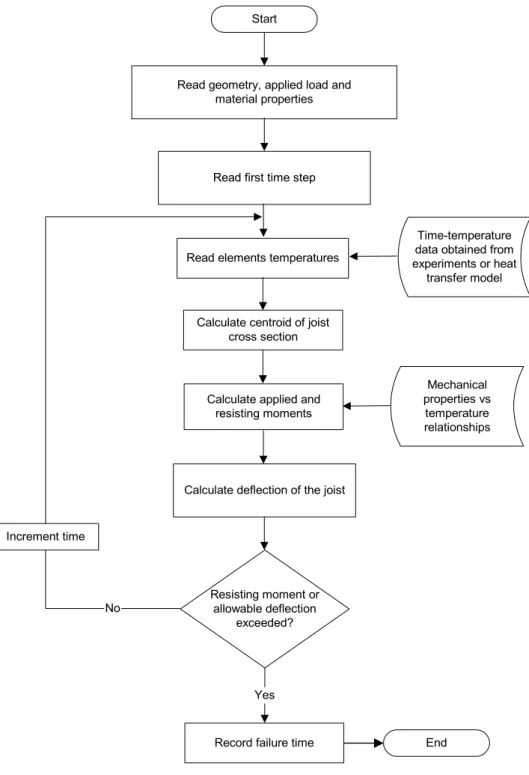
SOLUTION PROCEDURE
Details of the solution procedure used by the model are shown in Figure 4. The user begins by inputting the physical characteristics of the joist, followed by the time-temperature data for each element and time step. Once the model has begun the calculations, it will determine the new material properties based on the current temperature of each element. As the temperature increases, the strength of the joist will decrease because the material properties become weaker and the elements char due to elevated temperatures. The model will loop until the end time occurs, which is defined by the time-temperature input data.
As the joist weakens, if the applied load ever exceeds the overall resistance of the beam, the model will record the time step in which the structural failure occurred. Similarly, if the deflection exceeds a certain allowable value, that time will also be recorded. The first of these two events to occur will signify the time to failure of the assembly.
Read geometry, applied load and material properties
Yes
Read elements temperatures
Calculate applied and resisting moments
Resisting moment or allowable deflection
exceeded?
Calculate deflection of the joist
No
Start
End Calculate centroid of joist
cross section Read first time step
Mechanical properties vs
temperature relationships Time-temperature data obtained from experiments or heat
transfer model
Increment time
Record failure time
Figure 4. Structural Response Model Flow Chart
MODEL PREDICTIONS AND COMPARISON WITH EXPERIMENTAL DATA
In order to verify the validity of the model, it is necessary to compare the predictions with experimental data. At this stage, one test was used to evaluate the predictions by the fire resistance model. Details of the wood-joist properties are shown in Table 1. By using the same physical properties of the joists used in the test, the model will determine the time to failure and the deflection at each time step, which can then be compared to the experimental results. For this test, temperatures on the unexposed sides did not reach the temperature failure criterion, as the assembly failed by structural instability at 41 min.
Table 1. Wood Joist Properties
Property Value Units
Width 38 mm
Height 235 mm
Length 3874 mm
Load (per joist) 2080 N/m Charring Temperature 300 °C Initial Maximum Eccentricity 1 mm Ambient Modulus of Elasticity 7000 MPa Ambient Tensile Strength 25 MPa Ambient Compressive Strength 25 MPa
Charring at the 40-min Time Step
The joist begins charring as soon as a single element reaches the charring temperature. While there is still wood physically present in the element after charring occurs, the material properties are said to have reached a point where that element no longer adds to the strength of the joist, and can therefore be disregarded in calculations. Figure 5 shows a diagram depicting typical charring in a cross-section of the joist at 40 min based on the input temperatures from the experimental data.
Figure 5. Charring Diagram of the Joist
Structural Failure of Joist
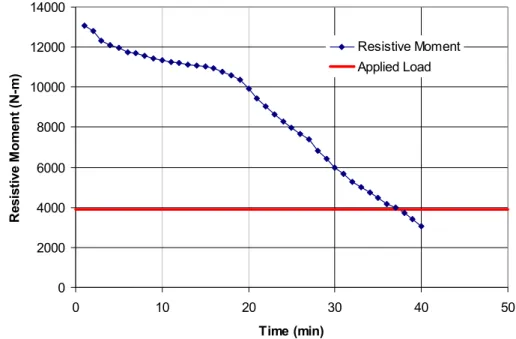
To measure the performance of the structural response model, the predictions of the structural fire resistance and deflection at mid-length are evaluated. Figure 6 illustrates the moment resistance versus time as predicted by the structural response model, for the floor assembly. The fire resistance decreases with increasing time because the value of the mechanical properties decreases with time and the cross-section of the joists reduces after charring. The intersection of the horizontal line, at the level of the applied moment, with the moment resistant curve, represents the theoretical time to
structural failure of the wall. The time-to-structural failure is about 37 min for the floor assembly, while the time to structural failure measured experimentally is 41 min. The difference between the analytical and experimental failure is 10% on the conservative side.
0 2000 4000 6000 8000 10000 12000 14000 0 10 20 30 40 5 Time (min) R e si st ive M o men t (N -m ) 0 Resistive Moment Applied Load
Figure 6. Resistive Moment Graph
Deflection of the Joist
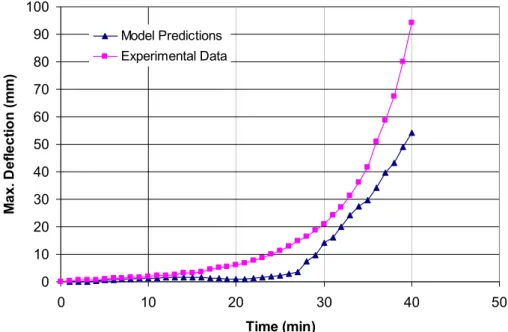
The maximum mid-length deflections are also plotted versus time for both the analytical predictions and the test results; see Figure 7. As shown in the figure, the deflection is very small in the first 25 min. After this point, the model predictions and the test measurements start increasing at a faster rate. The trend in the rate of increase in the model predictions is similar to that of the test results. The difference in the predictions may be due to the definition of change of mechanical properties with temperature and the nominal values of the mechanical properties, which could be different than the actual value of the joists tested. The model also checks to see if the joist fails due to excessive deflection, which is set to occur when the span/deflection < 30 (L/y<30). For this test, the values for L/y before and after the joist fails are greater than 30. Consequently, this indicates that the joists failed due to load first, and not due to deflection.
0 10 20 30 40 50 60 70 80 90 100 0 10 20 30 40 Time (min) M ax . D e fl ect io n ( m m ) 50 Model Predictions Experimental Data
Figure 7. Maximum Deflection Graph
CONCLUSIONS AND FUTURE WORK
This paper described a model for the prediction of the fire resistance of lightweight wood-frame floor assemblies exposed to standard fires. As this stage of the development, the model deals only with the structural response, while the temperature profiles are input by the user from existing experimental data. The structural response is based on the evaluation of moment resistance of a simply supported beam, and predicts the time to structural failure of assemblies, taking into account the reduction in mechanical properties with elevated temperatures, as well as the shift of neutral axis towards the cooler region of the cross section with time. It also calculates the deflection along the joists, taking into account the change in flexural rigidity with elevated temperatures. Comparison of the structural failure time and the deflection as predicted by the model, with the results of one experimental full-scale floor test exposed to the ASTM E1191 fire, show reasonable agreement.
Despite the underestimation of the deflection, the theoretical time to structural failure was found to be 37 min compared to 41 min for the experimental results. This indicates that the model achieved a 10% error in terms of time until failure, which is within an acceptable range and conservative. Although the current fire resistance model requires further refinement, it is suitable to assess the time to failure of load-bearing wood-frame floor assemblies for practical applications, using both the flame penetration and structural failure criteria.
To improve the current model, it needs to be coupled with a heat transfer model to form a new fire resistance model that can predict the whole spectrum of failure criteria: insulation failure, flame penetration failure and structural failure. The model will require further validation against additional experimental data that will include exposing full-scale wood-joist floors to both standard and non-standard fires. In addition, a sensitivity analysis will be carried out on the effects of thermal and mechanical properties of wood, gypsum board and insulation. The thermal properties include thermal conductivity, specific heat, mass loss and thermal expansion, while the mechanical properties include the modulus of elasticity, yield strength and stress-strain relationships for wood. The effects of applied loads and temperatures on the fire resisting moment and deflection will also be assessed.
REFERENCES 1
CAN/ULC-S101-M89, 1989, Standard Methods of Fire Endurance Tests of Building Construction and Materials, Underwriters' Laboratories of Canada, Scarborough, Canada.
2
ASTM E119, 1995, Standard Methods of Fire Tests of Building Construction and Materials, American Society for Testing and Materials, Philadelphia, USA.
3
Canadian Commission on Building and Fire Codes, 1995, National Building Code of Canada, IRC, NRC, Ottawa, Canada.
4
Lie, T.T., (Editor), 1992, Structural Fire Protection, American Society of Civil Engineers, Manuals and Reports on Engineering Practice No. 78.