HAL Id: hal-02456675
https://hal.archives-ouvertes.fr/hal-02456675
Submitted on 27 Jan 2020HAL is a multi-disciplinary open access archive for the deposit and dissemination of sci-entific research documents, whether they are pub-lished or not. The documents may come from teaching and research institutions in France or abroad, or from public or private research centers.
L’archive ouverte pluridisciplinaire HAL, est destinée au dépôt et à la diffusion de documents scientifiques de niveau recherche, publiés ou non, émanant des établissements d’enseignement et de recherche français ou étrangers, des laboratoires publics ou privés.
Preliminary results from the LMJ-PETAL experiment
on hot electrons characterization in the context of Shock
Ignition
S. Baton, A. Colaitis, C. Rousseaux, G. Boutoux, S. Brygoo, L Jacquet, M.
Koenig, D. Batani, A. Casner, E. Le Bel, et al.
To cite this version:
S. Baton, A. Colaitis, C. Rousseaux, G. Boutoux, S. Brygoo, et al.. Preliminary results from the LMJ-PETAL experiment on hot electrons characterization in the context of Shock Ignition. High Energy Density Physics, Elsevier, 2020, 36, pp.100796. �10.1016/j.hedp.2020.100796�. �hal-02456675�
Preliminary results from the LMJ-PETAL experiment
on hot electrons characterization in the context of Shock Ignition
S.D. Batona*, A. Colaïtisb, C. Rousseauxc, G. Boutouxc, S. Brygooc, L. Jacquetc, M. Koeniga, D. Batanib, A. Casnerb, E. Le Belb,d, D. Raffestinb, V. Tikhonchukb, J. Trelab, C. Reverdinc, L.
Le-Deroffd, W. Theobalde, G. Cristoforettif, L. A. Gizzif, P. Koesterf, L. Labatef, K. Shigemorig
a Laboratoire pour l’Utilisation des Lasers Intenses, LULI, CNRS-Ecole
Polytechnique-CEA-Sorbonne Universités, UMR 7605, F-91128 Palaiseau, France
b Centre Lasers Intenses et Applications, CELIA, Université de Bordeaux-CNRS-CEA, UMR 5107,
F-33405 Talence, France
c CEA, DAM, DIF, F-91297 Arpajon, France d CEA, DAM, CESTA, F-33114 Le Barp, France
e Laboratory for Laser Energetics, University of Rochester, Rochester, New York 14623, USA f Intense Laser Irradiation Laboratory,CNR-INO, Pisa, Italy
g Institute of Laser Engineering, University of Osaka 565-0871, Japan
Abstract
In the Shock Ignition scheme, the spike pulse intensity is well above the threshold of parametric instabilities, which produce a considerable amount of hot electrons that could be beneficial or detrimental to the ignition. To study their impact, an experiment has been carried out on the LMJ-PETAL facility with a goal to generate a strong shock inside a plastic layer under plasma conditions relevant to full-scale shock ignition targets. To evaluate the effect of hot electrons on the shock characteristics, laser temporal smoothing was either switched on or off, which in turns varies the quantity of hot electrons being generated. In this paper, we present preliminary results obtained during the experiment dedicated to the hot electron characterization. We present also calculations for the second part of the experiment, scheduled in 2020 and focused on the shock characterization. Keywords: inertial confinement fusion, shock ignition, parametric instabilities, hot electrons 1. Introduction
Shock Ignition is an alternative scheme of direct-drive Inertial Confinement Fusion (ICF) to achieve high energy gains through reduced required laser energy. Contrary to the conventional hot-spot ignition scheme, shock ignition concept separates the compression and ignition phases [1, 2]. The target is first compressed at low velocity and low isentropic fuel assembly, and then ignited using a strong convergent shock launched with a high intensity laser pulse, the so-called spike [3-5]. In order to reach the required shock pressure of ~ 300 Mbar, the laser intensity of the spike has to reach 5×10¹⁵ to 1016 W/cm2. At these intensities, the Laser-Plasma Instabilities (LPIs), Stimulated Raman and Brillouin scatterings, SRS and SBS respectively, and Two Plasmon Decay instability (TPD), are activated since their thresholds are largely exceeded. There are two major consequences of these LPIs: (i) energy losses for SRS and SBS and (ii) hot
electron production for SRS and TPD; the latter significantly contribute to the absorbed laser
energy [6,7]. While this scheme is promising due to the lower required laser energies, an open
question concerns the beneficial or detrimental effects of the hot electrons. Too energetic hot electrons may preheat the compressed target or increase the hot-spot mass prematurely. Conversely, if the hot electron temperature is sufficiently low or if the shell areal density is large enough, the electrons are stopped in the outer region of the shell and thus strengthen the shock. Experiments, performed on the OMEGA facility, and numerical simulations using state-of-the-art tools have confirmed both the beneficial and detrimental aspects of the hot electrons depending on their energies and the time when they are generated [8-12].
In this paper, we present preliminary results of the experiment dedicated to characterization of hot electron production and also numerical simulation for the second part of experiment, which will be dedicated to the shock characterization. The experiment was performed on the LMJ-PETAL facility [13,14] in planar geometry. As parametric instabilities are very sensitive to local laser intensities, the amount of hot electrons is expected to considerably depend on the optical smoothing of laser beams. Thus, the experiment has been performed in two configurations with and without activating Smoothing by Spectral Dispersion (SSD) [15].
2. Experimental setup
The experiment used the three LMJ quads 28U & L, and 29U at 351 nm, delivering a total energy of 20 kJ. The configuration of these quads in the experimental chamber are located by spherical coordinates (θ, φ), where θ is the polar angle and φ the azimuthal angle, which are the following for 28U (33.2°, 81°), 28L (131°, 81°), 29U (49°, 63°). The North Pole corresponds to θ=0° and the target normal is at 58° in the equatorial plane. The quads were incident on target obliquely as shown in Fig. 1a. The irradiation configuration, not optimal for shock generation due to large angles of incidence, was defined by the available quads on the LMJ-PETAL facility in 2019.
The three quads were equipped with small-spot continuous phase plates in order to reach high laser intensity. The focal spot of each quad is Gaussian with a radius around 300 µm at 3% of peak intensity. The overlap of the three quads was expected to produce a peak intensity of 7×10¹⁵ W/cm2 on target, taking into account the incidence angles of the laser beams. Two phase modulators at 2 GHz and 14 GHz were incorporated in the front-end laser: the 2 GHz modulation was used to control the Brillouin effect in optics, and the 14 GHz modulation was dedicated for laser intensity smoothing on target and LPI mitigation. In what follows, the term of Smoothing by Spectral Dispersion (SSD) refers to the 14 GHz modulation. The pulse shapes of the quads are shown in Fig. 1b: a low-power prepulse of ~ 3 ns for producing a long scale length plasma with shock ignition relevant conditions followed by a high-power spike of 1.3 ns duration to launch a strong shock and generate hot electron population.
Fig. 1. Schematic drawing of the target at (90°, 148.5°) corresponding to the view of the target in the equatorial plane, perpendicularly to the propagation axis of the shock (a); power shape of each of three quads (b).
The target was made of three parts (Fig. 1a): (i) a 100 µm plastic (CH) ablator to absorb the incident laser light, (ii) three layers, Cu/Ag/Mo 5 µm thickness each, used as a fluorescence tracer to diagnose hot electrons via Kα line emission, and (iii) a 3 mm plastic (CH) layer to diagnose the shock propagation. Finally, an Au shield prevents diagnostics from strong emission of the coronal plasma.
Three sets of diagnostics were implemented for the following purposes:
(i) the level of parametric instabilities was assessed with the FABS (Full Aperture Backscattered System). The FABS analyzes backscattered light in the focusing cone of 28U with two spectrometers for separate measurements of SRS and SBS, with a temporal resolution of 100 ps. The backscattered power, in the focusing cone of 28U, in the [375-750 nm] range for SRS and [346-356 nm] for SBS, was also recorded by photodiodes. The FABS diagnostic built for LMJ is similar to the one used on the Ligne d'Intégration Laser facility at CEA. More details can be found in Ref. [16]. Because of the specific geometry of laser irradiation (Fig. 1a), the light recorded by the photodiode includes not only the SBS light from the quad 28U but also the reflected and scattered light coming from the opposite quad 28L and more marginally from the quad 29U; these two parts together contribute to the energy loss of the incident laser. Although TPD instability was expected to develop, no dedicated visible or UV-light diagnostics were available in the experiment.
(ii) the hot electron population was characterized with two X-ray diagnostics, SPECTIX and CRACC-X. SPECTIX [17] is a hard X-ray spectrometer dedicated to K-shell spectroscopy in the [6-100 keV] range using spherical crystals in transmission. SPECTIX was located in the equatorial plane (polar angle 90°), perpendicularly to the front face of the target. CRACC-X is a compact Bremsstrahlung cannon (BSC) located in the equatorial plane, at 58° from the shock propagation axis. It consists of a stack of Imaging Plate (IP) disks alternated with attenuating filters of different thicknesses and materials (Al, Ti, Cu, Mo, Ag, Sn, Ta, Au and Pb). The stack was optimized for the experiment with simulations using Monte Carlo codes GEANT4 and Penelope [18,19] in a two-step approach. First, the propagation of hot electrons in the target materials was simulated. Second, the resulting X-ray emission from the target was used as input for simulations of photon energy deposition inside the IP layers of BSC. The main objective of the design was to discriminate the contributions due to SRS and TPD with expected hot electron temperatures 45 and 90 keV, respectively. The design comprises 25 IP
layers alternated with filters. The first filter in front of BSC was split in two semicircles (one semicircle made of 2 mm of Al and another of 2 mm of Mo) creating two channels with different attenuation, thus enabling detection for a wider range of photon flux.
(iii) the shock propagation is observed with GXI-1 [20]. GXI-1 is a hard X-ray imager coupled to a framing camera with 2×4 time-resolved toroidal mirror channels and 4 pinhole channels. Exposure time of each channel is 130 ps. This diagnostic, located transversely to the shock propagation axis, has been used for X-ray radiography of the shock progression. For the backlighter source at ~ 6.7 keV, we used a Heα emission of a Fe foil irradiated by two supplementary quads (17U & L).
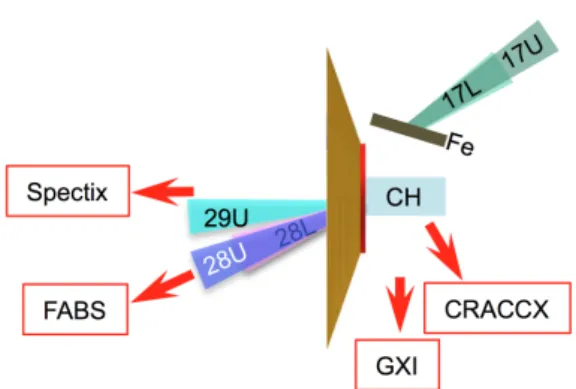
The schematic experimental set-up is shown in Fig. 2.
Fig. 2. Schematic experimental set-up with the different diagnostics and quads (view from the North Pole, θ=0°).
More details on these diagnostics (FABS, SPECTIX and GXI) and the LMJ-PETAL facility are given in the user guide available on the LMJ facility web site [21].
3. Experimental results
For the first part of the experimental campaign, three shots have been done: the first two shots without SSD, where the highest amounts of LPI-generated hot electrons were expected, and the third shot with SSD enabled, was intended to reduce the hot electron production. Here, we discuss only the characterization of parametric instabilities and associated hot electrons.
Table 1 summarizes the peak laser power for each shot. The on-target intensity was lower than expected, around 2.5×10¹⁵ W/cm2 FWHM or 3.5×10¹⁵ W/cm2 of peak intensity.
Shot #1 w/o SSD Shot #2 w/o SSD Shot #3 with SSD Ppeak (TW) 10.7 9.7 10.1
3.1 Results from FABS
Figure 3a shows SRS spectrum as a function of time for the shot #2 without SSD. (The black line near 530 nm in the spectrum is due to the cut-off of the color filter used to prevent unconverted 2ω light seen by the FABS diagnostic.) Figure 3b shows the corresponding spectrally integrated line-out of the SRS spectrum for the shot #2 as well as the laser power; both are normalized to their respective maximum. Figure 3c presents the similar line-out for the shot #3, with SSD.
Fig. 3. (a) Time-resolved SRS spectrum for the shot #2 (without SSD). The two graphs show the spectrally integrated SRS signals from the streaked spectra (blue solid line) for shot #2 without SSD (b) and shot #3 with SSD (c). In both graphs, the laser power is shown as black dashed line. All signals are normalized to their respective maximum.
Three features are observed: (i) the SRS spectrum in the range between 500 and 600 nm corresponds to electron densities between 0.05 and 0.15 ne/nc, where ne is the electron density and
nc is the critical density for 351 nm light. The spectra from all three shots are similar. Assuming an
electron temperature around 3 - 4 keV, as suggested by the simulation presented in Sec. 4, the spectra show that SRS develops in the density range where the daughter plasma wave is strongly Landau damped, the corresponding kpλD factor is in the range of 0.3 to 0.6 (kp is the wavenumber of
the SRS-driven electron plasma wave and λD is the electron Debye length). These conditions
correspond to the inflation regime of SRS [22], where the electron distribution function is modified so that the Landau damping of plasma wave is reduced, thus allowing SRS to develop; (ii) SRS level recorded during the pre-pulse is lower by a factor of 30 to 70 in comparison with the SRS emission during the spike; (iii) for the shot with SSD, the level of SRS during the pre-pulse was lower. This is also the case during the main spike, which is not visible here due to the normalization but can be clearly seen on the diodes data (see bellow).
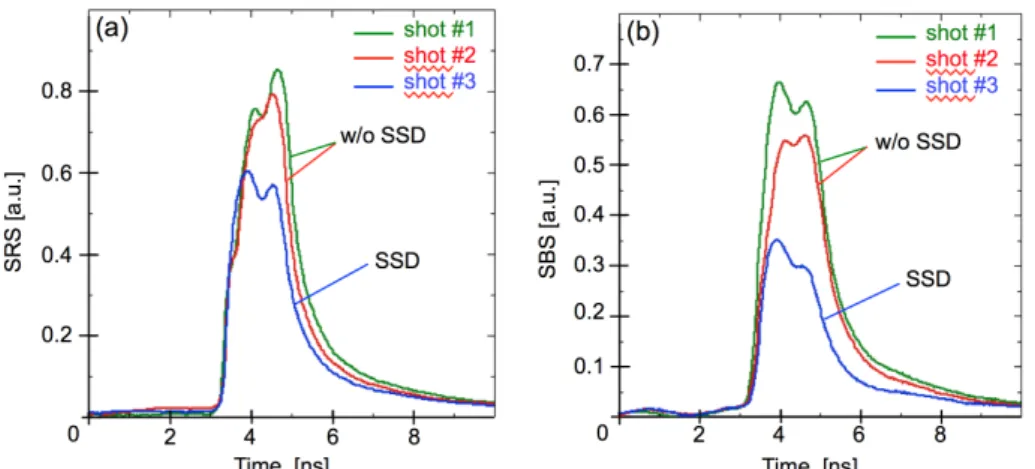
Fig. 4. Power measurements of SRS (a) and SBS (b) in arbitrary units as a function of time in the focusing cone of the quad 28U: without SSD (shot #1 & #2) and with SSD (shot #3). Same filtering and attenuation are used for the three shots.
The effect of SSD on the levels of parametric instability can be assessed from the FABS diodes signals, shown on Fig. 4. The results obtained from shots #1 and #2, without SSD, show comparable levels of SRS and SBS. The shot #2 gives slightly lower SRS and SBS energies due to a smaller laser power, cf. Table 1. For the shot #3, with SSD, decrease of SBS is more significant than for SRS: around ⅓ for SRS and ½ for SBS. Energy calibration of the FABS diagnostic being still underway, absolute SRS and SBS reflectivity values are not yet known.
3.2 Results from SPECTIX
The temporally and spatially integrated X-ray spectra were obtained using SPECTIX diagnostic. Figure 5 shows the spectra recorded on shot #1 by the quartz (10-11) crystal in two ranges of energies and by the LiF (200) crystal above 21 keV. At lower energies (<10 keV), the spectrum is largely polluted by the iron backlighter and by its bremsstrahlung, as can be seen on Fig. 5a. However, the Kα emission lines coming from the three layers (Cu/Ag/Mo) of the main target are unambiguously observed in the two spectra (Fig. 5(a) and 5(b)).
Fig. 5. Temporally and spatially integrated X-ray spectra obtained for shot #1 using SPECTIX in the energy range [7.5 - 10 keV] (a) and [7.5 - 30 keV] (b). Different filters strips (Pd 25µm, Cu 13µm, Ni 10µm) were used to check the energy dispersion relation.
Table 2 shows the absolute measured emissions using the integrated reflectivities of the SPECTIX crystals [17] and the sensitivities of the IP [23]. Then, by performing Monte-Carlo simulations (GEANT4 code with PENELOPE libraries [18,19]) of the electron transport within the target and assuming a single-exponential electron distribution at the entrance of the ablator layer, the comparison of simulated ratio of the Kα emission lines coming from the three layers (Cu/Ag/Mo) with experimental ones allows to infer electron temperature Thot. Note that these simulations assume that
the atoms of the target are cold, mainly that atoms emitting Kα radiation have electrons in their L shell and that the coronal plasma could also contribute to the Cu Kα line emission.
Integral Cu Kα Ag Kα Mo Kα Cu Kα / Ag Kα Cu Kα / Mo Kα
Energy (keV) 8,047 22,16 17,47
Shot #1 (photons/sr) 5.6E+12 2.5E+11 3.45E+11 22.1 ± 2 16.2 ± 1.6
Shot #2 (photons/sr) 2.3E+12 1.2E+11 - 19.9 ± 2 -
Shot #3 (photons/sr) 5.0E+12 2.3E+11 - 21.6 ± 2 -
Table 2. Experimental Kα emission fluence coming from the three layers (Cu/Ag/Mo)
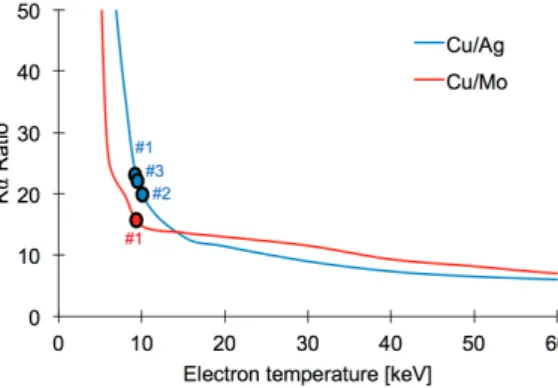
As shown on Fig. 6, the measured Kα emission lines ratios Cu/Ag (~21) and Cu/Mo (~16) are compatible with a mean energy of hot electrons Thot ~ 10 keV ± 2 keV. In shot #2 and in shot #3 the
ratio Cu / Mo were not available.
Fig. 6. Simulation of Kα emission lines ratios Cu/Ag and Cu/Mo as a function of the electron temperature, assuming a single exponential electron energy distribution exp(-E/Thot). Experimental
Kα ratios (full points) are compatible with a hot electron temperature Thot≅ (10 ± 2) keV.
These simulations are preliminary and more investigations to refine the model have to be taken into account.
3.3 Results from CRACC-X
Similarly to SPECTIX, the CRACC-X instrument allows to infer the hot electron spectra in the target by comparing Monte-Carlo simulations to measured spectra. Here we focus on the results (a detailed description of the procedure of analysis of measurements performed with the Bremsstrahlung cannon will be described in a coming paper submitted to Rev. Sci. Instrum.).
Experimental measurements of the energy deposition for each imaging plate and for the three shots are shown in Fig. 7.
Fig. 7. Deposited energy in PSL/pixel as measured in successive IP layers for the Al and Mo channels of the BSC stack for the three shots.
These values were compared with data obtained from Monte-Carlo simulations. A response function base was built using exponential photon distributions for a discrete set of temperatures {Tj}
in the [2 - 200 keV] range, for both Al and Mo filter channels. From the simulations, the deposited energy per incoming photon 𝐸!!!
was obtained for each IP layer l in the BSC stack.
The data was fitted with the simulated response from a three temperature photon distribution, assumed to correspond to a three temperature electron distribution. For each triplet of temperatures from the set {Tj} the sum of the corresponding three response functions was considered to find the
best fitting photon numbers Nj and the WSSR (Weighted Sum of Squared Residuals) of the fit.
Temperatures and photon numbers best fitting the experimental data are displayed in Table 3. The temperature range given in square brackets was evaluated considering the fits resulting in less than 1.5 times the minimum WSSR (Weighted Sum of Squared Residuals).
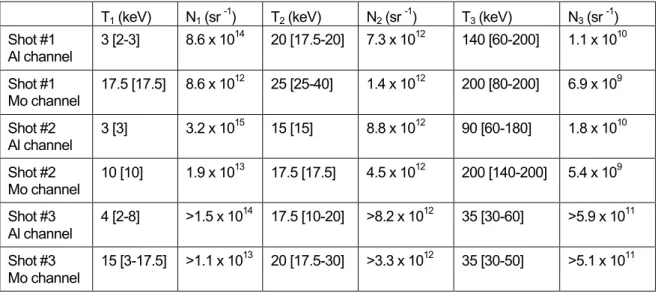
X-ray photon distributions for the first two shots show a high energy component with a temperature in the [60-200 keV] range. A large uncertainty is due to a small photon number in the high-energy component, more than two orders of magnitude less than the photon number at the intermediate temperature. The highest temperature in the third shot is significantly lower (35 keV) and is less affected by errors. The intermediate temperature is in the [15-25 keV] range for all three shots. The lowest temperature is in the [3-4 keV] range for the Al channel. It corresponds to the expected bulk electron temperature. These lower temperatures are not seen from the Mo channel data as the low energy photons are stopped inside the Mo filter; this channel being not suitable for the detection of low energy photons.
These results indicate the presence of a high energy component of hot electrons in shot #1 and shot #2, which is strongly reduced in shot #3. Although the measured Bremsstrahlung photon distribution can be related directly to the hot electron energy distribution in the case of thin targets, this is not the case in a thick target, as in this experiment. Hot electrons could be stopped in the target and detailed Monte-Carlo simulations are needed to retrieve hot electron distributions from the Bremsstrahlung emission. This work is in progress.
T1 (keV) N1 (sr -1) T2 (keV) N2 (sr -1) T3 (keV) N3 (sr -1)
Shot #1 Al channel 3 [2-3] 8.6 x 10¹⁴ 20 [17.5-20] 7.3 x 10¹² 140 [60-200] 1.1 x 10¹⁰ Shot #1 Mo channel 17.5 [17.5] 8.6 x 10¹² 25 [25-40] 1.4 x 10¹² 200 [80-200] 6.9 x 10⁹ Shot #2 Al channel 3 [3] 3.2 x 10¹⁵ 15 [15] 8.8 x 10¹² 90 [60-180] 1.8 x 10¹⁰ Shot #2 Mo channel 10 [10] 1.9 x 10¹³ 17.5 [17.5] 4.5 x 10¹² 200 [140-200] 5.4 x 10⁹ Shot #3 Al channel 4 [2-8] >1.5 x 10¹⁴ 17.5 [10-20] >8.2 x 10¹² 35 [30-60] >5.9 x 10¹¹ Shot #3 Mo channel 15 [3-17.5] >1.1 x 10¹³ 20 [17.5-30] >3.3 x 10¹² 35 [30-50] >5.1 x 10¹¹
Table 3: Temperatures and photon numbers per steradian obtained from the CRACC-X for the three shots. Values in square brackets indicate the temperature range for which WSSR is 1.5 times the best result. The photon numbers given for the third shot are lower limits, as the scan of the IP layers was not exactly in the same way.
4. Hydrodynamic simulations
Two sets of simulations of the experiment were performed with the radiative hydrodynamic code CHIC [24], first, for the target design and second for interpretation of the results. In this paper, we focus on a comparison of plasma parameters predicted by the simulations and measured in experiment. The fully three-dimensional geometry of the experiment was approximated by a planar 2D geometry by neglecting the ~20° azimuthal angles of two of the three beams with respect to the target normal. In all cases, thermal transport was modeled with the non-local SNB model [25], and laser propagation described with the Paraxial Complex Geometrical Optics (PCGO) [26].
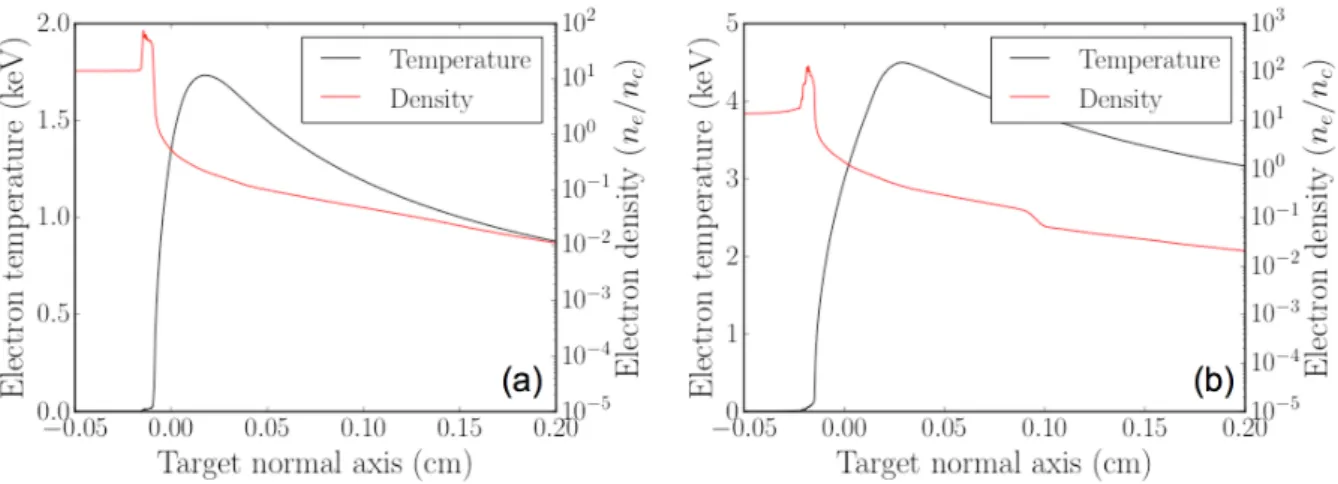
Fig. 8. Profiles of plasma density (red) and temperature (black) along the target normal at two different times: (a) during the pre-pulse (3.2 ns) and (b) during the spike (4.3 ns). Electron temperature is in keV and electron density is normalized to the critical density.
Simulations of the experiment were conducted using the post-shot laser power profiles and by taking into account the actual laser pointing. Temperature and density profiles are given in Fig. 8. Simulations predict a peak coronal plasma temperature of 1.7 keV during the pre-pulse at 3.2 ns (Fig. 8a) and 4.5 keV during the main pulse at 4.3 ns (Fig. 8b). The corresponding density scale lengths at the quarter critical density and along the propagation axis of the quad 29U are 390 µm during the pre-pulse and 480 µm during the spike pulse. These conditions are comparable to the coronal plasmas of full-scale shock-ignition targets. For these parameters, the thresholds of convective backward SRS and SBS below the quarter critical density are exceeded for the spike intensity [27], but not during the laser pre-pulse. They may be marginally reached in the hot spots of the speckle pattern produced by the random phase plate.
Considering (i) that the temperature (or mean energy) of hot electrons accelerated by the SRS-driven electron plasma waves (EPWs) is usually close to the kinetic energy of electrons at the EPW phase velocity, (ii) assuming an electron plasma temperature of 4 keV from the simulations, and (iii) that most of hot electrons are emitted around 8-15 % of the critical density, as seen in the SRS spectra, we can estimate a hot electron temperature around 20 keV. This value will be to compare to the hot electron temperatures determined from a refined analysis of CRACC-X results after additional MC simulations providing the relation between photon and electron temperatures. This work is in progress.
The first analysis of BSC results from shot #3 (with SSD) shows suppression or strong reduction of the high energy component in clear difference from shots #1 and #2 taken without SSD, whereas other components of electron distribution (with low and intermediate temperatures) were very similar for the three shots. This observation needs to be compared with further analysis of relation between SRS and hot electron generation, as SRS seems not to be strongly affected in this experiment.
5. Perspectives for the 2020 experiment
The second part of the experiment, scheduled for March 2020, will be dedicated to the influence of hot electrons on the shock propagation. In the present campaign, tracer layers of high-Z materials, introduced for Kα line emission purposes, have significantly changed the shock dynamics with respect to a uniform target. For the next campaign, the focus will be on measurement of shock properties. As such, the 2020 target has been simplified down to a pure CH slab. In this section, we present simulation results for this new target. The simulations were conducted with and without hot electrons in order to predict the expected effect. The effect of hot electrons on plasma dynamics was modeled with the inline module coupled to the propagation code based on PCGO [26]. In this approach, hot electrons are generated according to simplified scaling laws based on local plasma and laser parameters. Hot electrons are initialized with an angular and energy spectrum, and carry a fraction energy taken from the pump beams. They are propagated in the plasma using a continuously slowing down approximation including effects of angular scattering. In the experiment, shots with SSD are expected to decrease the hot electron production but not remove it entirely, so that the results comparing simulations with and without hot electrons should be interpreted accordingly.
For a pure CH slab, radiative preheat from coronal X-rays is significant compared to hot electron preheat. As such, it is important that the coalescence between the pre-pulse-driven and spike-driven shocks takes place in a part of material that is weakly preheated by X-rays. For that reason, the spike pulse in the 2020 campaign will be launched with a larger delay of 5 ns. The downside of this configuration is that the pre-pulse shock will have a lower pressure when coalescing with the main shock, which will decrease the overall shock pressure. However, it will also maximize the relative effect of hot electrons, increasing the probability of successful observation.
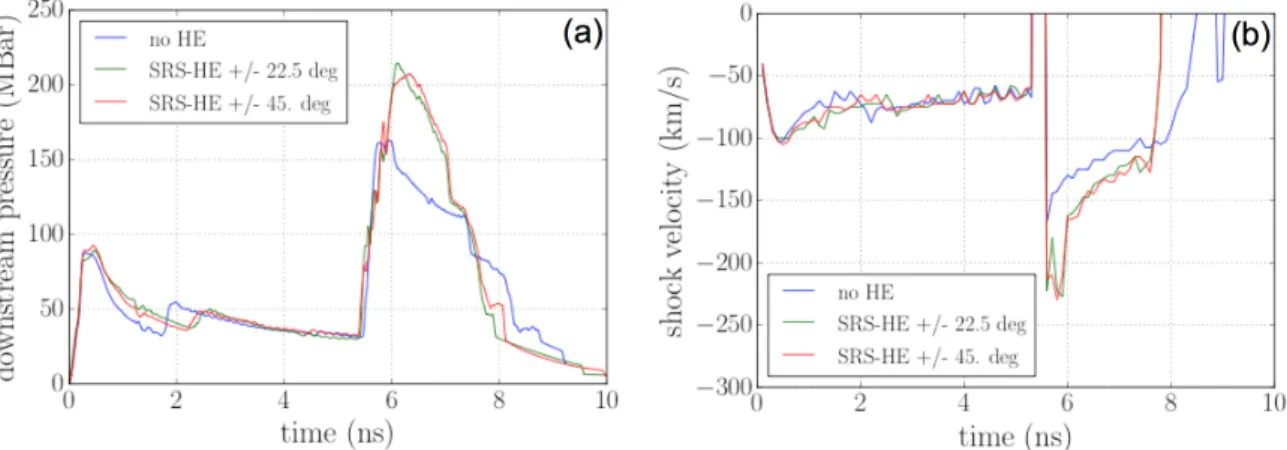
Since hot electron initial divergence angle is unknown, two initial hot electron divergences of +/- 22.5° and +/- 45° around the axis of rays at the quarter critical density have been considered. In all cases, we are considering 4% of 36 keV average energy hot electrons during the pre-pulse and 10% of 40 keV average energy hot electrons during the spike. From the simulations, it appears that launching the main shock after 5 ns allows to observe a robust effect of the hot electrons for two initial divergence values. The shock velocity with hot electrons is enhanced by ~25 km/s up to ~150 km/s, corresponding to a pressure increase by a third of the shock pressure without hot electrons (that is, about 50 Mbar, see Fig. 9). After propagation of a distance of 600 µm in plastic, the shock fronts in the simulations with and without hot electrons are separated by ~50 µm. The target in this campaign will be 1500 µm long, which should allow for a confident measurement of the separation.
Fig. 9. Downstream shock pressure (a) and shock velocity (b) as a function of time, for the strongest shock in the target. Results are given for simulations without hot electrons (blue line), with hot electrons with +/- 22.5° initial divergence (green line) and +/-45° initial divergence (red line). The spike pulse is launched at 5 ns. The spikes around 5.5 ns are numerical artifacts resulting from the shock-finding algorithm at coalescence time.
In the 2020 campaign, three shots are planned, two without SSD and the third with SSD, in order to observe a potential increase in the shock velocity. Two X-ray radiography diagnostics will be implemented: (i) in the equatorial plane, GXI will perform the shock radiography at different times, (ii) in the perpendicular plane, we will use the PETAL short pulse laser to perform an instantaneous X-ray radiography with better spatial resolution thanks to the point projection technique given a small source size. A preliminary and successful test has been performed by focusing the PETAL laser pulse onto a 25 µm diameter Cu wire. For this experiment, the focal spot has been modified in order to obtain a rectangular spot of ~ 100 x 25 µm2. A 8 keV radiography of a test mesh demonstrated a
resolution of 25 µm, even though the experimental configuration was not optimized. The two crossed X-ray radiographies should allow reconstructing the shock in three dimensions, which will be compared with numerical simulations.
6. Conclusion
We performed the first part of LMJ-PETAL experiment dedicated to studying the effect of LPI-generated hot electrons on shock propagation in interaction conditions relevant to shock ignition. This experiment was focused on the characterization of the parametric instabilities and associated hot electron populations, with or without activating optical smoothing (SSD) in order to modify the hot electron production. Preliminary analysis indicates a strong reduction of the high-energy component in the photon spectrum measured with CRACC-X in the presence of SSD stressing a cooling off of the hot electron population. The effect of SSD on the amounts of SBS and SRS was clearly observed, with reduction up to a factor of 2 (absolute calibrations are ongoing). More simulations have to be performed, taking into account the actual plasma conditions, to correlate the results obtained from the different diagnostics. This work is in progress.
March 2020 (three shots). Thanks to new set of simulations, the experimental parameters have been refined to optimize the observation of the shock propagation with the two crossed X-ray radiographies.
ACKNOWLEDGEMENTS
The authors gratefully acknowledge all the LMJ-PETAL teams, especially E. Alozy, T. Caillaud, I. Lantuéjoul and B. Vauzour from the diagnostics team, and C. Hermerel at the CEA-Valduc target laboratory for providing high quality targets.
The PETAL laser was designed and constructed by CEA under the financial auspices of the Conseil Régional d’Aquitaine, the French Ministry of Research, and the European Union.
The SPECTIX and CRACC diagnostics were designed and commissioned on the LMJ-PETAL facility in the framework of PETAL+ Project coordinated by the University of Bordeaux and funded by the French Agence Nationale de la Recherche under grant ANR-10-EQPX-42-01 and the PetaPhys Project under grant ANR-10-IDEX-03-02.
This work and the LMJ-PETAL experiment were supported by Association Lasers et Plasma (ALP) and CEA and within the framework of the EUROfusion Enabling Research Projects, ENR-IFE19-CEA-01 and AWP17-ENR-IFE-CEA-01. They have received funding from the Euratom research and training programs 2014-2018 and 2019-2020 respectively under grant agreement No 633053. The views and opinions expressed herein do not necessarily reflect those of the European Commission.
References
[1] R. Betti, C.D. Zhou, K.S. Anderson, L.J. Perkins, W. Theobald, A. A. Solodov, Phys. Rev. Lett. 98, 155001 (2007).
[2] W. Theobald, R. Betti, C. Stoeckl, K.S. Anderson, et al. Phys. Plasmas 15, 056306 (2009). [3] S. Atzeni, X. Ribeyre, G. Schurtz, A.J. Schmitt et al., Nucl. Fusion 54, 054008 (2014). [4] D. Batani, S.D. Baton, A. Casner, S. Depierreux et al., Nucl. Fusion 54, 054009 (2014). [5] R. Betti and O. Hurricane, Nat. Phys 12, 435, (2016).
[6] O. Klimo, S. Weber, V.T. Tikhonchuk, J. Limpouch, Plasma Phys. Controlled Fusion 52, 055013 (2010).
[7] C. Riconda, S. Weber, V.T. Tikhonchuk, A. Heron, Phys. Plasmas 18, 092701 (2011).
[8] Ph. Nicolai, J.-L. Feugeas, M. Touati, X. Ribeyre, S. Gus’kov, V.T. Tikhonchuk, Phys. Rev. E 89, 033107 (2014).
[9] A. Colaitis, X. Ribeyre, E. Le Bel, G. Duchateau, Ph. Nicolai, V.T. Tikhonchuk, Phys. Plasmas 23, 072703 (2016).
[10] E. Llor Aisa, X. Ribeyre, G. Duchateau, T. Nguyen-Bui, V.T. Tikhonchuk, A. Colaitis, R. Betti, A. Bose, W. Theobald, Phys. Plasmas 24, 112711 (2017).
[11] W. Theobald, A. Bose, R. Yan, R. Betti et al., Phys. Plasmas 17, 120702 (2017).
[12] J. Trela, W. Theobald, K.S. Anderson, D. Batani et al., Phys. Plasmas 25, 052707 (2018). [13] N. Blanchot G. Béhar, J.C. Chapuis, C. Chappuis, S. Chardavoine, J.F. Charrier, H. Coïc, C. Damiens-Dupont, J. Duthu, P. Garcia et al., Opt. Express 25, 16957 (2017).
[15] S. Skupsky, R. W. Short, T. Kessler, R. S. Craxton, S. Letzring, and J. W. Soures, J. Appl. Phys. 66, 3456 (1989).
[16] C. Rousseaux et al., Phys. Plasmas 22, 022706 (2015).
[17] C. Reverdin, S. Bastiani, D. Batani, E. Brambrink et al., JINST 13, CO1005 (2018). [18] S. Agostinelli et al., Nucl. Instrum. Methods Phys. Res., Sect. A 506, 250 (2003). [19] J. Sempau et al., Nucl. Instrum. Methods Phys. Res., Sect. B 207, 107 (2003). [20] R. Rosch et al., Rev. Sci. Instrum. 87, 033706 (2016).
[21] https://www-lmj.cea.fr/en/ForUsers
[22] H. X. Vu, D. F. DuBois and B. Bezzerides, Phys. Plasmas 14, 012702 (2007). [23] G. Boutoux et al., RSI 87, 043108 (2016).
[24] J. Breil, S. Galera, and P. H. Maire, Comput. Fluids 46, 161 (2011). [25] G. Schurtz, Ph. Nicolaï and M. Busquet, Phys. Plasmas 7, 4238 (2000).
[26] A. Colaïtis et al, Rapid Communications, Physical Review E 92, 041101(R) (2015).
[27] W. L. Kruer, The Physics of Laser Plasma Interactions, Frontiers in Physics (Addison-Wesley Publishing Company, New York, 1988).