Alignment Strategies for Drug Product Process Development and
Manufacturing
By Christopher J. Garvin
B.A. Geosciences, Williams College, 2003 M.S. Geological Sciences, Cornell University, 2006
SUBMITTED TO THE MIT SLOAN SCHOOL OF MANAGEMENT AND THE ENGINEERING SYSTEMS DIVISION IN PARTIAL FULFILLMENT OF THE REQUIREMENTS FOR THE
DEGREES OF
MASTER OF BUSINESS ADMINISTRATION
AND
MASTER OF SCIENCE IN ENGINEERING SYSTEMS
IN CONJUNCTION WITH THE LEADERS FOR GLOBAL OPERATIONS PROGRAM AT THE MASSACHUSETTS INSTITUTE OF TECHNOLOGY
JUNE 2012
© 2012 Christopher J. Garvin. All rights reserved.
The author hereby grants to MIT permission to reproduce and to distribute publicly paper and electronic copies of this thesis document in whole or in part in any medium now known or hereafter created
Signature of Author ____________________________________________________________________ Engineering Systems, MIT Sloan School of Management
May 11, 2012 Certified by __________________________________________________________________________
Roy Welsch, Thesis Supervisor Eastman Kodak Leaders for Global Operations Professor of Management,
Professor of Statistics and Engineering Systems Certified by __________________________________________________________________________
Charles Cooney, Thesis Supervisor Robert T. Haslam Professor, Chemical Engineering Accepted by __________________________________________________________________________
Oli de Weck, Chair, Engineering Systems Education Committee Associate Professor of Aeronautics and Astronautics and Engineering Systems Accepted by __________________________________________________________________________
Maura M. Herson, Director, MBA Program MIT Sloan School of Management
2
3
Alignment Strategies for Drug Product Process Development and
Manufacturing
By Christopher Garvin
Submitted to the MIT Sloan School of Management and the Engineering Systems Division on May 11, 2012 in Partial Fulfillment of the Requirements for the Degrees of Master of Business Administration and
Master of Science in Engineering Systems
Abstract
The transfer of information between the drug product development and manufacturing organizations is fundamental to drug product commercialization. This information is used to characterize the product-process interaction and ensure manufacturability, and to set operating ranges at fill/finish sites. Amgen has successfully commercialized drug products for years, yet opportunities exist to improve the efficiency of process development and technology transfer, and to better align the equipment, procedures, and data collection of the groups involved in these activities.
We identify improvement opportunities and develop a strategic approach, which we term the “Pilot Plant Cooperative,” to enable more efficient and effective commercialization. The benefits of this strategy are assessed in three case studies: (1) a capital investment project for new laboratory filling equipment, (2) enhanced data generation in clinical manufacturing, and (3) efficiency improvements in early-stage process development studies. Based on these studies, we make specific recommendations for future work. We make additional procedural and cultural recommendations, including revising capital investment processes and implementing alignment-focused incentives and hiring practices, to ensure widespread alignment is achieved and maintained.
Thesis Supervisor: Roy Welsch
Title: Eastman Kodak Leaders for Global Operations Professor of Management, Professor of Statistics and Engineering Systems
Thesis Supervisor: Charles Cooney
4
5
Acknowledgments
First, I would like to thank those whose guidance and support made this project possible. At Amgen, Wenchang Ji, Richard Crowther, and Ed Walls gave me more of their time than I deserved. Their
knowledge of all things drug product amazed me, their enthusiasm for this project motivated me, and their willingness to share both with me made this an invaluable learning experience. Leigh Hunnicutt helped me translate the internship into an LGO thesis project; I simply could not have done this without her. At MIT, Roy Welsch and Charlie Cooney helped get things off the ground and continuing to move in the right direction; their insight opened my eyes to new possibilities.
Second, the internship experience was greatly enhanced by the El Nido LGO cohort. Daniel
Bolgren, Marnix Hollander, Patrick Riechel, Craig Rothman, and Sally Smith had a hand, intentionally or not, in making this project what it is. Their informal feedback and advice at the lunch table, in the car, on a run, or at the foosball table, enriched the project and broadened the learning experience.
Finally, I thank my family. My parents are a never-ending source of support and entertainment, while my sister continues to inspire and amaze me with her exploits and successes. Most importantly, Katie is responsible for making the LGO experience as fun as it was. Her adaptability to the student lifestyle and excitement over sharing in these two years helped get me through the stresses and allowed me to enjoy the rest. I look forward to embarking on the next chapter of life with her and Sebastian by my side.
6
7
Table of Contents
Abstract ... 3 Acknowledgments ... 5 Table of Contents ... 7 List of Figures ... 8 List of Tables ... 9 1 Introduction ... 10 1.1 Project Drivers ... 10 1.2 Problem Statement ... 11 2 Background ... 12 2.1 Biotechnology Industry ... 12 2.2 Amgen, Inc. ... 132.2.1 Drug Product Development and Manufacturing Network ... 14
2.2.2 Stages of Development ... 18
2.2.3 Process Characterization ... 19
3 Project Motivation and Literature Review ... 20
4 Project Approach ... 26
4.1 Setting the Foundation ... 27
4.2 Analyzing ... 28
4.3 Strategies and Case Studies... 29
4.4 Sustaining ... 32
5 Analysis and Results ... 33
5.1 Strategic Alignment: Pilot Plant Cooperative ... 33
5.2 Case Studies ... 36
5.2.1 Case Study #1: Filling Equipment Investment ... 36
5.2.2 Case Study #2: Clinical Support of Commercial MFG... 73
5.2.3 Case Study #3: First-in-Human Process Evaluations ... 83
6 Recommendations and Conclusions ... 105
6.1 Procedural Recommendations... 106
6.2 Cultural Recommendations ... 108
6.3 Conclusions ... 111
7 Glossary ... 112
8 References ... 113
9 Appendix A: Sample NPV Calculation for Filling Equipment ... 117
8
List of Figures
Figure 1: Amgen's annual revenue and operating margin since 1995….. ... 14
Figure 2: Schematic diagram of information flow during drug product commercialization ... 15
Figure 3: Summary of project scope. ... 20
Figure 4: Visual representation of project plan ... 26
Figure 5: Conceptual view of types of inefficiencies present in the DP Network ... 29
Figure 6: Schematic of the Pilot Plant Cooperative ... 35
Figure 7: Rolling Diaphragm dosing technology ... 41
Figure 8: Rotary Piston Pump dosing technology ... 43
Figure 9: Time-Pressure dosing technology ... 44
Figure 10: Bubble chart showing relative efficiency of the DPE FIH studies ... 94
Figure 11: Plot of Actual Vmax vs. Predicted Vmax... 99
9
List of Tables
Table 1: Selected attributes of Amgen's dosing technology. ... 47
Table 2: Rating summary comparing filling equipment options. ... 49
Table 3: User input on filling equipment requirements. ... 51
Table 4: User input on what the filling equipment should include. ... 52
Table 5: Filling equipment size requirements. ... 57
Table 6: Summary of filling equpmenet recommendations. ... 64
Table 7: Freeze-thaw characterization attributes ... 74
Table 8: Formulation characterization attributes ... 75
Table 9: Filtration characterization attributes ... 76
Table 10: Stainless steel tank hold characterization attributes ... 77
Table 11: Filling characterization attributes ... 78
Table 12: Lyophilization characterization attributes... 79
Table 13: Inspection characterization attributes ... 80
Table 14: Light and temperature exposure characterization attributes ... 81
Table 15: Component preparation characterization attributes ... 81
Table 16: Labeling, packaging, and transportation characterization attributes ... 82
Table 17: Summary of DPE FIH studies ... 91
Table 18: Efficiency scores of each DPE FIH study ... 93
Table 19: Scoring rubric for study efficiency metrics ... 95
Table 20: Ratings of alternative study options for Physical Properties Determination ... 96
Table 21: Ratings of alternative study options for Freeze-Thaw Evaluation ... 97
Table 22: Ratings of alternative study options for Filtration Evaluation ... 98
Table 23: Ratings of alternative study options for Shear Evaluation ... 100
Table 24: Ratings of alternative study option for Cleanability Assessment ... 100
Table 25: Ratings of alternative study options for Stainless Steel Hold Evaluation ... 101
Table 26: Ratings of alternative study options for Fill Evaluation ... 102
Table 27: Ratings of alternative study options for Inspection Evaluation ... 102
Table 28: Potential efficiency improvements resulting from FIH recommendations ... 103
10
1 Introduction
1.1 Project Drivers
Amgen has experienced rapid growth over the past two decades, with revenues increasing more than 100-fold since 19951. Accompanying the growing sales has been a quickly expanding workforce; during that same time frame, the number of employees has risen from fewer than 3,000 to nearly 20,0001. Fueling the growth has been Amgen’s successful product portfolio and pipeline, both of which have necessitated operational expansion to keep pace with patient and clinical demand. However, Amgen’s growth, while a boon to the company’s financial position, has brought with it challenges unprecedented in the company’s short history.
Among the challenges facing Amgen is the increasing complexity of the company’s drug product development and manufacturing operations network. These organizations have expanded globally, creating geographic and cultural barriers to accompany already-existing functional barriers. As a result, effective communication has been inhibited, and the organizations have followed progressively divergent paths, leading to misalignment of procedures, equipment, and data collection. Former CEO Gordon Binder acknowledged that this reality had set in throughout the company, asserting that “at times, our policies didn’t keep pace [with the rapid growth] (Binder, 2008).” He further noted that consensus, at one time a tenet observed by most Amgen employees, became chaotic as the company grew, resulting in more independent decision-making (Binder, 2008).
Despite the mounting complexity and misalignment, Amgen has continued to produce high-quality drug product while meeting customer demand. However, the drug product development and manufacturing organizations find themselves at the precipice of a tipping point. Further global expansion is underway, and the company’s pipeline is filling with promising products. As of early 2012, Amgen has 18 products in Phase 1, 13 in Phase 2, and 12 in Phase 3 (Amgen, Inc., 2012). Assuming typical clinical
11
success rates2, the current pipeline should yield roughly 13 commercial products over the next decade. Even after subtracting the existing commercial products in trials for other indications, seven new molecular entities are likely to join Amgen’s commercial product portfolio. To further compound the challenges presented by a suite of new products, many of the products are formulated at high
concentrations and require an array of new SKUs, each increasing the already heavy development and manufacturing workload. To effectively handle these new products while continuing to support existing commercial products, Amgen will need to operate more efficiently. This means maintaining high quality standards and operational consistency while reducing time, labor, and cost per unit.
Amgen’s mission is “serving every patient every time.” Accomplishing this will require a dedication by all groups across the Drug Product Network to institute a more efficient and robust commercialization process, ensuring that product launches are successful and patient supply is
maintained. This project aims to create a strategy that does just that. The intended outcome is enhanced collaboration among the Drug Product Network groups and promotion of more efficient generation and transfer of the highest quality data possible to abet commercialization. In order to have a complete and lasting impact, the strategy must be holistic, covering the entire network, and should be forward-looking, setting in motion steps to sustain long-term alignment and efficiency regardless of Amgen’s future path.
1.2 Problem Statement
Amgen’s drug product manufacturing and development network is faced with growing
organizational complexity and operational challenges that could impede efficient process scale-up and commercialization. This project investigates strategies that would improve process robustness, reliability, and consistency while minimizing cost. In doing so, these strategies should also promote better
understanding of process-product interdependencies and facilitate cross-network communication.
2 Eventual commercialization probabilities = ~15% for Phase 1 drugs, ~24% for Phase 2 drugs, and ~60% for Phase 3 drugs (Bogdan & Villiger, 2010).
12
2 Background
2.1 Biotechnology Industry
The healthcare biotechnology industry consists of companies that participate in the development, manufacturing, distribution, and/or sale of biologics. Biologics are drugs derived from living organisms and include therapeutic proteins, DNA vaccines, monoclonal antibodies and peptibodies, as well as newer modalities such as gene therapy and stem cell therapy (Data Monitor, 2011). A biologic typically requires 10-15 years to transition from discovery to market, including clinical trials and FDA approval, and companies incur significant costs in doing so. Furthermore, only a fraction of drug discoveries ever reach the commercial marketplace, so healthcare biotechnology companies must rely on the revenues from the drugs that do to cover the costs associated with both the successes and failures (Suresh & Basu, 2008).
The biotechnology industry first emerged in the 1970s with the development of recombinant DNA technology and the generation of monoclonal antibodies (mAbs). The recombinant techniques allow for the transformation of DNA sequences into protein-based drugs that resemble natural substances and have been shown to work with higher potency and more precision than traditional “small-molecule” drugs (Kamarck, 2006). In addition, these drugs have the potential to cure diseases rather than just treat symptoms (Sekhon, 2010). The biotechnology market has grown steadily over the past five years (CAGR ~10%), resulting in U.S. healthcare biotechnology revenues of $57 billion in 2010 (Data Monitor, 2011). As a result, biologics constitute roughly one-third of all drugs currently in development (Sekhon, 2010). This growth is attributed to new product development, a favorable regulatory environment, an aging population, and increased access to capital (Snyder, 2011).
The future of the biotechnology industry will likely be shaped a combination of emerging and long-standing factors. The new trends include the threat of biosimilars after patent expiry, the
increasingly active mergers and acquisitions environment, consolidation with large pharmaceutical companies, government and consumer demand for lower prescription drug prices, the impact of demand
13
for personalized medicine, and changing disease trends (Silver, 2012). Additionally, the importance to the industry of the regulatory environment is ever relevant. How a company navigates this environment while dealing with the emerging trends will largely dictate that company’s long-term success (Silver, 2012).
2.2 Amgen, Inc.
Amgen, Inc. was founded in 1980 and has grown to become the world’s largest independent biotechnology company, with $15.3 billion in revenue during the 2011 fiscal year. The company’s sole business unit is human therapeutics, and within this segment sales are dominated by five products: Aranesp, Epogen, Neulasta, Neupogen, and Enbrel. Research and development efforts are focused on “novel therapeutics for the treatment of grievous illness in the areas of inflammation, oncology and hematology, neuroscience, and metabolic disorders (Amgen, Inc., 2012).”
Amgen has experienced rapid sales growth over the past two decades and has responded by expanding its operations from its headquarters in Thousand Oaks, CA, to other parts of the U.S. and world, including drug product manufacturing facilities in Juncos, Puerto Rico, and Dun Laoghaire, Ireland. In recent years, growth has been accompanied by stagnant operating margins (Figure 1), and Amgen has responded by undertaking a number of cost-cutting measures as a way to improve operational efficiency. With over forty drug candidates in its pipeline, the degree to which this efficiency can be improved will play an important role in the company’s long-term financial and operational well-being.
14
Figure 1: Amgen's annual revenue and operating margin since 1994 (Edgar Online, 2012). 2.2.1 Drug Product Development and Manufacturing Network
The Drug Product segment of Amgen’s business is comprised of the formulation, fill, and finish (FFF) activities. Typical FFF processing includes Drug Substance (DS) freeze, storage, transport, and thaw; Drug Product (DP) formulation and mixing; bioburden filtration, cold room hold, and sterile filtration; product filling (into vials, syringes, or cartridges); lyophilization (i.e., freeze-drying); manual or automatic inspection for particles and defects; labeling, packaging, cartoning, and shipping. The purpose of these activities is to convert bulk drug substance into the dosage and presentation required by the doctors and patients around the world to which the product is ultimately shipped. In essence, the Drug Product organization is tasked with “assuring that Amgen medicines rapidly, reliably, and safely reach patients (Amgen, Inc., 2012).”
The project scope is centered on a network of four functional groups – known collectively as the Drug Product Process Development and Manufacturing Network (shortened here to “DP Network”) – that
15
work together to commercialize3 Amgen’s drug products. These groups are Drug Product Development, Drug Product Engineering, Clinical Manufacturing, and Commercial Manufacturing. Other groups (e.g. Quality Assurance) are also involved in drug product commercialization but fall outside the scope of this project.
Figure 2: Schematic diagram of information flow during drug product commercialization
Amgen employs a decentralized development and manufacturing network; drug product development work is performed at Thousand Oaks, CA (ATO), and Seattle, WA (AWA), clinical manufacturing takes place in ATO, commercial manufacturing in Juncos, PR (AML) and in Dun Laoghaire, Ireland (ADL), and the warehouse and distribution centers are located in AML, ADL, and Breda, Netherlands (ABR). These geographically diverse groups and linked together through “Global Network Teams,” a recently-introduced concept that encourages sharing of information and best practices across Amgen’s network. Each of the four major groups in the DP Network is described in the following sections.
3 We define “commercialization” as the act of developing a process and transferring it to a commercial manufacturing site
16
2.2.1.1 Drug Product Development
Drug Product Development (DPD) is responsible for developing and evaluating formulations for Amgen’s pipeline products. In the early stages, this means ensuring platform formulation4
compatibility with each new drug product through stability studies. Later, during commercial formulation development (CFD) activities, DPD performs a set of studies on commercial formulation candidates to identify the most robust formulation for a given product. DPD’s CFD studies typically include a kinetic particle study (to define particulation propensity in a formulation), a buffer study, a pH and excipient study, and a protein concentration study. The combined results from these studies are used to pare down the list of candidate formulations to a subset that will undergo scale-down studies. DPD also develops appropriate assays and determines acceptable assay result ranges to support product characterization activities. Finally, DPD continues its support post-commercialization in areas such as clinical dosing, non-conformance investigations, and life-cycle management activities.
2.2.1.2 Drug Product Engineering
Drug Product Engineering (DPE) acts in a process development and manufacturing support capacity. DPE performs process evaluation studies to assess drug product manufacturability of the formulation recommended by DPD. Based on its studies, DPE makes procedural and equipment setting recommendations to Clinical and Commercial Manufacturing and then continues to support DP
manufacturing through technology transfer and non-conformance investigations.
During early-stage (FIH) development, DPE typically performs a set of studies to prepare for product introduction to Clinical Manufacturing. DPE performs an expanded set of studies during Commercial Process Development (CPD), using DPD’s recommended formulation. Additionally, in CPD, DPE makes a commercial DP container (SKU) recommendation. During Process Characterization (PC), the final development stage prior to validation, DPE conducts characterization studies to prepare for
4 Monoclonal antibody products will often use Amgen’s “platform formulation,” a solution with a defined combination of components with set concentrations at a specific pH.
17
manufacturing at the commercial site. DPE’s output includes identification of relevant performance and operating parameters for the commercial process, along with characterization of each parameter as “critical,” “key,” or “non-key,” In-Process Control (IPC) definition and action limit determination, operating parameter ranges, and data to support regulatory filings.
2.2.1.3 Clinical Manufacturing
Clinical Manufacturing produces material using commercial-like equipment for Amgen’s clinical drug trials, as well as for toxicology and stability testing. The group is able to perform all unit operations from DP thaw through inspection and has the capability to fill both vials and syringes. The final few unit operations – labeling, packaging, and shipping – are also conducted by the Clinical Manufacturing group, albeit in a separate building on the ATO campus.
Clinical Manufacturing also participates in technology transfer activities, ensuring all manufacturing concerns are addressed prior to introduction of a new product to the facility. During product manufacturing, the group performs all required procedures and files non-conformances when appropriate. The group then plays an important role in investigating root causes of issues (working closely with DPE or DPD while doing so) and making sure the process is completed while adhering to Amgen’s quality requirements.
2.2.1.4 Commercial Manufacturing
Amgen currently produces drug product for commercial sale internally at AML and externally at a number of contract manufacturing facilities. With the recent purchase of a commercial manufacturing and warehouse facility in Ireland, however, Amgen’s internal capabilities are expanding. This project’s scope includes all of Amgen’s internal facilities but excludes contract facilities.
In Amgen’s manufacturing model, commercial manufacturing begins with production of drug substance at one of the company’s manufacturing sites (Rhode Island, Colorado, or Puerto Rico), where, upon completion, it is frozen and shipped to a DP manufacturing site. Commercial Manufacturing thaws,
18
formulates, filters, fills, lyophilizes (when appropriate), and inspects the product. The finished product is then shipped to ABR for international distribution, or shipped to customers directly from AML.
2.2.2 Stages of Development
While the FFF process is generally consistent from one product to the next, the specific processing conditions may differ depending on unique product needs. Once a product’s formulation is determined, process development studies are designed to gain an understanding of manufacturing equipment and procedural requirements. These requirements are refined over the course of three development stages and through clinical manufacturing experience. The three stages are known as First-in-Human (FIH), Commercial Process Development (CPD), and Process Characterization (PC). Each of the three stages is described below.
2.2.2.1 First-in-Human
The purpose of the First-in-Human (FIH) development stage is to prepare for manufacturing of Phase 1 drug product material for clinical trials. It includes a formulation recommendation and assay development by DPD, a set of process evaluation studies performed by DPE to ensure manufacturability in the chosen formulation, and production of drug product by Clinical Manufacturing (including a reference standard, lead lot for stability testing, definitive toxicology lot, and clinical fills for Phase 1a/1b).
2.2.2.2 Commercial Process Development
Commercial Process Development (CPD) includes all activities required to develop and scale-up the DP manufacturing process for late-stage clinical and commercial production. During CPD, the anticipated commercial process is developed prior to manufacturing Phase 3 clinical supplies. CPD formally starts with the Commercial Formulation Recommendation (CFR) from DPD (see “Drug Product Development” section above for additional information on the CFR). The CFR is based on three factors: a recommendation of three-to-five top formulation candidates (based on screening studies); formulation
19
scale-down studies that include a transportation and handling assessment and a stability evaluation; and verification of resource availability from all functional areas.
From the standpoint of the development timeline, CPD is initiated at the start of Phase 2. The planning and implementation occurs throughout Phase 2 and leads directly to Pivotal Campaign Initiation, and Process Characterization, at the start of Phase 3. During this timeframe, additional CPD studies are performed and used to provide data that feed into the Process Characterization risk assessment.
Concurrently, a commercial DP container recommendation is also made based on the CFR and the pivotal SKU recommendation. Finally, transportation, and primary and secondary packaging tests are conducted to close out the required CPD activities.
2.2.3 Process Characterization
Process Characterization (PC) is the final stage of development prior to process validation and takes place during Phase 3. It involves the additional studies and technical assessments required to characterize the commercial process before validation commences. The work performed during PC helps Amgen develop a thorough understanding of the manufacturing process parameters for each product as it approaches commercial launch. In principle, the goal of PC is to implement a well-designed and robust commercial process and control strategy. More specifically, this means identifying relevant operating and performance parameters; categorizing parameters as critical, key, and non-key; setting action and control limits; and defining operating parameter ranges (which include a characterization range, an acceptable range, and an operating range).
PC generally involves studies and technical assessments designed to characterize and investigate the robustness of the commercial process. The studies to be performed are documented in a PC plan after being determined based on the output of a risk assessment. The process development and manufacturing groups work together to determine the process operating and performance parameters, and risk
20
PC studies are performed at both the development site (in labs or a pilot plant) and at the
commercial site. The latter is needed because of equipment design and capability differences between the development and commercial site and are only performed once a commercial site has been selected and commercial SKUs and manufacturing scale have been confirmed. The PC and CPD study results, along with FMEA (failure mode and effects analysis – a risk assessment method) input, and manufacturing and development history, are used by process development to generate technical assessments and a process characterization summary report in which the important parameters, limits, and ranges are identified. The studies performed can differ for each new product and are based on FMEA-determined high-risk areas.
Figure 3: Summary of project scope, including the groups, locations, development stages, and unit operations evaluated.
3 Project Motivation and Literature Review
“The traditional, nonintegrated, hierarchical life science organizations tend to work in a Commons-like way. The pool of resource is absorbed to further the aims and interests of individual functions rather than ensuring the greatest benefit to the overall organization.” (Allport & Cooke-Davies, 2010)
This statement, referring to the “Tragedy of the Commons” (Hardin, 1968), succinctly summarizes the challenges facing Amgen and many other large biotechnology and pharmaceutical companies. These companies must create strategies to integrate diverse global functions and align them toward a common goal. This situation, in essence, is the driver for this project. In the remainder of this section, we review academic literature on this and related topics, including the roles of process
21
development and manufacturing and the connection between them, the financial stakes of this relationship, common challenges faced in trying to align these groups, approaches recommended for alignment, and the potential benefits of an integrated and aligned organization.
Process Development
In general, the role of process development is to translate product design into the “technical knowledge, organizational capabilities, and operating processes needed to create the product (Pisano, 1997).” As such, the earlier development studies are performed, the sooner crucial information on a unit operation is known. However, process development is also tedious and time and resource intensive, and as a result it has been suggested that biotechnology process development is less advanced than in other industries (Leila & Henry, 2003). Furthermore, since process development can affect both the time to market and the quality of manufacturing, it therefore has influence over commercialization efficiency and cost.
Manufacturing
The goal of manufacturing is to efficiently and consistently provide product that closely matches the material used in clinical trials (Kozlowski & Swann, 2006). Comparability to clinical material is achieved through a combination of product testing, process validation, and process control. While it is widely acknowledged that drug manufacturing is vital to product quality, cost, and commercialization speed, it has been noted that the importance of biotechnology manufacturing is often overlooked by firms (Suresh & Basu, 2008). After spending money on discovering, developing, and commercializing a new drug, the drug is frequently manufactured inefficiently, with a high degree of waste and variability (Suresh & Basu, 2008). This is especially important because low manufacturing costs are increasingly seen as a source of competitive advantage, offsetting the mounting costs of commercialization, shorter exclusivity periods, and dwindling returns on R&D investment (Basu, Joglekar, Rai, Suresh, & Vernon, 2008).
22
Financial Stakes
Biotechnology companies are generally under the competing pressures of innovating, increasing growth, and accelerating time to market while maintaining high levels of product quality (Suresh & Basu, 2008). Compounding the challenges faced by these companies is the massive cost of developing and commercializing a new drug, estimated in 2008 to be $2-3 billion (Suresh & Basu, 2008). This amount is largely a consequence of the relatively low (10-20%) clinical success rate of new molecular entities (Bogdan & Villiger, 2010; Steinmeyer & McCormick, 2008). Since the majority of products do not make it to market, it may seem imprudent to front-load costs during development. However, this approach is not completely unwarranted, since early investment in characterization may prevent costly manufacturing and quality issues later (Kozlowski & Swann, 2006). This is not the only example of how a strong relationship between development and manufacturing can minimize costs. “Hidden” costs, such as those related to validation and regulatory issues, are often underestimated by biotechnology companies and can contribute to the overall cost of commercialization (Farid, 2007). Another important cost consideration is the cost of operating imperfect processes, which can manifest internally (as rejected units), externally (as recalls, penalties, etc.), or as appraisal costs (quality labor and prevention) (Cogdill, Knight, Anderson, & Drennen III, 2007). In short, responsibility for developing and commercializing a drug more quickly, at lower costs, and with consistently high quality falls on the shoulders of the Development and
Manufacturing organizations, and this can best be achieved by aligning these groups toward a common goal.
Alignment Challenges
Despite the clear importance of development-manufacturing alignment, it is not uncommon in large organizations for a divide to form between the two. There are many symptoms of such a divide; a common one is that specifications may be “thrown over the wall” leaving little time for process engineers to optimize the process for manufacturing (Lu & Botha, 2006). Another is that development work is
23
often performed using methods, technology, and workers that differ from those used at the manufacturing site (Hayes, Pisano, Upton, & Wheelwright, 2005). A complication that compounds the effects of this dynamic is that once a manufacturing process is set, it is difficult to change due to regulatory approval requirements. For this reason, it is of great importance for Process Development and Manufacturing to coordinate early in the drug development cycle. Process Development and Manufacturing alignment is further tested when the groups are dispersed globally. Without face-to-face meetings, access to people, shared resources, a common language, and frequent informal conversations, the amount of collaboration and integration can drop precipitously (Allport & Cooke-Davies, 2010).
A final and often overlooked challenge is the way in which accounting practices handle development costs. Despite the importance of development-based innovation to a firm’s long-term success, these costs are expensed as incurred (Lev & Zarowin, 1999). As such, investment in
development will often have a short-term adverse effect on earnings and a time lag of uncertain duration before these development efforts bear their fruit (Hall & Bagchi-Sen, 2007). Allport and Cooke-Davies (2010) add that typical financial metrics, such as ROI and NPV, are rarely integrated with R&D
contribution.
Alignment Approaches
The academic literature contains many examples of ways in which Process Development and Manufacturing can be aligned to the benefit of a firm’s total costs, commercialization efficiency, and product quality. Pisano (1997) offers as a solution shifting development work as close as physically possible to the final production environment. However, this is only possible if the manufacturing site has the capacity to allow experimentation on its equipment, or if a company has access to representative equipment in a pilot plant or other facility.
Over the past decade, the U.S. FDA has spearheaded a number of efforts aimed at improved process understanding through alignment. For instance, the agency prefers that product quality and
24
operational performance are “achieved and assured by design of effective and efficient manufacturing processes,” which requires close coordination between Process Development and Manufacturing (Hussain, 2004). Furthermore, the FDA’s Janet Woodbury has emphasized that “new scientific
understanding and new technologies [in Process Development] can provide science-based approaches [in Manufacturing] (Cohen, 2005).” Indeed, new FDA initiatives, such as ‘cGMP for the 21st Century’ (USFDA, 2003), Process Analytical Technology (PAT) (USFDA, 2004), risk-based quality, and Quality by Design (QbD) (ICH, 2005), encourage companies to better use information to support
commercialization and allow for regulatory flexibility (Kozlowski & Swann, 2006). PAT, in particular, is implemented with the goal of improving efficiency and profitability, as long as there is a positive effect on product quality assurance (Cogdill, Knight, Anderson, & Drennen III, 2007).
One way in which greater commercialization efficiency can be achieved is through increasing a product’s speed to market without sacrificing quality. Pisano and Wheelwright (1995) theorize that to do so, a company’s focus should be more on improving the patterns and channels of communication, rather than on organizational structure. Creating a climate of enhanced communication between Development and Manufacturing, particularly in a global company, calls for facilitation tools (Lemon & Carl, 1991) like video conferencing and virtual workspaces. High levels of communication can lead to consensus if the groups are given shared objectives, creating a singleness of purpose (Brethauser, 2002). Other
techniques include planned visits, informal phone conversations, milestones, and progress discussions (Lu & Botha, 2006).
According to Kennedy (1997), an efficient process development organization is one that minimizes iterative work, avoids unnecessary costs, and applies capabilities across projects. Moreover, the right facilities are required. This includes labs, pilot plants, clinical manufacturing plants, and commercial manufacturing plants that are closely aligned (Carson, 2005). In addition to their cross-organization consistency, the facilities should be flexible enough to support a variety of programs, but only to the extent that operational efficiency is not sacrificed (Steinmeyer & McCormick, 2008).
25
Finally, a critically important concept is that local sacrifices must often be made in order to achieve widespread effectiveness and efficiency. If groups are not aligned toward a common, firm-level goal, some may feel that they lost out to other groups. It is therefore essential that the cost-benefit assessment be made not on the individual level but on “tangible and measureable organizational benefits (Allport & Cooke-Davies, 2010).”
Benefits of Alignment
The literature contains numerous examples of the benefits resulting from better alignment of development and manufacturing, including less risky product launches, a higher degree of process robustness, a lower cost of compliance, decreased development cycle time, improved manufacturing flexibility and efficiency, and a lower cost of goods sold (Suresh & Basu, 2008), as well as a smoother production ramp-up (Terwiesch & Bohn, 2001). Other studies have added that development and manufacturing alignment could lead to increased revenues, due to a faster time to market, and thus a reduction in the time required to reach peak sales (Tollman, Guy, & Altshuller, 2003; Burchill & Fine, 1997). Additionally, learning induced by early process development can ultimately reduce manufacturing costs and provide a strategic advantage because process development capabilities can act as a potential barrier to imitation (Pisano & Wheelwright, 1995) (Hayes, Pisano, Upton, & Wheelwright, 2005).
One of the most important benefits of collaboration and alignment between development and manufacturing is an improved process understanding across both organizations. A solid comprehension of the interdependence of product and process can enable a company to maximum run rate and minimize cost of goods manufactured (Han, Nelson, & Tsai, 2010). As others have noted, process understanding can also lead to reduced process variability, which can positively influence both product quality and productivity (Suresh & Basu, 2008). In this way, better process understanding is a win-win for any firm able to achieve it.
26
In summary, the importance of development-manufacturing alignment is widely understood, and firm-wide benefit has been demonstrated in many industries. As a result, many efforts have focused on initiating alignment in the biotechnology and pharmaceutical industries, but without an over-arching alignment strategy, there has been minimal documented success.
4 Project Approach
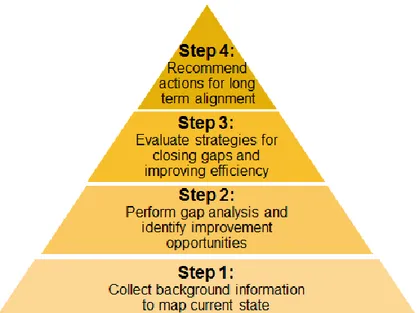
We organized the project to evolve in four sequential stages (Figure 4). First, we built a foundation of information to map out the current state – which groups run which procedures, on which equipment, to generate what data. Next, we analyzed the current state map for misalignments and other inefficiencies, and evaluated possible improvement opportunities. Then, based on the analysis, we developed a high-level alignment framework to be applied across the DP network. We used case studies based on existing areas of need to demonstrate the potential benefit of implementing this framework. Finally, we investigated the causes underlying misalignment and inefficiencies in the Amgen DP network and developed a set of recommendations to mitigate these existing issues and to establish the means for sustaining long-term alignment. The actual work performed in each of these four project stages is now described in detail.
27
4.1 Setting the Foundation
We sought to understand what each of the four groups in the network does, the equipment on which they do it, and the data they generate. When the project began, there was no single source of this information, and, in fact, some of the information was not recorded at all. As such, the project’s first step entailed collecting this information in its entirety. Once collected, this information would form the basis for the remainder of the project.
We collected information in three ways – by reading Amgen’s internal documentation,
interviewing personnel in the four groups, and touring the facilities. The first approach involved locating and then reading relevant Standard Operating Procedures for Clinical and Commercial Manufacturing, Study Guidelines for DPE and DPD, as well as Technical Reports, and Business Processes. This process primarily yielded detailed and up-to-date procedural information, particularly for the Manufacturing groups. The second approach consisted of identifying knowledgeable points of contact within the four groups and asking for information that could fill as many of the holes as possible in the current state map. Once these two approaches had been exhausted, we had a nearly complete understanding of the
procedures and data collected, but were still uncertain about some of the equipment used. To close this remaining knowledge gap, we scheduled tours of the Clinical Manufacturing facility and of the DPE and DPD laboratory areas. The tours allowed us see the equipment used in these facilities. Since we were not able to visit the commercial manufacturing sites, we had to rely on the equipment information collected for those sites by the first two approaches.
The resulting current state map is a single source that provides insight into the detailed procedures, equipment, and data collected by the groups in the DP network. Previously, this information was spread among hundreds of documents, sometimes only in personal files, or, in some cases, not recorded
anywhere. As such, combining the information into a single document allows for straightforward
comparison across all DP network groups and phases of development, a task of immense complexity prior to the creation of the map.
28
4.2 Analyzing
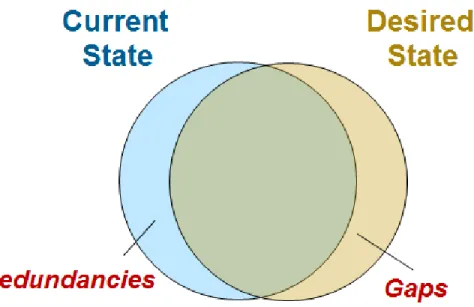
We took advantage of the current state map to perform such a comparison of the DP Network. In particular, the information in the map allowed us to conduct two straightforward analyses of network inefficiencies. First, we identified redundancies – tasks that are performed by multiple groups during the same stage of development, or tasks performed by the same group during different stages of development. For instance, both DPD and DPE might measure product viscosity during their First-In-Human
evaluations. Or, perhaps DPE performs a filterability assessment on the same product during different stages of development. These hypothetical examples would both constitute redundancies and would be highlighted during our analysis. Second, the current state map also allows us to identify gaps. Gaps can appear in a few different forms: equipment or procedural differences between development/engineering and manufacturing, or missed opportunities to collect data in one group when it would be useful to another group. Of course, some gaps and redundancies exist by design and are therefore not
‘inefficiencies.’ For this reason, all inefficiencies identified were sent for review to subject matter experts within each group. These experts were able to distinguish between acceptable and unacceptable gaps, as well as determine the completeness of our analysis. This latter point is particularly important, since the current state map was developed solely from sources to which we had access. This does not include the files of, or knowledge accumulated by, Amgen staff. For example, the documents we reviewed might have indicated that two inspection machines have matching model numbers, leading us to conclude that they are in fact identical. However, a staff member familiar with the machines might remember that one machine had a software upgrade that expanded its capabilities beyond that of the other machine. This is a gap that would have gone unidentified without the input of the process expert(s).
We also interviewed process experts and stakeholders to collect information on other inefficiencies that might not have been apparent during our document review. In particular, we were interested in understanding potential process improvements that could be achieved with different
29
equipment, better communication, improved process flow, or a reallocation of workload. We chose to focus the next part of the project on three of the areas identified.
Figure 5: Conceptual view of types of inefficiencies present in the DP Network
4.3 Strategies and Case Studies
In order to tie the analysis findings (inefficiencies and other areas of improvement) to realizable benefits for Amgen, a strategy or set of strategies is needed. We started by setting the following as an objective that the strategy would be designed to help meet: we want the right group to be running the
right procedures, on the right equipment, to generate the right data. Put another way, whenever data is
required, the group that can generate that exact data most efficiently should perform the data generation task. Achieving this state would mean that all data required for commercialization is generated as efficiently as possible, where efficiency is defined by cost, time, and labor. For example, data on product shear sensitivity may be generated by a study in which the product is exposed to representative shear rates and durations, after which critical product quality attributes are tested to determine the shear impact. While DPD and DPE may have the capability to perform a bench-top shear test using a rheometer, it could be that Clinical Manufacturing is able to more efficiently test the shear simply by running its normal process operation and then sending filled vials for product quality analysis. In this case, Clinical
30
Manufacturing can produce more representative data, since it is running the product through actual process equipment, and it can do it in less time with fewer resources by including the ‘study’ as part of its normal operation. This is only a hypothetical example, but it demonstrates our point; we need to consider all options to reach a state where the right group is always running the right procedures on the right equipment to generate the right data.
Reaching our desired state requires more than a procedural change or two; it requires a paradigm shift. Therefore, our strategy must be broad and impactful, affecting all groups in the DP network and changing their collective mindset. To achieve this, we propose as our strategy a framework that we call the Pilot Plant Cooperative (see Section 5.1 below for a full description) to provide the landscape on which the desired state can be built.
We chose to test the framework on case studies to prove the concept and demonstrate its potential benefits, as well as identify possible drawbacks. We selected for our case studies the three subjects suggested to us by our stakeholders: (1) DPE filling equipment evaluation to support Clinical and Commercial Manufacturing, (2) generation and transfer of useful from Clinical to Commercial Manufacturing, and (3) improvement of DPE’s First-In-Human process evaluations.
The first case study targets what is arguably the most critical unit operation: drug product filling. This is an important step during which a precise amount of liquid product is added to a vial or syringe at high speed. If the amount added is incorrect, or the filling operation adversely impacts product quality, the product must be rejected. For these reasons, it is crucial that the filling operation and its interaction with the product are well understood prior to filling actual product. Currently, this is done through a combination of filling studies in DPE labs, evaluations at a few filling machine vendor sites, and on-site evaluations using the Commercial filling equipment. In this case study, we apply the Pilot Plant
Cooperative concept to the filling unit operation to determine the best location for these studies and evaluate the costs and benefits of a few of the top options.
31
The second case study is based on the premise that Clinical Manufacturing, while creating material for use in clinical trials, also generates data that may be applicable to Commercial
Manufacturing. Theoretically, Clinical Manufacturing data can be used to replace or augment datasets generated in DPE labs or at the Commercial site, thus saving time and supporting a more robust transfer to the Commercial sites. Currently, however, very little data is generated at the Clinical sites due to equipment and procedural differences relative to the Commercial site, and also because of an incomplete understanding of what data is needed and how that data can be generated. Our case study applies the Pilot Plant Cooperative approach to determine how Clinical Manufacturing can best support Commercial Manufacturing. More specifically, we seek to understand which data would be most efficiently generated by Clinical Manufacturing with the existing equipment and procedures, and which additional data could be generated by Clinical Manufacturing if equipment were purchased or procedures updated. Based on the assessment, we make recommendations for achieving a more collaborative relationship between Clinical and Commercial Manufacturing.
Finally, DPE’s First-in-Human process evaluations were chosen because there is general acknowledgement that some of the current practices are inefficient, imperfect, or both. Our analysis involves in-depth looks at each of the eight process evaluations, from which we seek to understand the reason for performing the evaluation (i.e., what is the data generated used for) and how the evaluation is performed. Given this information, we applied the Pilot Plant Cooperative concept to determine whether better options for generating the data are available, or, if the data is not really needed, how the study can be eliminated. We developed recommendations for each of the eight studies and performed preliminary calculations to demonstrate the benefit of taking the suggested actions. Furthermore, evidence of the Pilot Plant Cooperative’s benefit to the FIH stage can serve as a strong indication that even greater gains can be made by applying it to other stages, such as CPD or PC.
32
4.4 Sustaining
The first three project stages focus on building a foundation of background information and then making strategic recommendations aimed at a more efficient commercialization process. However, the goal of the project is not just short-term progress but long-term, sustained improvement. This requires additional measures to ensure continued ownership of project-borne initiatives, business processes to align all groups in the DP network toward a common commercialization approach and goals, as well as other culture-based changes.
Our approach during this stage was to set in motion some of these measures, while making recommendations for others. For example, the current state map contains a wealth of information not currently available from a single source. It is of great value not just to DPE, but to all DP network groups, as it provides details on how each group compares to all the other groups. As such, it should be made available to all groups and kept up-to-date so that it remains just as useful in the future. To this end, we created a website on Amgen’s intranet to share all project documents, including the current state map. We also developed a plan to maintain the document’s relevance through annual updates based on a review of procedural changes and equipment purchases each year. Similar plans were put in place for other project documents containing useful data.
We divided our recommendations for this stage into two categories – Procedural and Cultural – to distinguish between simple document changes and deeper mentality shifts. The procedural category includes suggestions to update SOPs and guidelines to achieve more aligned practices between groups and to collect more relevant data, as well as to modify business processes to ensure alignment
implications are considered when making equipment purchase decisions, for instance. The cultural category, on the other hand, includes recommendations regarding behavioral incentives, hiring practices, and encouragement of cross-functional interaction. These are potentially more challenging because the cause-and-effect may not be fully understood (e.g. does hiring a strong a communicator mean that he/she will be more likely to build cross-functional relationships, or does an employee’s behavior depend more
33
on the environment into which he/she is placed?). Our recommendations touch on these uncertainties but focus more on initial steps to reach an improved state of alignment.
5 Analysis and Results
5.1 Strategic Alignment: Pilot Plant Cooperative
Achieving meaningful, widespread, and long-lasting commercialization efficiency improvement requires more than a few small projects targeting specific areas of process development or manufacturing. Rather, a framework is needed to fundamentally change the way commercialization is undertaken. As discussed earlier, the existing commercialization process has a number of inefficiencies that must be addressed. For example, the commercial site equipment is used to perform process characterization and other studies, which reduces the time available to formulate and fill commercial product.
Any framework that attends to this and other commercialization inefficiencies should meet a few important criteria. First, it must be simple; otherwise its adoption across the DP network is unlikely. It must also be inexpensive, or it risks rejection by management due to budgetary limitations. Finally, it should reduce boundaries between groups in the DP network and benefit all groups equally.
A traditional approach to improving the ability to perform commercialization-supporting studies – and the approach we initially investigated during this project – is to build a pilot plant. Pilot plants typically contain scaled-down versions of the commercial equipment and can be used to generate data to improve understanding of process behavior for a given product. Amgen has a few pilot plants fitting this description for its bulk drug substance process. However, its sole drug product pilot plant contains only a subset of the commercial process equipment, and this equipment does not fully represent all commercial processing conditions. For these reasons, an improved pilot plant with more representative equipment could provide the foundation for a vastly improved commercialization process.
34
While a new pilot plant has many benefits, it also requires significant investment in capital
equipment, as well as allocation of floor space in Amgen’s already full campus. However, we believe we can meet the user requirements while limiting (or perhaps reducing) costs through an alternative
approach. Rather than investing in a physical pilot plant, we instead propose a Pilot Plant Cooperative.
The Pilot Plant Cooperative, as we envision it, is similar to a traditional pilot plant in that it
facilitates the commercialization process by providing the means to generate all required data to support process scale-up and transfer. The difference is that it is not a single facility of scale-down equipment but a set of facilities and tools in multiple locations. Furthermore, like a traditional pilot plant, it consists of equipment (hardware), but it also includes models and a knowledge management system (software). In essence, the Pilot Plant Cooperative is a toolbox available to anyone in the DP network who requires data in support of process scale-up and transfer.
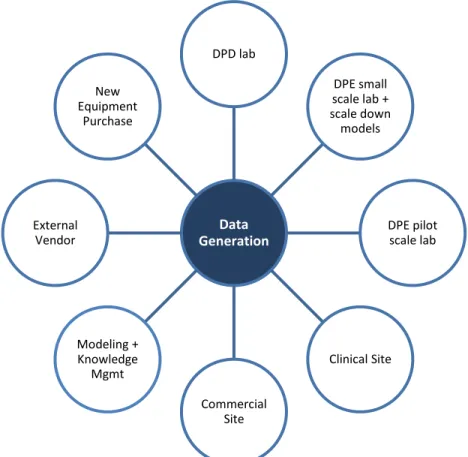
The way we foresee it working is as follows. A member of the DP Network would choose from among the Pilot Plant Cooperative’s available options (Figure 6) to generate any required data in the most efficient way possible. The most efficient way, typically, would be to use a model and/or historical data. This would require only a small amount of labor, no equipment, no additional investment, and would produce the necessary information (assuming the model had already been created and approved by Amgen Quality). If no such model was available, the next option would likely be to use existing equipment from somewhere in the network. One might first try to use equipment in a DPE or DPD laboratory, since this equipment has a greater likelihood of being idle and available than would other equipment in the Network. If not, the Clinical Manufacturing equipment might be used, or, as a last resort, the Commercial Manufacturing equipment. Neither of these latter two options is desirable when their use for a study means that clinical or commercial production would be delayed. Alternatively, an external vendor or a contract site could be used if the proper equipment is available. This option, of course, has a cost associated with it, and spending money for a study might not always be feasible. Finally, if all other options have been exhausted, or if a strong business case can be made, new equipment
35
can be purchased. The ultimate location of the equipment depends on the needs of the network.
However, the Pilot Plant Cooperative approach would encourage sharing of this equipment, regardless of its location.
Figure 6: Schematic of the Pilot Plant Cooperative
As an example of how the Pilot Plant Cooperative can be used, consider that a member of the DPE group requires information on a product’s freeze-thaw sensitivity. In the current setup, he or she performs a study using a controlled rate freezer in DPE’s laboratory. The Pilot Plant Cooperative would expand the DPE scientist’s options by providing access to existing data (e.g. freeze-thaw sensitivity of similar past products, or freeze-thaw data for this product generated by DPD), directing the scientist to a model that predicts freeze-thaw sensitivity based on other known product characteristics, or pointing the scientist to other equipment in the network, such as a Cryovessel in a DPD lab, or full-scale carboys in Clinical or Commercial Manufacturing, or even to outside vendors with appropriate equipment. In short, the Pilot
Data Generation DPD lab DPE small scale lab + scale down models DPE pilot scale lab Clinical Site Commercial Site Modeling + Knowledge Mgmt External Vendor New Equipment Purchase
36
Plant Cooperative expands the current capabilities in two key ways: providing access to data and models that can be used to replace or augment studies; and by changing the virtual structure of DP Network. This latter point may seem trivial – after all, nothing is actually being done to expand the physical capabilities of the DP Network – but it fosters a mindset adjustment that encourages “network thinking” in a way that helps break down superficial barriers between groups. A Pilot Plant Cooperative, once made available to all groups in the DP Network, opens doors to collaboration and cooperation in a way that would likely improve learning and mutual understanding, but that also as a byproduct increased efficiency due to equipment sharing and redistribution of workload based on time availability and relative equipment and personnel capabilities. These are all important points and will be discussed in more detail later.
5.2 Case Studies
To demonstrate possible applications of the Pilot Plant Cooperative, we chose three case studies, each designed to address an area of actual need within the DP Network. The first is an evaluation of the a filling equipment gap in DPE, the second is an investigation of ways in which Clinical Manufacturing can better support the commercialization process, and in the third we look at potential efficiency
improvements in early-stage process development studies. Each is discussed in detail in the following sections.
5.2.1 Case Study #1: Filling Equipment Investment
In our first case study, we investigate DPE’s support of the drug product filling unit operation. This unit operation is of great importance to Amgen, as it doses product into the presentation ultimately delivered to customers, and it therefore must conform to strict quality and procedural specifications.
Summary of Findings: Based on our analysis of DPE’s filling gap from the perspective of the Pilot Plant Cooperative, we recommend that Amgen purchases an automated filler for use by the DP Network during process development and characterization. This section describes the filling unit operation background, along with our analysis and more specific recommendations.
37
5.2.1.1 Background
Filling of the formulated product into primary containers is arguably the most critical drug product manufacturing unit operation. In this process step, product is dispensed into vials, syringes, or cartridges in precise amounts and at high speeds. Filling must be accomplished without dripping, spilling, or damaging the primary containers. Additionally, the filling process itself must not adversely impact product quality through exposure to high shear rates, incompatible materials, or excessive light and temperatures. As such, the process must be sufficiently well understood by the development and manufacturing groups so that it can be properly controlled and monitored.
Amgen currently develops its initial understanding of a product’s “fillability” (i.e. the ease with which a product can be filled in the manufacturing environment) through fill assessments in the DPE pilot laboratory. In these tests, DPE typically fills a number of vials or syringes of the size and fill volume expected to be used during manufacturing and notes any observations of dripping, foaming, product adhesion (i.e. the tendency of the product to adhere to and/or dry on the equipment and tubing), and fill speed limitations. The DPE evaluator also checks the fill weight to ensure the fill targets are consistently met with the given equipment settings and change parts. If any adverse observations are made, the evaluator may adjust the filling speed or switch to a different fill nozzle to improve the filling quality. Final filling equipment and procedural recommendations are then delivered to the manufacturing groups for use in their operations.
While the current system for performing fill evaluations in DPE works relatively well (few changes to DPE’s recommendations are typically required in manufacturing), the capabilities of DPE’s equipment do not sufficiently meet all of manufacturing’s needs. This is particularly true when preparing to transfer a product and process to commercial manufacturing. As a result, new commercial products require development time on the commercial filling equipment in order to better characterize the filling process and prepare for process validation. This situation presents commercial site scheduling challenges to accommodate fill characterization activities without disrupting the production schedule for other
38
commercial products. Scheduling conflicts have the potential to cause a delay to either the development work or the commercial production, each with significant associated costs. Additional costs have arisen in the past when commercial line time was not available and Amgen was forced to use equipment vendors for product-specific testing.
Filling Process Description
The filling unit operation is set up in generally the same way at Amgen’s clinical and commercial manufacturing facilities, for both syringes and vials. Formulated drug product, stored in a stainless steel hold tank in a 2-8º C cold room, is transported with the tank into the filling suite. In the suite, the tank is elevated to an appropriate height for transfer and then connected to a filtration skid. The tank is
pressurized, forcing the product out through a silicone hose and through a sterilizing filter. After
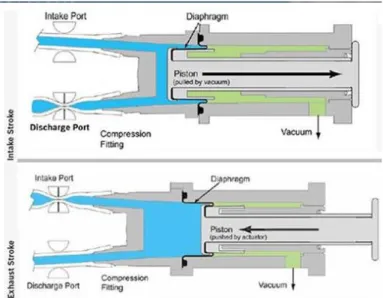
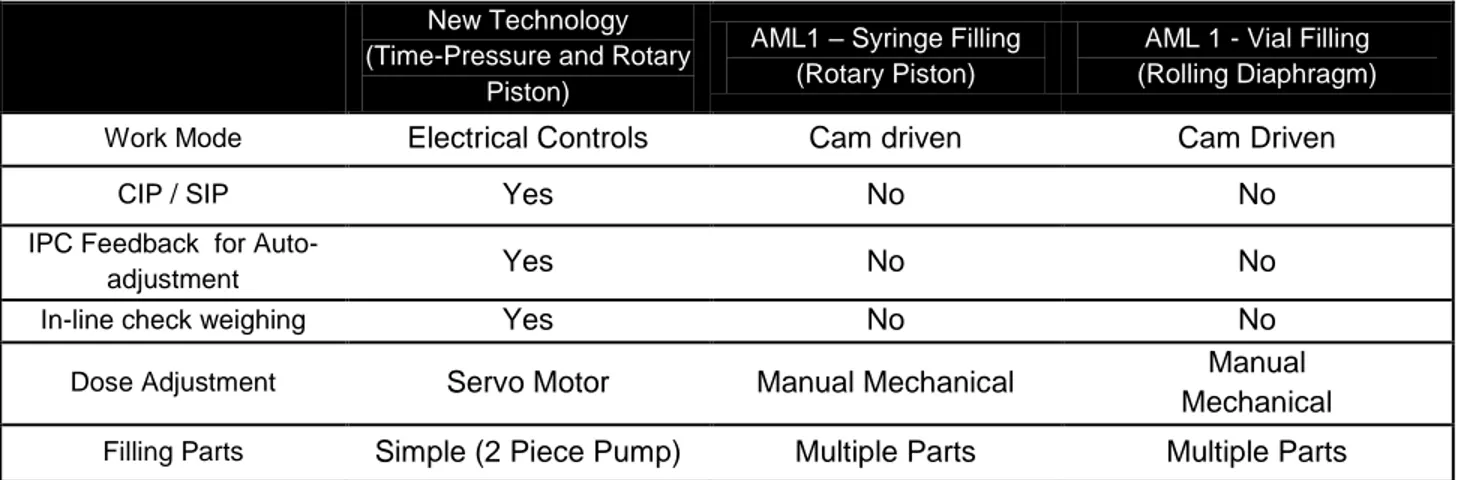
filtration, the product continues through another hose and into a glass surge vessel, where it is temporarily stored before filling. From the surge vessel, the product enters the filler and can follow one of a few different routes to the filling needles, depending on the machine used and its components. Amgen’s fillers use three different dosing mechanisms: a rolling diaphragm pump, a rotary piston pump, and time-pressure, all of which are described in detail later. The product dose flows through the filling needles (which can number anywhere between 1 and 16, depending on the filler and setup) and into the primary container. Amgen products are usually filled into vials between 3- and 20-cc and 1-mL syringes, and all Amgen’s filling machines are able to accommodate these sizes. Once filled, vials are stoppered and capped, and syringes are plungered. The sealed containers are later visually inspected (either by machine or operator), packed, and sent to the warehouse.
Product Quality and Process Performance
As described above, the drug product is dispensed into its final container (usually a vial or syringe) during the filling operation. Thus, the filling process constitutes the last time the product undergoes physical manipulation outside the final container. Up to this point, significant time and material, both with substantial associated costs, have gone into manufacturing the product. In most cases,
39
the product has undergone cell culture scale-up, harvest, purification, and drug product formulation – in total, months of production time – before reaching the filling operation. A performance issue or adverse product quality impact at this point could mean discarding material that has a high production cost and even higher sales value. It is therefore of great importance that the filling operation and its product impact are well understood prior to manufacturing initiation.
In general, the filling unit operation can impact product quality in two ways. First, shear stress is placed on the product by the dosing mechanism and the nozzle head. Shear-sensitive products may incur protein damage due to shear rates above a certain product-specific threshold. Second, the environment to which product is exposed can affect the product. This includes product contact materials – stainless steel, silicone tubing, and glass – as well as oxygen, light, and room temperature.
Just as critical as product quality to the success of the filling operation are process performance and consistency. Performance is measured, for example, in terms of the percentage of rejected units (a lower number obviously being preferred), while consistency can be determined by fill weight precision relative to the target (a small spread represents a higher consistency). Other performance and consistency metrics include percent unplanned machine downtime, number of broken or scratched vials/syringes, amount of discarded product, total fill rate (units per minute), and a host of others.
Product quality impact and process performance and consistency are of such importance for the filling operation, additional discussion is devoted below to describing some of the mechanisms of product impact and the potential consequences to the drug product, as well as the controls and limits in place for ensuring a consistent and robust process.
Shear
The most relevant factor affecting product quality during filling is shear stress, or the force per unit area acting on a fluid due to the presence of a velocity gradient and depends on both the shear rate and the fluid viscosity (Macosko, 1994). Shear rates for unit operations, such as filling, can be estimated