HAL Id: hal-01275593
https://hal.archives-ouvertes.fr/hal-01275593
Preprint submitted on 17 Feb 2016HAL is a multi-disciplinary open access
archive for the deposit and dissemination of sci-entific research documents, whether they are pub-lished or not. The documents may come from teaching and research institutions in France or abroad, or from public or private research centers.
L’archive ouverte pluridisciplinaire HAL, est destinée au dépôt et à la diffusion de documents scientifiques de niveau recherche, publiés ou non, émanant des établissements d’enseignement et de recherche français ou étrangers, des laboratoires publics ou privés.
Two historical changes in the narrative of energy
forecasts
Minh Ha-Duong, Franck Nadaud, Martin Jegard
To cite this version:
Minh Ha-Duong, Franck Nadaud, Martin Jegard. Two historical changes in the narrative of energy forecasts. 2016. �hal-01275593�
To be submitted as short communication to Technological Forecasting & Social Change 2067 words, 13095 characters
Two historical changes in the narrative of energy forecasts
Minh Ha-Duong a, b Franck Nadaud a, 1 Martin Jegard a
2016-02-17
a CIRED, CNRS, 45 bis avenue de la belle Gabrielle, 94736 Nogent-sur-Marne, France. b CleanED, Université de Sciences et Technologies de Hanoi, Vietnam
1 Corresponding author, contact : [email protected]
Abstract : A collection of 417 energy scenarios was assembled and harmonized to compare
what they said about nuclear, fossil and renewable energy thirty years from their publication. Based on data analysis, we divide the recent history of the energy forecasting in three periods. The first is defined by a decline in nuclear optimism, approximately until 1990. The second by a stability of forecasts, approximately until 2005. The third by a rise in the forecasted share of renewable energy sources. We also find that forecasts tend to cohere, that is they have a low dispersion within periods compared to the change across periods.
1. Introduction
Energy forecasts have been influencing energy and climate policies for over thirty years. For [3] “forecasts are the mirrors of our ignorance not the embodiments of our understanding”, and “are not worth even the cost of the cheapest acid-free paper on which they get printed”. This castigates the whole scenario-making exercise as –at best– an art of communication rather than a science. While energy scenarios indeed are not predictions, and while there are systematic biases which sometimes lie with the modeler as much as in the process, and while quality should always be improved, we argue that forecasts are much more than lobbying accessories. Various strands of scientific reflexive literature look at the methods, functions and assumptions of energy forecasts. For example [1,6] describe useful guidelines for current practitioners based on methodologically sound practices. Others like [2,5] analyze the sources of errors with comparisons between global energy scenarios and thirty years of actual historical experience. In contrast to these strands of literature, we adopt a non-prescriptive, non-judgmental approach to look at the history of energy forecasting from 1977 to 2014. The next section describes the method and data: we assembled a collection of 417 energy scenarios, harmonized the results, and limited ourselves to interpreting the exploratory data analysis. Section 3 demonstrates how this time span of almost forty years can be organized in three periods. Section 4 concludes this short note.
2. Method and data
The sample counts 122 energy studies. These studies span a publication period running from 1977 to 2014. Their scopes vary from global to national. Some are annual series such as the IEA's World Energy Outlook and the EIA's Annual Energy Outlook, others are sporadic forecasts. Since a single study usually contains multiple scenarios, the dataset counts 417 different scenarios. The dataset expands [7], which was based on a collection of 88 studies and 322 scenarios.
The collection is a comprehensive rather than a random sample. We sought to include all influential forecasts available. This implies a bias towards more recent forecasts. Energy forecasting exercises became more common over time, recent studies are both more accessible and they provide more forecasts each than earlier studies. The number of observations is roughly the same before and after 2005. We omitted from the sample three studies from 1971, 1973 and 1975. Those forecast nuclear at respectively 50%, 50% and 25% of the energy mix, so adding they back would only support our results.
Energy forecasting studies all differ in regional scope, regional division, forecast horizon, energy units accounting, currency units accounting, scenario building methodology, and background hypotheses. It is necessary to harmonize their results in order to compare them on a common ground. We did so in five steps, using straightforward if time-consuming transformations. First, we organized energy mix forecasts using only three primary energy source categories: fossil, nuclear and renewable. Second, all forecasts were converted into ton oil equivalent (toe), the common unit employed in energy economics. Third, the results of each study were recast into a common constant forecast horizon set to 30 years, interpolating if necessary. Fourth, relative shares for each category were computed for every scenario in each study. Fifth and finally, the median shares were computed among all the scenarios for each study. Reference [7] describes the method more thoroughly.
3. Results
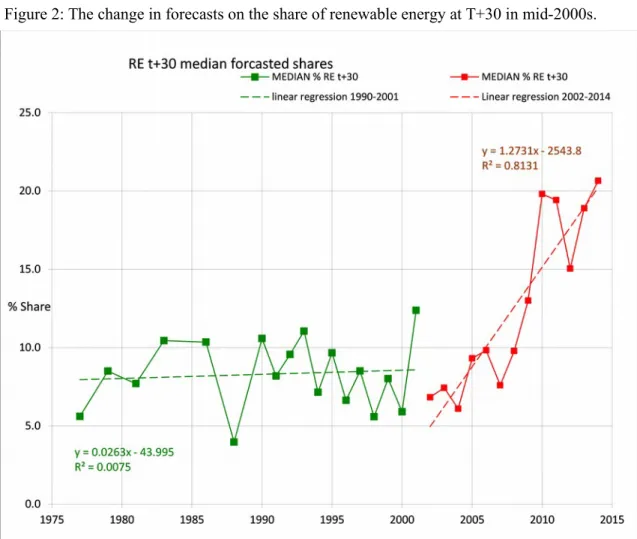
Figure 1 presents the history of the 30-years forecasts of primary energy shares for nuclear, fossil and renewable energy. For nuclear energy, technological optimism steeply declined from the end 1970’s to the mid 1980’s. Then the forecasted t + 30 share of nuclear energy stabilizes around a share of about five percent. A slowly rising trend is perceptible since the end 1990’s. For the forecasted t + 30 share of renewable energy, Figure 1 shows first a plateau from the 1980’s onwards at about 10%, with a drop from the mid-1990’s to mid-2000’s and a very sharp rise after 2005. We quantified these trends using linear regression over 1977-2001 and 2002-2014, see Figure 2. Linear regressions show a flat trend between 1977 and 2001, followed by significant positive increase since 2002. The place of renewable in the forecasted primary energy mix has drastically changed since the 2000’s, going from about 7% to more than 20%. The picture regarding forecasts of fossil fuel primary energy is somewhat different. A plateau is discernible from the 1970’s to the mid 1980’s, followed by a regular rise of its share peaking in the mid 1990’s, and decrease after that. We quantified these trends by linear regression over 1977-2000 and 2000-2014 (figure not shown). The moving average smoothers for both period and the linear regressions show opposite trends in forecasts. For the period 1977-2000, the share of forecasted fossil primary energy rises from about 70% to about 90%, mainly because of the fall in nuclear optimism. In the 2000-2014 period, the graph shows a drop from about 90% to
70% in the forecasted fossil primary energy share, practically a return to the initial forecasted share. In the forecasts, the decrease of the fossil energy share is mostly balanced by an increase in renewable energy share since we saw that the increase in nuclear energy share is small.
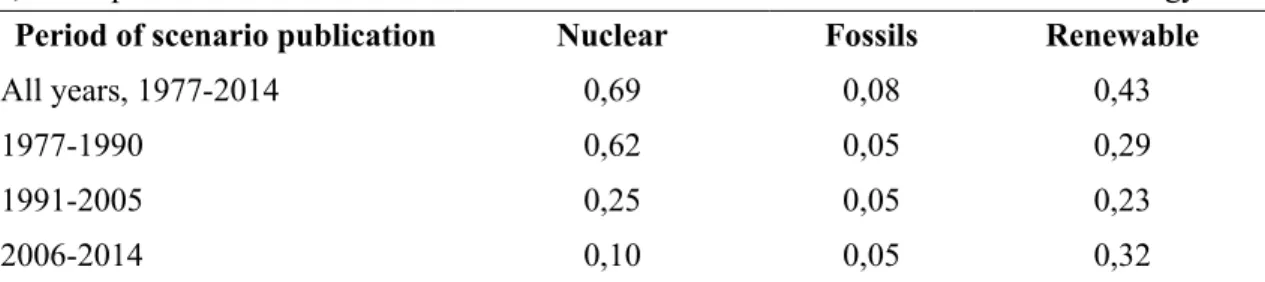
Combining the changes for forecasted shares of nuclear and of renewable primary energy, our data suggest that the history of recent energy forecasting can be divided into three periods. To adopt round numbers as the breaking points, the periods are 1977-1990, 1991-2005, 2006-2014. We examined the extend to which the median scenario remained unchanged within each time period. To this end we used a common statistic: the coefficient of variation, also called the relative standard dispersion, defined as the ratio of the standard deviation over the mean of a sample. Table 1 indicates the coefficient of variation of the median forecasted shares per year for the whole period and the three periods identified above.
The “Fossils” column shows that coefficients of variation are low and do not change: 0.05 within each period. The meaning is that the median forecasts for the share of fossils fuels do not change much within a period. The overall coefficient is also low.
The “Nuclear” column shows that forecasts about nuclear energy have a high coefficient of variation, 0.62, in the first period. This is as expected, since the period is defined as years in which where nuclear optimism decreases. The coefficient drops to 0.25 in the second period, then 0.10 in the third. This shows that since 1990, studies hold a more stable view about nuclear. The “Renewable” column tells a different story. The third period being defined as the one where the forecasted share of renewable energy increase, the variability around the trend also increase in that period, at 0.32. But this effect is less marked than for nuclear. The median forecast is not very stable in any period, compared to the other two primary energy sources.
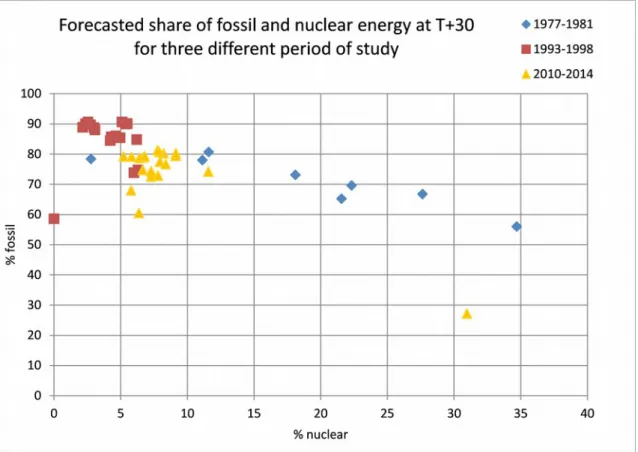
Figure 3 shows more detailed data. For simplicity, we plot only three time span of five year, and we omit the “share of renewable” dimension. This confirms that the 1977 - 1981 time span belongs to a period of rapid forecasts change regarding nuclear. It also confirms that in the later two five year time span, studies published within a period lie close to each other, compared to the difference across periods.
4. Summary and concluding remarks
In summary, we have shown that in energy forecasts, technological optimism about renewable energy replaced technological optimism about nuclear energy. The history of forecast about shares of primary energy for the 37 years studied can be organized in three periods.
A first period is characterized by a severe decline in nuclear technological optimism which coincides with a rise in the forecasted share of fossil fuels, with the share of renewable energy relatively low. The Chernobyl catastrophe in 1986, appears near the end of the period. It did not cause this decline which was already ongoing before it occurred.
This is followed by about fifteen years of stable forecasts, the 1990-2005 period.
A third period, since the mid-2000's, shows a modest rise in nuclear energy and a very steep rise in forecasted share of renewable energy. This third period clearly signals a new form of technological optimism obviously driven by the climate change challenges. As the Kyoto Protocol was signed in 1997, it appears that it took more than five years to convince energy forecasters that the system would really change.
This periodization is possible because our historical analysis of 122 studies suggests that energy forecasts exhibit collective behavior. Within a 5 year period, forecasts tend to stay close to each other. Deviations between studies are small in front of the deviations across periods. Modelers’ representations of the future tend to follow a common world view, this is not just an art of communication. There is tendency to cohere around what are obvious manifestations of the given “zeitgeist” of the time.
Is collective behavior in energy forecasting a good or a bad finding for the discipline? Convergent results from independent sources strengthen scientific results, but coordinated anticipations about long-term events can be driven more by speculation than by rationality. With regard to that, we believe that the two forecasts changes we detected were not mostly subjective, but that they reflect objective changes in the underlying social system.
5. References
[1] Wright, G., Bradfield, R., Cairns, G., 2013. Does the intuitive logics method – and its recent enhancements – produce “effective” scenarios? Technological Forecasting and Social Change, Scenario Method: Current developments in theory and practice 80, 631–642. doi:10.1016/j.techfore.2012.09.003 [2] Winebrake, J.J., Sakva, D., 2006. An evaluation of errors in US energy forecasts: 1982–2003. Energy Policy 34, 3475–3483. doi:10.1016/j.enpol.2005.07.018
[3] Smil, V., 2006. Energy at the crossroads. OECD Global Science Forum- Conference on Scientific Challenges for Energy Research. URL accessed 2015-09-07.
[4] Bryant, J.W., Thomas, S.D., 1980. A modeling framework for comparative testing of energy forecasts. European Journal of Operational Research 5, 309–320. doi:10.1016/0377-2217(80)90161-7
[5] Bezdek, R.H., Wendling, R.M., 2002. A half century of long-range energy forecasts: errors made, lessons learned, and implications for forecasting. Journal of Fusion Energy 155/172.
doi:10.1023/A:1026208113925
[6] O’Mahony, T., 2014. Integrated scenarios for energy: A methodology for the short term. Future 55, 41–57. doi:10.1016/j.futures.2013.11.002
[7] Nadaud, F., Hourcade, J.-C., 2010. Thirty-five Years of Long-run Energy Forecasting: Lessons for Climate change Policy, World Bank Policy Research Working Paper, number WPS5298. URL accessed 2016-02-17.
6. Figures and table with captions
Table 1: The variability of consensus. Higher coefficients means more variable median forecasts over time. For example: the coefficients of variation of the median of scenarios, for nuclear energy, for scenarios published between 1977 and 1990, is 0.62. This means that the standard deviation of the median forecast is large in front of the mean. Indeed, as can be seen on Figure 1, in the period the median forecast decreased from over 25% to less than 5% of the energy mix.
Period of scenario publication Nuclear Fossils Renewable
All years, 1977-2014 0,69 0,08 0,43
1977-1990 0,62 0,05 0,29
1991-2005 0,25 0,05 0,23
Figure 1: Evolution of the T+30 forecasts of the share of nuclear, fossil and renewable energy