HAL Id: hal-00298401
https://hal.archives-ouvertes.fr/hal-00298401
Submitted on 25 Jul 2006HAL is a multi-disciplinary open access
archive for the deposit and dissemination of sci-entific research documents, whether they are pub-lished or not. The documents may come from teaching and research institutions in France or abroad, or from public or private research centers.
L’archive ouverte pluridisciplinaire HAL, est destinée au dépôt et à la diffusion de documents scientifiques de niveau recherche, publiés ou non, émanant des établissements d’enseignement et de recherche français ou étrangers, des laboratoires publics ou privés.
Distribution and transport processes of marine
particulate matter off Cape Blanc (NW-Africa): results
from vertical camera profiles
N. Nowald, G. Karakas, V. Ratmeyer, G. Fischer, R. Schlitzer, R. A.
Davenport, G. Wefer
To cite this version:
N. Nowald, G. Karakas, V. Ratmeyer, G. Fischer, R. Schlitzer, et al.. Distribution and transport processes of marine particulate matter off Cape Blanc (NW-Africa): results from vertical camera profiles. Ocean Science Discussions, European Geosciences Union, 2006, 3 (4), pp.903-938. �hal-00298401�
OSD
3, 903–938, 2006 Distribution and transport processes of marine particles N. Nowald et al. Title Page Abstract Introduction Conclusions References Tables Figures J I J I Back CloseFull Screen / Esc
Printer-friendly Version Interactive Discussion
EGU
Ocean Sci. Discuss., 3, 903–938, 2006 www.ocean-sci-discuss.net/3/903/2006/ © Author(s) 2006. This work is licensed under a Creative Commons License.
Ocean Science Discussions
Papers published in Ocean Science Discussions are under open-access review for the journal Ocean Science
Distribution and transport processes of
marine particulate matter o
ff Cape Blanc
(NW-Africa): results from vertical camera
profiles
N. Nowald1, G. Karakas2, V. Ratmeyer1, G. Fischer1, R. Schlitzer2, R. A. Davenport1, and G. Wefer1
1
University of Bremen, Department of Geosciences, Klagenfurterstrasse, 28359 Bremen 2
Alfred Wegener Institute Foundation for Polar and Marine Research, B ¨urgermeister-Smidt-Straße 20, 27568 Bremerhaven
Received: 29 May 2006 – Accepted: 17 July 2006 – Published: 25 July 2006 Correspondence to: N. Nowald ([email protected])
OSD
3, 903–938, 2006 Distribution and transport processes of marine particles N. Nowald et al. Title Page Abstract Introduction Conclusions References Tables Figures J I J I Back CloseFull Screen / Esc
Printer-friendly Version Interactive Discussion
EGU
Abstract
In this study, we present vertical particle profiles acquired with the deep-sea camera system ParCa. The profiles were obtained during three campaigns in the spring sea-sons of 2001–2003 off NW-Africa (Cape Blanc). The camera profiles showed interan-nual and spatial variabilities regarding the particle concentrations in the ocean surface 5
which were related to changes in the Chl-a biomass concentration. Although parti-cle concentrations varied, all profiles showed rather similar distribution patterns. They were characterised by a subsurface particle maximum layer, around 200 m at stations close to the coast and around 400 m at stations further offshore. We argue, that at least a portion of the material seen in the subsurface maximum originates from the 10
coast, and was laterally advected towards the open ocean by filament activity. Apart from this offshore transport, increased concentrations of particulate matter above the seafloor suggest a downslope transport of particulate matter near the seafloor. Both hypothesis were tested with model computations, described in a companion paper. A special sedimentation event was observed during a field campaign in 2001. The par-15
ticle abundance patterns and the size distributions most likely reflect a sinking event, where particulate matter is transferred on very short time scales from the surface to the seafloor. We assume, that the fast sinking particle cloud preferably scavenges the more abundant small particles, resulting in larger particles sizes above and within the sinking cloud.
20
1 Introduction
The flux of particulate matter from the ocean surface to the deep-sea plays an important role in the global CO2-cycle. Atmospheric carbon dioxide is removed via phytoplankton from the surface waters and stored over longer periods in the deep water column and the sediments when sinking to the deep-sea. The export of particulate matter from the 25
OSD
3, 903–938, 2006 Distribution and transport processes of marine particles N. Nowald et al. Title Page Abstract Introduction Conclusions References Tables Figures J I J I Back CloseFull Screen / Esc
Printer-friendly Version Interactive Discussion
EGU
known as marine snow. Marine snow, by definition are aggregated particles >0.5 mm (Fowler and Knauer, 1986; McCave, 1975), composed of small particles from organic and inorganic sources. More than 50% of the organic carbon embedded in particulate matter is remineralised within the upper 300 m of the water column (Martin et al., 1987), so its contribution to the mass transfer of nutrients and elements from the ocean surface 5
to the seafloor is mainly a function of their vertical distribution, composition, size, and sinking rate (Asper, 1987; Gardner and Walsh, 1990; MacIntyre et al., 1995; Walsh and Gardner, 1992).
Areas of increased particle export are the upwelling systems along the continental margins. One of the world’s largest upwelling system is located off Cape Blanc (NW-10
Africa) which belongs to one of the four most important Eastern Boundary Current systems (EBCs). EBCs have long been known for very high primary production rates in the ocean surface (Carr, 2002) and although coastal upwelling system cover a rather small area, they contribute to 7% to the total ocean primary production of 50 GT yr−1 (Longhurst et al., 1995; Antoine et al., 1996; Behrenfeld and Falkowski, 1997; Chen et 15
al., 2003).
Upwelling is a wind driven process and strongly coupled to the persistent trade winds, that displace surface waters offshore. Upwelling off Cape Blanc occurs throughout the year (Nykjaer and Van Camp, 1994), with periods of stronger intensity during spring, early summer and fall (Barton, 1998; Mittelstaedt, 1991; Van Camp et al., 1991). Al-20
though the upwelling belt is only about 50 to 70 km wide (Van Camp et al., 1991), giant filaments of chlorophyll-enriched water are advected 300 km (Hernandez-Guerra and Nykjaer, 1997) to 600 km offshore (Gabric et al., 1993). This offshore vectored trans-port of material from the coastal near areas is retrans-ported to be an imtrans-portant mechanism for the export of nutrient-rich waters towards the open ocean and is partly responsible 25
for increased primary productivity offshore (Gabric et al., 1996).
Nevertheless, little is known about the processes which control the transfer of par-ticles from the surface to the ocean bottom. Martin et al. (1987) suggested that the flux of particulate matter to the seafloor is primary a function of the primary
produc-OSD
3, 903–938, 2006 Distribution and transport processes of marine particles N. Nowald et al. Title Page Abstract Introduction Conclusions References Tables Figures J I J I Back CloseFull Screen / Esc
Printer-friendly Version Interactive Discussion
EGU
tion conditions in the ocean surface. More recent studies point out the role of ballast minerals, such as calcium carbonate, controlling the export rates of organic carbon to the deep-sea (Armstrong et al., 2002; Francois et al., 2002; Klaas and Archer, 2002). The fluxes were in the first instance determined by carbonate minerals and their sea-sonality, leading to different sinking velocities and biodegradability of organic carbon. 5
According to Berelson (2002) and Francois et al. (2002), other ballast minerals such as lithogenic particles or biogenic opal were not related to organic carbon transfer and obviously do not increase particle sinking velocities.
The region off Cape Blanc is characterised by high total particle flux rates (up to 350 mg m−2d−1; Fischer et al., 1996a) and enhanced export of particulate matter 10
(Schlitzer, 2000), leading to high sedimentation rates of more than 18 g cm−2ky−1 dur-ing the last 5000 years (de Menocal et al., 2000). The flux of particulate matter from the ocean surface to the deep-sea in this specific region, display distinct interannual vari-bility and no clear seasonal pattern (Bory et al., 2001; Fischer et al., 1996a; Ratmeyer et al., 1999a; Romero et al., 2002) as for instance observed in the Canary Island region 15
(Neuer et al., 1997). Flux maxima can occur in summer, spring and fall throughout the years (Fischer et al., 2006). However, the processes for these variabilities are not suf-ficiently understood and may, apart from regional changes in the oceanographical and atmospherical conditions, be even influenced by larger scale climate variations such as NAO (Moulin et al., 1997) or ENSO (Hagen, 2001; Roy and Reason, 2001).
20
Calcium carbonate contributes to up to 50% of the total annual flux (11–27 g m−2y−1) and coccolithophorids appear to play a key role regarding the transfer of organic carbon to the seafloor off Cape Blanc (Fischer et al., 1996a; Fischer et al., 2006). Highest organic carbon fluxes with highest sinking rates (50 m d−1 up to 300 m d−1; M ¨uller and Fischer, 2001) were estimated for coccolithophorid blooms and not for instance, during 25
increased diatom sedimentation (Romero et al., 2002). Furthermore, the region off Cape Blanc is strongly influenced by the input of lithogenic material blown offshore by the prevailing wind systems (Prospero, 1996). The yearly dust input from the continents into the Cape Blanc region by the prevailing wind systems range between 2.0 and
OSD
3, 903–938, 2006 Distribution and transport processes of marine particles N. Nowald et al. Title Page Abstract Introduction Conclusions References Tables Figures J I J I Back CloseFull Screen / Esc
Printer-friendly Version Interactive Discussion
EGU
8.7×10⁶t y−1 (Sch ¨utz et al., 1990). Hence, the lithogenic fraction is the second most important bulk flux constituent with flux rates between 8 and 22 g m−2y−1(Fischer et al., 2006). Ratmeyer et al. (1999a, b) showed, that lithogenic particle flux can be correlated to the atmospheric circulation patterns and dust may affect surface productivity and/or particle sinking rates. Although dust may be a potential ballast mineral, the correlation 5
between organic carbon and lithogenic fluxes are not highly significant. Sometimes, there is an apparent decoupling of both constituents (Fischer et al., 2006; Bory et al., 2002) which is not sufficiently understood and occurs for instance, during times of increased POC flux (Bory and Newton, 2000).
Although significant progress in our understanding of this highly dynamic upwelling 10
system was made, little is still known about the in-situ distribution of particulate matter off NW-Africa. Our knowledge about the shape, size and vertical distribution of particles in the ocean is mainly based on non-destructive, optical methods like camera systems. Although profiling camera systems are in use since 20 years, the amount of optical datasets are comparably low which is in the first instance related to the low temporal 15
and spatial resolution of vertical profiles and the complexity of such systems. Since the introduction of this method by Honjo et al. (1984), studies on the vertical distribution of particulate matter were carried out throughout the world oceans (e.g. Diercks and Asper, 1997; Gardner and Walsh, 1990; Walsh and Gardner, 1992; Asper et al., 1992; MacIntyre et al., 1995; Ratmeyer and Wefer, 1996; Stemmann et al., 2002). Particle 20
concentrations and distribution patterns are highly variable on small and large temporal and spatial scales. Significant changes in the particle concentrations were observed for 4 years in the Mediterranean Sea and were related to primary production, deep vertical mixing and thermal stratification (Stemmann et al., 2002). However, changes in the particle distribution occur also on daily scales and are affected by turbulences and 25
mixing after wind events and biological factors such as grazing, growth or respiration (Walsh et al., 1995; Stemmann et al., 2000).
In this study, we present 9 vertical camera profiles from the Cape Blanc region. All profiles were obtained in the spring season (early April–late May) during three cruises
OSD
3, 903–938, 2006 Distribution and transport processes of marine particles N. Nowald et al. Title Page Abstract Introduction Conclusions References Tables Figures J I J I Back CloseFull Screen / Esc
Printer-friendly Version Interactive Discussion
EGU
between 2001 and 2003. We applied these data to discuss the following questions: 1. How is particulate matter distributed in the water column off Cape Blanc?
2. Which factors and mechanisms are responsible for specific particle abundance patterns in the water column?
3. What are the possible transport processes and pathways of particulate matter 5
2 Methods
2.1 Investigation area
The study site is located off Cape Blanc/Mauritania and the investigation area is a rectangle of approximately 450 km×300 km. The profiles were acquired during three cruises with the vessels RV Poseidon and RV Meteor. Profiles along Tansect 1 were 10
aqcuired in April 2001 in east-west direction. Profiles along Tansect 2 were acquired alongshore during April and May 2002 and Tansect 3 in May/June 2003, again in east-west direction (Fig. 1). Profile depths range between 1200 m on the midslope areas down to 4000 m in the abyssal plains. The particle camera was usually lowered at a winch speed of 0.3 m s−1 from the surface to the seafloor, acquiring images from the 15
entire water column at depth intervals of 10 m. A detailed station list is presented in Table 1.
2.2 Camera system description
The optical datasets were obtained with the deep-sea camera system ParCa, de-scribed in Ratmeyer and Wefer (1996). The optical setup is based on camera systems 20
used by Honjo et al. (1984), Asper (1987) and others. ParCa employs a modified, programmable PHOTOSEA 70 middle format camera. Compared to standard 35 mm
OSD
3, 903–938, 2006 Distribution and transport processes of marine particles N. Nowald et al. Title Page Abstract Introduction Conclusions References Tables Figures J I J I Back CloseFull Screen / Esc
Printer-friendly Version Interactive Discussion
EGU
camera systems, the 6×6 cm sized negatives provide images with a much higher res-olution. ParCa is equipped with a light-sensitive KODAK TRI-X Pan film for enhanced results in low light situations. Up to 350 single frames can be stored in the camera’s magazine. A strobe, mounted perpendicular to the camera, shoots a collimated light beam of 12 cm width and the power supply is provided by a 24 V/38 Ah battery. The 5
optical setup of the camera system provides sharp images without blurring effects. All system components are mounted in a galvanised frame, with a weight of approximately 200 kg. In comparison to the ParCa system described in Ratmeyer and Wefer (1996), the improved version is equipped with a SeaBird 36 telemetry unit and a SeaBird 19 CTD. The CTD transmits the pressure values to ParCa’s controller and triggers it at 10
given depth intervals. The telemetry unit provides full control over the system and trig-ger depth information, while it is being lowered on the ship’s coaxial wire. To prevent interference with ambient light, ParCa was deployed during night times only.
2.3 Image capturing and data extraction
The digitalisation of the negatives after developement was carried out by using an 15
ADIMEC MX12 CCD 8-bit grey scale camera (1024×1024 pixel resolution) and an IC PCI Imaging Technology frame-grabber card. To provide a good size/resolution relationship of the acquired particles in the sample volume, a section of the neg-ative was digitised. The size calibrated frame width of this section is equivalent to 187 cm×187 cm, resulting in a sample volume of 4.19 l. The smallest measurable par-20
ticle size with this image analysis setup is 180 µm. This means that a portion of the small particle spectra is not acquired by the system, but the detection limit of ParCa is restricted to the physical limitations of its optical properties. Nevertheless, the detection limit is well within ranges of similar systems, such as the UVP IV (>90 µm, Gorsky et al., 2000) or the MSP (>600 µm, Lampitt et al., 1993). Within the digital image analysis 25
software OPTIMAS, the automated image processing and data extraction procedure was provided by an adapted OPTIMAS macro file. This macro was used to export the datasets of particle abundance and particle size to a worksheet for further data
OSD
3, 903–938, 2006 Distribution and transport processes of marine particles N. Nowald et al. Title Page Abstract Introduction Conclusions References Tables Figures J I J I Back CloseFull Screen / Esc
Printer-friendly Version Interactive Discussion
EGU
preparation.
2.4 Particle abundance
The image analysis software recognises particles as areas in the 2-dimensional pic-tures. The abundance of particles was computed by counting the number of areas, i.e. particles, on each image. An 8-bit grey-scale threshold (Burdick, 1997; Parker, 5
1997) was used to distinguish between the background and the particles in the fore-ground. Zooplankton was excluded from the measurement by being cut away from the image. The size of the recognised particles is calculated as their Equivalent Spherical Diameter (ESD). An algorithm computes all areas to regular, geometrical circles and extracts the ESD.
10
2.5 Particle-size distribution
To investigate the in-situ vertical size distribution of particulate matter, 24 size classes were defined ranging from ≤185 µm to >2000 µm (Table 2). For illustrating the change of particle sizes with depth, the particle concentrations of each size class were aver-aged over a depth interval of 100 m. Afterwards, the absolute numbers of each size 15
class were converted to their frequencies in percent and encoded into colour spec-tra, where blue colours represent low, and white to yellow colours high frequencies. This conversion from absolute numbers to freqencies was necessary, due to the broad range of particle concentrations acquired by the camera (n=2–250 part l−1). The us-age of absolute numbers prohibited a proper illustration of the size distribution in a way, 20
that changes in the particle size spectra with depth become not visible. 2.6 SeaWiFS satellite imagery
SeaWiFS chlorophyll datasets with a 9 km pixel resolution were processed with the data analysis software SeaDAS in order to display the biomass distribution in the ocean surface during the camera deployments. The optimal method is to use daily 25
OSD
3, 903–938, 2006 Distribution and transport processes of marine particles N. Nowald et al. Title Page Abstract Introduction Conclusions References Tables Figures J I J I Back CloseFull Screen / Esc
Printer-friendly Version Interactive Discussion
EGU
SeaWiFS datasets, corresponding with the deployment times of the particle camera. Unfortunately this was not possible because of cloud and/or dust cover on all except one ParCa deployment date. We therefore used 8-day averaged chlorophyll-a data for 2001 and 2003, but covering the deployment times of the camera system. Reliable chlorophyll values from 2002 for the corresponding ParCa deployment sites are only 5
available for periods before or after the profiles were acquired. Because biomass pro-duction is highly variable in the area of investigation and can change within a few days, a chlorophyll image for this specific year was not known.
3 Results
3.1 Particle distribution patterns 10
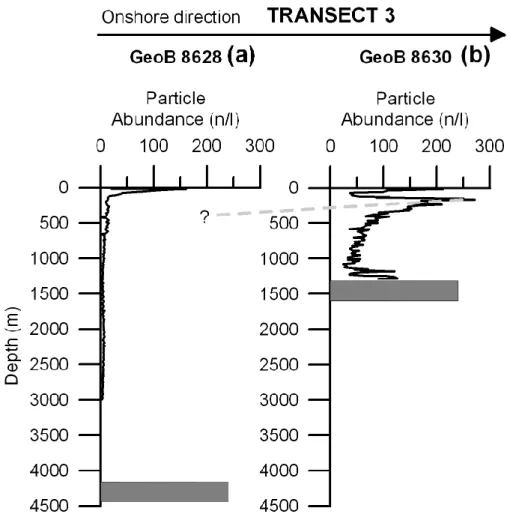
The camera profiles acquired during three years in the spring season, show very similar particle distribution patterns (Figs. 2, 3, 4). Regarding the particle abundances, three distinct concentration maxima can be identified.
The first particle maximum is located in the surface water, down to depths of approx-imately 100 m. Concentrations in this layer are highly variable. Apart from GeoB 8628, 15
all profiles are characterised by a second, subsurface maximum (Figs. 2, 3, 4; grey dashed line). This characteristic particle maximum is found in depths around 200 m at the coastal near sites (e.g. GeoB 7411, GeoB 8630) and around 400 m at site GeoB 7404, further offshore. Below the subsurface maximum, particle abundances decrease in the water column (e.g. GeoB 7408, GeoB 8630) or remain constant (e.g. GeoB 8628; 20
GeoB 7920). A third particle maximum is located above the ocean bottom. No bottom maximum is seen at stations GeoB 7404, GeoB 7927, GeoB 7938 and GeoB 8628. At these specific sites, the camera was not lowered down to the seafloor.
The only site without such typical distribution pattern is site GeoB 7415 (Fig. 2d). Below the surface maximum, particle concentrations remain more or less constant 25
OSD
3, 903–938, 2006 Distribution and transport processes of marine particles N. Nowald et al. Title Page Abstract Introduction Conclusions References Tables Figures J I J I Back CloseFull Screen / Esc
Printer-friendly Version Interactive Discussion
EGU
Below 800 m, the particle concentration decreases constantly to the seafloor. 3.1.1 Particle abundances
While the particle distribution patterns all look very similar, particle concentration is highly variable on temporal as well as on spatial scales.
Particle abundances measured in the surface maximum were highest along Transect 5
3 in 2003 (Figs. 4a–b), reaching 105 part l−1 in 10 m and more than 200 part l−1 in 20 m depth at site GeoB 8630. Along Transect 1 (Figs. 2a–d) particle abundances ranged between 22 part l−1 (GeoB 7404) and 78 part l−1 (GeoB 7411). Very low concentrations were measured along Transect 2 (Figs. 3a–c), aqcuired in spring 2002. Particle abundances obtained during this campaign ranged between 17 part l−1(GeoB 10
7920) and 30 part l−1(GeoB 7927).
Temporal variabilities in the surface waters are clearly observed during all three years in the investigation area. A good example for the interannual variability of particulate matter in this region are sites GeoB 7411 (Transect 1), GeoB 7920 (Transect 2) and GeoB 8630 (Transect 3). Although all three sites are not more than 60 km apart, particle 15
concentration in the ocean surface differ significantly. Site GeoB 7411 (2001) and GeoB 8630 (2003) show highest measured particle concentrations of 105 part l−1 in 21 m water depth and 78 part l−1in 10 m depth, respectively. At the adjoining site GeoB 7920, only 17 part l−1were measured during the field campaign in 2002, which is less than one fifth of the values observed in 2001 and 2003.
20
The same can be accounted for particle abundances aqcuired in the subsurface maximum. Lowest concentrations (6 part l−1) in this particular layer were for instance measured at station GeoB 7920 (Transect 2) while more than 250 part l−1 where ob-served at site GeoB 8630 along Transect 3. It may be noted, that the particle concen-trations in the subsurface maximum, can exceed those found in the productive ocean 25
surface. At sites GeoB 7408, GeoB 7411 and GeoB 8630, the abundance of partic-ulate matter in the subsurface maximum is twice as high as compared to the surface concentrations.
OSD
3, 903–938, 2006 Distribution and transport processes of marine particles N. Nowald et al. Title Page Abstract Introduction Conclusions References Tables Figures J I J I Back CloseFull Screen / Esc
Printer-friendly Version Interactive Discussion
EGU
Spatial varibalities regarding the concentration in the surface waters, are clearly vis-ible along transects, obtained in east-west direction. For instance, particle concentra-tions at the coastal near staconcentra-tions GeoB 7411 (Transect 1) and GeoB 8630 (Transect 3) are around 78 part l−1 and 105 part l−1, respectively. The corresponding distal sta-tions GeoB 7404 and GeoB 8628, reach particle concentrasta-tions of 22 part l−1 and 20 5
part l−1, respectively. In contrast, profiles acquired alongshore (Transect 2) show very similar concentrations between 17 and 30 part l−1in the surface water.
The particle distribution pattern of site GeoB 7415 (Transect 1) is completely di ffer-ent compared to all other profiles and concffer-entrations remain more or less constant between 100 m and 600 m (∼10 part l−1). A particle maximum is observed in the mid-10
water column between 600 m and 800 m water depth, where particle abundances reach concentrations of more than 50 part l−1. This is almost twice as much as the particle concentration measured in the surface water (30 part l−1). Below the midwater particle maximum, particle abundances decrease constantly down to the seafloor as observed for some other camera profiles (e.g. GeoB 7411, GeoB 8630).
15
4 Size distribution
The description of the in-situ size distribution will focus on camera profiles GeoB 7411 (Fig. 6) and GeoB 7415 (Fig. 7). Apart from site GeoB 7415, all other stations show very similar size distribution patterns as described for site GeoB 7411 in this section. While profile GeoB 7415 is very different with respect to its particle abundance pattern 20
and size distribution, it will be discussed seperately.
GeoB 7411
Particles up to a size of 500 µm provide the majority of the size spectra. These small particles (size class 1–6) are distributed in high frequencies throughout the wa-ter column (Fig. 6). Highest frequencies of this size fraction are found in the upper 25
OSD
3, 903–938, 2006 Distribution and transport processes of marine particles N. Nowald et al. Title Page Abstract Introduction Conclusions References Tables Figures J I J I Back CloseFull Screen / Esc
Printer-friendly Version Interactive Discussion
EGU
part of the water column, between 75 m and 150 m depth. Medium sized particles (500 µm–1000 µm) appear to be distributed more evenly in the GeoB 7411 profile. Visible changes in the size distribution are only observed for the large particle sizes (>1000 µm). The frequency of particles larger than 1000 µm appear to increase slightly with increasing depth. However, changes in the particle abundances are obviously not 5
connected with significant changes in the particle size distribution.
GeoB 7415
At site GeoB 7415, changes in the particle abundance are correlated with changes in the particle size spectra. The concentration profile of this site can be divided into three sections (Fig. 7). Down to a depth of 250 m, small particles (< 270 µm) are found in high 10
frequencies, while particles >1000 µm are not found in this layer. An abrupt change in the size distribution is clearly visible below 250 m. Between 250 m and the bottom of the particle maximum around 800 m, larger particles >800 µm in diameter (> size class 14) are found in increased frequencies. In contrast, smaller particles, especially the fraction <270 µm (< size class 3), is depleted in these depths. Within the midwater 15
particle maximum, located between 600 m and 800 m depth, highest frequencies of particles larger than 1000 µm are observed. Another visible change in the size spectra occurs below 800 m. Small particles (<270 µm) are measured in higher frequencies, while particles larger than 800 µm are seldom observed in the lower half of the water column.
20
4.1 Density
CTD density data are only available for profiles GeoB 7927, GeoB 7938 and GeoB 8630 (Figs. 5a–c). Distinct changes in the density structure are in the first instance observed in the upper water column, down to approximately 100 m water depth. Below 100 m, density increases constantly with increasing water depth. An increase in the 25
OSD
3, 903–938, 2006 Distribution and transport processes of marine particles N. Nowald et al. Title Page Abstract Introduction Conclusions References Tables Figures J I J I Back CloseFull Screen / Esc
Printer-friendly Version Interactive Discussion
EGU
GeoB 7938 in 30 m depth. However, a connection between density and the observed subsurface particle maxima is apparently not the case. A significant change in the density structure with the corresponding depths of the subsurface peaks is not visible.
4.2 Chlorophyll distribution and particle abundances
During April 2001 (Fig. 8a), very high chlorophyll concentrations of more than 4 mg m−3 5
are predominantly found in the coastal region. Further offshore, chlorophyll concentra-tions decrease and are considerably lower (1 mg m−3 and lower). However, there are patches of increased biomass concentrations off the coastal areas that may have de-tached from the shelf. ParCa stations GeoB 7408 and GeoB 7411 are located within such a patch of increased biomass with values around 3 mg m−3. At site GeoB 7411 for 10
instance, particle abundance at 20 m water depth is 78 part l−1and the corresponding chlorophyll value is 3.31 mg m−3. Compared to site GeoB 7404, located far offshore in an area of much lower biomass concentration (0.89 mg m−3), the particle concentration is only 22 part l−1.
During late May 2003 (Fig. 8b), areas of very high biomass concentrations extended 15
far offshore. Biomass concentration at the coastal near site GeoB 8630 is 2.98 mg m−3 and the corresponding particle concentration in 10 m depth is 105 part l−1. Chlorophyll concentration at the distal site GeoB 8628 is only 0.31 mg m−3 with a comparatively low particle abundance of 20 part l−1.
It appears that there is a qualitative connection between the biomass concentration 20
and the particle abundance in the surface water. Areas of high chlorophyll values are characterised by higher particle concentrations in the surface water while low particle abundances are measured in areas of low biomass productivity.
OSD
3, 903–938, 2006 Distribution and transport processes of marine particles N. Nowald et al. Title Page Abstract Introduction Conclusions References Tables Figures J I J I Back CloseFull Screen / Esc
Printer-friendly Version Interactive Discussion
EGU
5 Discussion
Based on our observations, we distinguish between two situations. The first will be referred to as “Standard situation” while the second situation likely reflects a “sinking event”, where particulate matter is transferred rapidly to the seafloor.
5.1 Situation 1 – “Standard situation” 5
We observed strong temporal variabilities regarding the particle concentrations in the surrface water between the three spring seasons. ParCa stations GeoB 7411 (Transect 1, April 2001), GeoB 7920 (Transect 2, May 2002) and GeoB 8630 (Transect 3, May 2003) are all located approximately 60 km apart. While the spatial distances between these sites are rather small, particle abundances can differ by a factor >5 between 10
years. These variations may be explained by interannual changes in the biomass pro-duction in the ocean surface. Increased biomass propro-duction is generally found within the giant filament structures, present throughout the year, while the water surround-ing the filaments is characterised by far lower pigment concentrations (Van Camp et al., 1991). Pigment concentrations off Cape Blanc vary significantly on interannual 15
scales (Davenport, personal communication). This is also observed in the SeaWiFS images from early April 2001 and late May 2003 (Figs. 8a–b). The distribution pattern of satellite derived chlorophyll-a concentration is completely different during the obser-vation period from 2003 compared to 2001 and is probably responsible for the different particle abundances acquired in the same area.
20
Apart from interannual variabilities in the particle concentration between the three campaigns, spatial differences are clearly visible. We observed a decreasing trend in the particle concentrations with increasing distance from the coast. For instance, the coastal near sites GeoB 7411 or GeoB 8630 are characterised by far higher concen-trations in the entire water column, compared to the distal sites GeoB 7404 and GeoB 25
8628, respectively. This observation can be explained by the far lower biomass further offshore, compared to the coastal near areas (Figs. 8a–b). Thus we think, that particle
OSD
3, 903–938, 2006 Distribution and transport processes of marine particles N. Nowald et al. Title Page Abstract Introduction Conclusions References Tables Figures J I J I Back CloseFull Screen / Esc
Printer-friendly Version Interactive Discussion
EGU
concentration in the surface contains a biological signature and that it is closely linked to the biomass concentration.
Although concentrations vary on temporal and spatial scales, the particle distribution patterns look very similar. We argue, that the profiles presented here, represent a typ-ical distribution pattern of particles in the water column during the observation periods 5
off Cape Blanc. Due to logistical reasons, camera profiles from other seasons are not available for comparison purposes. All profiles show a subsurface particle maximum below the euphotic zone. This characteristic maximum is found around 200 m depth at station close to the coast (e.g. GeoB 7411, GeoB 7927, GeoB 8630) and 400 m depth further offshore (GeoB 7404). Several mechanisms may be responsible for the 10
observed subsurface particle maximum layer. Particulate matter is reported to accumu-late even at modest density gradients (Condie, 1999; Gorsky et al., 1992; MacIntyre et al., 1995). However, a clear relationship between the density structure and the subsur-face particle maxima is not seen in any of the profiles and it appears, as if the density has no influence on the particle distribution in this specific layer.
15
A numerical experiment described in the companion paper Karakas et al. (2006) clearly showed, that biological detritus produced in the ocean surface is not able to produce a subsurface maximum as observed in the optical measurements. The model computed a clear signal in the euphotic zone, but the amount of biodetritus decreases rapidly beyond depths of 150 m. Thus, biodetritus alone cannot be responsible for 20
generating a particle maximum beyond the euphotic zone. More likely is that at least a portion of the material found in the subsurface particle maximum, originates from the shelf areas and is laterally advected by filament activity. This hypothesis was likewise tested with aid of model computations (Karakas et al., 2006). In the high resolution 3-D hydrostatic model simulation, material with a sinking velocity of 5 m day−1 was 25
released, taking into account the mean climatological conditions off Cape Blanc. The source of the material is located on the shelf break, at approximately 135 m depth. The signal of the advected material coincides with the subsurface maximum layers, seen in the camera profiles. Hence, the model provides good evidence that at least
OSD
3, 903–938, 2006 Distribution and transport processes of marine particles N. Nowald et al. Title Page Abstract Introduction Conclusions References Tables Figures J I J I Back CloseFull Screen / Esc
Printer-friendly Version Interactive Discussion
EGU
some of the material in the subsurface maximum acquired by the camera, is of shelf origin. While the subsurface maximum is located around 200 m depth at sites close to the coast (e.g. GeoB 7411; GeoB 8630), it is situated around 400 m at site GeoB 7404 further offshore. This may be explained by the slow, but continuous sinking of the material, while advected offshore. The lateral advection of particulate matter from 5
the shelf areas towards the open ocean has been described in several publications (e.g. Freudenthal et al., 2001; Neuer et al., 1997). Our results show, that particles produced along the shelf areas are advected several hundred kilometers offshore in a subsurface maximum layer system, beyond the euphotic zone. The subsurface layer might be the place of mixing processes of older, laterally advected material from the 10
shelf areas, with relatively fresh material derived from the ocean surface. This may be an important mechanism regarding the re-distribution and quality of particulate matter off Cape Blanc.
A third particle maximum was generally found close to the seafloor. Higher particle loads above the seafloor are seen in all camera profiles, where images were acquired 15
down to the ocean bottom (GeoB 7408, GeoB 7411, GeoB 7920, GeoB 8630). Current activity along the ocean bottom is reported to transport resuspended material over long distances (Thomsen, 2003). Such a downslope transport of particulate matter from the shelf towards the open ocean was suggested by F ¨utterer (1983) for the Cape Blanc region. The sediments from the shelfs are free of the fine sediment fraction and same 20
author suggests downslope transport by a nepheloid layer system or grain-by-grain. Model computations were able to reproduce increased particle concentrations close to the seafloor, indicating an apparent offshore vectored downslope transport of material (Karakas et al., 2006).
However, there is a problem in the combination of in-situ particle measurements and 25
model results. We argued, that a portion of the material in the subsurface maximum is originating from the shelf areas and laterally advected offshore by filament activity. The model applies particle specific sinking velocities of 5 m day−1. Particle sizes cannot be incorporated into the computation. On the other hand, the camera acquires particles
OSD
3, 903–938, 2006 Distribution and transport processes of marine particles N. Nowald et al. Title Page Abstract Introduction Conclusions References Tables Figures J I J I Back CloseFull Screen / Esc
Printer-friendly Version Interactive Discussion
EGU
sizes above 180 µm but sinking velocities cannot be determined directly. Thus, it is difficult to determine whether the particles accounted in the model run represent the same particle populations as aqcuired by the camera and whether the model study is a realistic approach. It is a major problem, that the processes controlling the settling behaviour of particles in the ocean are not sufficiently understood. Sinking speeds 5
published in the literature range between 1 m d−1 to almost 3000 m d−1 (Asper, 1987; Lampitt, 1985; Shanks and Trent, 1980; Silver and Alldredge, 1981). Most of these sinking speeds were estimated with aid of sediment traps while in-situ measurements are rare. In-situ measurements of sinking velocities using SCUBA techniques (All-dredge and Gotschalk, 1988) or settling chambers (Shanks and Trent, 1980) yielded 10
sinking rates of 79±39 m d−1and 50 m d−1respectively, for particles betwenn 2 mm and 5 mm in size. These speeds are far higher than the value used in the numerical exper-iment but they apply to a particle size range, which is rarely acquired by the camera system (mostly beyond 3% of the total size spectra). Pilskaln et al. (1998) reported in-situ settling velocities of 10 m d−1to 30 m d−1for particles between 0.5 mm and <3 mm 15
in 200 m depth at Monterey Bay/California. Similar sinking speeds for particle sizes ranging between 1 mm to 4 mm of 26 m d−1to 36 m d−1, respectively were published by Asper (1987). These sinking rates are closer to our estimated sinking speed of 5 m d−1, but likewise applicable to rather large particles. The majority of particles however, ac-quired by the camera system is smaller than 0.5 mm, which may sink at smaller rates 20
than large particles. In this case, the model study combined with in-situ measurements appears to be an realistic approach, although there are still uncertainties related to insufficient understanding of the particle dynamics in the ocean.
5.2 Situation 2: sinking event
Site GeoB 7415 differs distinctively from the general distribution pattern described in 25
this study. The particle and size distribution of site GeoB 7415 (Fig. 7) may indicate a sinking event, where material is transferred on a short temporal scale from the ocean surface to the seafloor.
OSD
3, 903–938, 2006 Distribution and transport processes of marine particles N. Nowald et al. Title Page Abstract Introduction Conclusions References Tables Figures J I J I Back CloseFull Screen / Esc
Printer-friendly Version Interactive Discussion
EGU
We assume, that site GeoB 7415 initially possessed the typical particle distribution pattern as described for the profiles presented above. The material from the ocean sur-face starts to sink at higher rates than the particulate matter in the remaining column. While sinking through the water column, smaller particles are preferably scavanged, because they are more abundant. This results in a depletion of these small particles 5
above and within the sinking cloud. This depletion (particles <500 µm) is clearly visible in the size spectra. This in turn, results in a coarsening of the material seen above and within the midwater maximum, where larger particles prevail. These scavenging processes are known to be important for the growth and removal of particulate matter in the water column (Alldredge and Gotschalk, 1989; Stolzenbach, 1993). As seen 10
in the in-situ size spectra plot, small particles are available in high frequencies below the midwater particle maximum. We suggest that while the cloud progresses through the water column, particles of these size classes will be depleted in a similar way as observed in the water column above the midwater maximum.
Pulsed-like sedimentation events were observed by sediment trap records with high 15
contents of trapped material in one sample interval, for instance in the Bransfield Strait (Berger and Wefer, 1990) or in the North Atlantic Ocean (Lampitt, 1985). A sedimen-tation pulse of pteropod shells was reported Fischer et al. (1996a) in the Cape Blanc region. Such events may be triggered by episodic phytoplankton blooms. Although they occur on small spatial and temporal scales, their intensity is reported to play an 20
important role for the export production (Deuser et al., 1988). M ¨uller and Fischer (2001) reported average sinking rates between 63 m d−1 and 88 m d−1 off Cape Blanc which can occasionally reach 280 m d−1. These very high sinking speeds appear to be con-nected to an export of coccolithophorids after a bloom. Fischer et al. (1996b) estimated time scales for sedimentation events from several days to a few hours for the Canary 25
Island region. Another trigger mechanisms might be the input of wind transported dust from the African continent. Outbreaks of sandstorms over the African continent are strongly coupled with the input of high-density lithogenic material into the Atlantic Ocean (Sch ¨utz et al., 1981; Swap et al., 1996). The interaction of marine particulate
OSD
3, 903–938, 2006 Distribution and transport processes of marine particles N. Nowald et al. Title Page Abstract Introduction Conclusions References Tables Figures J I J I Back CloseFull Screen / Esc
Printer-friendly Version Interactive Discussion
EGU
matter with episodically imported dust from the Sahara leads a “ballasting” or “particle loading” (Ramaswamy et al., 1991; Stolzenbach, 1993). Terrigenous grains collide with phytodetritus in the water column, resulting in the forming of high-density aggregates in the surface waters, leading to higher sinking rates. Obviously, increased lithogenic fluxes are coupled to the prevailing atmospheric conditions off Cape Blanc. Ratmeyer 5
et al. (1999a) observed highest lithogenic and Al fluxes during winter and spring, con-current with highest atmospheric dust loads in the lower troposphere. On the other hand Passow (2004) argued, that mineral grains may be too small to sink at significant speeds which leads to an excess of lithogenic material below the mixed layer. POC-rich marine snow aggregates passing this layer, may scavange the lithogenic particles 10
to a maximum loading capacity, transferring them rapidly to the seafloor.
6 Summary
In this study, 9 vertical camera profiles acquired in the upwelling system off Cape Blanc/NW-Africa were presented. The camera profiles were obtained during three campaigns in the spring of 2001, 2002 and 2003.
15
Particle concentrations in the ocean surface underlie interannual and spatial variabil-ities and were related to variabilvariabil-ities in the biomass concentration. A qualitative com-parison of particle abundances in the ocean surface and satellite derived chlorophyll-a concentration revealed, that the amount of particulate matter in the surface water is linked to the biomass concentration and thus carried a biological signature. All profiles 20
were characterised by a subsurface maximum, located around 200 m depth at sites close to the coast and 400 m depth at camera stations further offshore. With the aid of a numerical experiment, as described in a companion paper, it was shown that biodetri-tus is unable to produce such a subsurface maximum, as observed in the optical mea-surements. At least a portion of the material found in this maximum layer originates 25
from the shelf areas, laterally advected offshore by filament activity. This hypothesis was likewise tested with the aid of model computations. Most profiles are characterised
OSD
3, 903–938, 2006 Distribution and transport processes of marine particles N. Nowald et al. Title Page Abstract Introduction Conclusions References Tables Figures J I J I Back CloseFull Screen / Esc
Printer-friendly Version Interactive Discussion
EGU
by an increased particle load above the seafloor, suggesting a downslope transport of particulate matter from the shelf areas to deeper parts of the continental slope. A special sedimentation event was observed during a campaign in 2001. A rapid sink-ing particle cloud preferably scavenged the more abundant smaller and slower sinksink-ing particles. This resulted in a depletion of small particles above and a coarsening of the 5
material within the particle cloud. However, the trigger mechanism behind such events could not be clarified on the basis of our datasets.
7 Conclusions
This study shows, how in-situ observations can be combined with model computa-tions. With aid of the model simulations, mechanisms discussed to be responsible for 10
the generation of specific particle distribution patterns, could be tested. Most of the discussion regarding the transportation pathways (e.g. offshore advected transport) would be difficult to justify without the model results and are not possible solely on the basis of vertical particle profiles. Camera profiles acquire the actual particle distribution at a specific time and place and sampling is of a punctiform nature. Thus, computer 15
models are helpful for interpreting and understanding large scale patterns of particle transport and distribution, but rely on in-situ measurements for verification purposes. What complicates the approach between in-situ measurements and the numerical ex-periments is the lack of knowledge whether there is a relationsship between size and sinking rate. New technologies, such as remotely operated vehicles, may be able to 20
trace sinking particles in-situ and sample them below depths divers can acces to gain more information about their individual properties.
Acknowledgements. We thank the crews of the RV METEOR and RV POSEIDON for their help
in deploying and recovering the camera system. The manuscript greatly benefited from discus-sions with T. Freudenthal and we thank B. Davenport for processing the SeaWiFS satellite
im-25
ages. Many helpful comments from the reviewers helped to improve this manuscript. The pre-sented datasets are available in the PANGAEA database (http://www.pangaea.de/). The
Sea-OSD
3, 903–938, 2006 Distribution and transport processes of marine particles N. Nowald et al. Title Page Abstract Introduction Conclusions References Tables Figures J I J I Back CloseFull Screen / Esc
Printer-friendly Version Interactive Discussion
EGU
WiFS data were supplied by the SeaWiFS Project and the Distributed Active Archive Center, Goddard Space Flight Center, Greenbelt, MD, USA. This study was funded by the “Deutsche Forschungsgesellschaft” (DFG) within the scope of the DFG Research Center Ocean Margins.
References
Alldredge, A. L. and Gotschalk, C.: In situ settling behaviour of marine snow, Limnology
5
Oceanogr., 33, 339–351, 1988.
Alldredge, A. L. and Gottschalk, C.: Direct observation of the mass flocculation of diatom blooms: characteristics, settling velocities and formation of diatom aggregates, Deep Sea Res. I, 36, 159–171, 1989.
Armstrong, R. A., Lee, C., Hedges, J. I., Honjo, S., and Wakeham, S. G.: A new, mechanistic
10
model for organic carbon fluxes in the ocean based on the quantitative association of POC with ballast minerals, Deep Sea Res. II, 49, 219–236, 2002.
Antoine, D., Andr ´e, J.-M., and Morel, A.: Oceanic primary production 2. Estimation at global scale from satellite (coastal zone color scanner) chlorophyll, Global Biogeochem. Cycles, 10, 57–69, 1996.
15
Asper, V. L., Measuring the flux and sinking speed of marine snow aggregates, Deep Sea Res. I, 34, 1–17, 1987.
Asper, V. L., Honjo, S., and Orsi, T. H.: Distribution and transport of marine snow aggregates in the Panama Basin, Deep Sea Res. I, 39, 939–952, 1992.
Barton, E. D.: Eastern Boundary of the North Atlantic: Northwest Africa and Iberia, in: The
20
Global Coastal Ocean, edited by: Robinson, A. R. and Brink, K., Volume 11: The Sea: New York, Chichester, Weinheim, Brisbane, Singapore, Toronto, John Wiley & Sons, 29–67, 1998. Behrenfeld, M. J. and Falkowski, P. G.: Photosynthetic rates derived from satellite-based
chloro-phyll concentration, Limnology Oceanogr., 42, 1–20, 1997.
Berelson, W. M.: Particle settling rates increase with depth in the ocean: Deep Sea Res. II, 49,
25
237–251, 2002.
Berger, W. and Wefer, G.: Export production: seasonality and intermittancy and paleoceano-graphic implications: Palaeogeography, Palaeoclimatology, Palaeoecology, 89, 245–254, 1990.
Bory, A. and Newton, P. P.: Transport of airborne lithogenic material down through the water
OSD
3, 903–938, 2006 Distribution and transport processes of marine particles N. Nowald et al. Title Page Abstract Introduction Conclusions References Tables Figures J I J I Back CloseFull Screen / Esc
Printer-friendly Version Interactive Discussion
EGU
column in two contrasting regions of the eastern subtropical North Atlantic Ocean, Global Biogeochem. Cycles, 14, 2067–2076, 2000.
Bory, A., Jeandel, C., Leblonc, N., Vangriesheim, A., Khripounoff, A., Beaufort, L., Rabouille, C., Nicolas, E., Tachikawa, K., Etcheber, H., and Buat-Menard, P.: Downward particle fluxes within different productivity regimes off the Mauritanian upwelling zone (EUMELI program),
5
Deep Sea Res. I, 48, 2251–2282, 2001.
Bory, A., Dulac, F., Moulin, C., Chiapello, I., Newton, P. P., Guelle, W., Lambert, C. E., Berga-metti, G.: Atmospheric and oceanic dust fluxes in the northeastern tropical Atlantic ocean: how close a coupling?, Ann. Geophys., 20, 2067–2076, 2002.
Burdick, H. E.: Digital Imaging Theory and Applications: New York, San Francisco, Washington,
10
D.C., Auckland, Bogota, McGraw Hill, 313, 75–94, 1997.
Carr, M.-E.: Estimation of potential productivity in Eastern Boundary Currents using remote sensing, Deep-Sea Res. I, 49, 59–80, 2002.
Chen, C.-T. A., Liu, K. K., and MacDonald, R.: Continental margin exchanges, in: Ocean Biogeochemistry: The role of the Ocean Carbon Cycle in Global Change, edited by: Fasham,
15
M. J. R., Int. Geosphere-Biosphere Programme Book, Springer, Berlin, Heidelberg, New York, 53–97, 2003
Condie, S. A.: Settling regimes for non-motile particles in stratified waters, Deep Sea Res. I, 46, 681–699, 1999.
deMenocal, P., Ortiz, J., Giulderson, T., Adkins, J., Sarnthein, M., Baker, L., and Yarusinski,
20
M.: Abrupt onset and termination of the African Humid Period: rapid climate responses to gradual insolation forcing, Quat. Sci. Rev., 19, 347–361, 2000.
Deuser, W. G., Mueller-Karger, F. E., and Hemleben, C.: Temporal variations of particle fluxes in the deep subtropical and tropical North Atlantic: Eulerian and Langrangian effects, J. Geophys. Res., 93, 6857–6862, 1988.
25
Diercks, A. R. and Asper, V. L.: In situ settling speeds of marine snow aggregates below the mixed layer: Black Sea and Gulf of Mexico, Deep Sea Res. I, 44, 385–398, 1997.
Fischer, G., Donner, B., Ratmeyer, V., Davenport, R., and Wefer, G.: Distinct yeat-to-year particle flux variations off Cape Blanc during 1988–1991: Relation to d18O deduced sea-surface temperatures and trade winds, J. Mar. Res., 54, 73–98, 1996a.
30
Fischer, G., Neuer, S., and Wefer, G.: Short-term sedimentation pulses recorded with a fluores-cence sensor and sediment traps at 900-m depth in the Canary basin, Limnology Oceanogr., 41, 1354–1359, 1996b.
OSD
3, 903–938, 2006 Distribution and transport processes of marine particles N. Nowald et al. Title Page Abstract Introduction Conclusions References Tables Figures J I J I Back CloseFull Screen / Esc
Printer-friendly Version Interactive Discussion
EGU
Fischer, G., Neuer, S., Davenport, R., Helmke, P., Schlitzer, R., Romero, O. E., Ratmeyer, V., Donner, B., Freudenthal, T., Meggers, H., and Wefer, G.: Control of carbonate and dust on organic carbon export in the Eastern Boundary Current system (EBCs) off NW Africa, edited by: Liu, K. K., Atkinson, L., Quinones, R., et al., in press, 2006.
Fowler, S. W. and Knauer, G. A.: Role of large particles in the transport of elements and organic
5
compounds through the oceanic water column, Progress Oceanogr., 16, 147–194, 1986. Francois, R., Honjo, S., Krishfield, R., and Manganini, S.: Factors controlling the flux of organic
carbon in the bathy-pelagic ocean, Global Biogeochem. Cycles, 16, 1087, 2002.
Freudenthal, T., Neuer, S., Meggers, H., Davenport, R., and Wefer, G.: Influence of lateral parti-cle advection and organic matter degradation on sediment accumulation and stable nitrogen
10
isotope ratios along a productivity gradient in the Canary Islands region, Mar. Geol., 177, 93–109, 2001.
F ¨utterer, D.: The modern upwelling record off northwest Africa, in: Coastal Upwelling, its Sedi-ment Record, Part B: SediSedi-mentary Records of Ancient Coastal Upwelling, edited by: Thiede, J. and Suess, E., New York, Plenum Press, 1983.
15
Gabric, A. J., Garcia, C. M., Van Camp, L., Nykjaer, L., Eifler, W., and Schrimpf, W.: Offshore export of shelf production in the Cape Blanc (Mauritania) giant filaments as derived from Coastal Zone Color Scanner Imagery, J. Geophys. Res., 98, 4697–4712, 1993.
Gabric, A. J., Schrimpf, W., and Eifler, W.: A Langrangian model of phytoplankton dynamics in the Mauritanian coastal upwelling zone: Adv. Space Res., 18, 99–115, 1996.
20
Gardner, W. D. and Walsh, I. D.: Distribution of macroaggregates and fine-grained particles across a continental margin and their potential role in fluxes, Deep Sea Res. I, 37, 401–411, 1990.
Gorsky, G., Aldorf, C., Kage, M., Picheral, M., Garcia, Y., and Favole, J.: Vertical distribution of suspended aggregates determined by a new underwater video profiler, Annales de l’Institut
25
oc ´eanographique, 68, 275–280, 1992.
Gorsky, G., Picheral, M., and Stemman, L.: Use of the Underwater Video Profiler for the Study of Aggregate Dybamics in the North Mediterranean Estuarine, Coastal Shelf Sci., 50, 121– 128, 2000.
Hagen, E.: Northwest African upwelling scenario, Oceanologica Acta, 24, 113–128, 2001.
30
Hernandez-Guerra, A. and Nykjaer, L., Sea surface temperature variability off north-west Africa: 1981-1989: International Journal of Remote Sensing, v. 18, p. 2539-2558, 1997
OSD
3, 903–938, 2006 Distribution and transport processes of marine particles N. Nowald et al. Title Page Abstract Introduction Conclusions References Tables Figures J I J I Back CloseFull Screen / Esc
Printer-friendly Version Interactive Discussion
EGU
amorphous aggregates (marine snow) in the deep ocean, Dep Sea Res. I, 31, 67–76, 1984. Karakas, G., Nowald, N., Blaas, M., Marchesiello, P., Frickenhaus, S., and Schlitzer, R.: High resolution modelling of sediment erosion and particle transport across the NW African Shelf, J. Geophys. Res., 111, C06025, doi:10.1029/2005JC003296, 2006.
Klaas, C. and Archer, D. E.: Association of sinking organic matter with various types of mineral
5
ballast in the deep sea: Implications for the rain ratio, Global Biogeochem. Cycles, 16, 1–13, 2002.
Lampitt, R. S.: Evidence for the seasonal deposition of detritus to the deep-sea floor and its subsequent resuspension, Deep Sea Res. I, 32, 885–897, 1985.
Lampitt, R. S., Wishner, K. F., Turley, C. M., and Angel, M. V.: Marine snow studies in the
10
Northeast Atlantic Ocean: distribution, composition and role as a food source for migrating plankton, Mar. Biol., 116(4), 689–702, 1993.
Longhurst, A. R., Sathyendranath, S., Platt, T., and Caverhill, C.: An estimate of global primary production in the ocean from satellite radiometer data, J. Plankton Res., 17, 1245–1271, 1995.
15
MacIntyre, S., Alldredge, A. L., and Gotschalk, C.: Accumulation of marine snow at density discontinuities in the water column, Limnology Oceanogr., 40, 449–468, 1995.
Martin, J. H., Knauer, G. A., Karl, D. M., and Broenkow, W. W.: VERTEX: carbon cycling in the northeast Pacific, Deep Sea Res., 34, 267–285, 1987.
McCave, I. N.: Vertical flux of particles in the ocean, Deep Sea Res. I, 22, 491–502, 1975.
20
Mittelstaedt, E.: The ocean boundary along the northwest African coast: Circulation and oceanographic properties at the sea surface, Progess Oceanogr., 26, 307–355, 1991. Moulin, C., Lambert, C. E., Dulac, F., and Dayan, U.: Control of atmospheric export of dust from
North Africa by the North Atlantic Oscillation, Nature 387, 691–694, 1997.
M ¨uller, P. J. and Fischer, G.: A 4-year sediment trap record of alkenones from the filamentous
25
upwelling region off Cape Blanc, NW Africa and a comparison with distributions in underlying sediments, Deep Sea Res. I, 48, 1877–1903, 2001.
Neuer, S., Ratmeyer, V., Davenport, R., Fischer, G., and Wefer, G.: Deep water particle flux in the Canary Island region: seasonal trends in relation to long-term satellite derived pigment data and lateral sources, Deep-Sea Res. I, 44, 1451–1466, 1997.
30
Nykjaer, L. and Van Camp, L.: Seasonal and interannual variability of coastal upwelling along northwest Africa and Portugal from 1981 to 1991, J. Geophys. Res., 99, 197–207, 1994. Parker, J. R.: Algorithms for Image Processing and Computer Vision: New York, Cichester,
OSD
3, 903–938, 2006 Distribution and transport processes of marine particles N. Nowald et al. Title Page Abstract Introduction Conclusions References Tables Figures J I J I Back CloseFull Screen / Esc
Printer-friendly Version Interactive Discussion
EGU
Brisbane, Toronto, Singapore, Weinheim, Wiley Computer Publishing, p.417, 1997
Passow, U.: Switching perspectives: Do mineral fluxes determine particulate organic carbon fluxes or vice versa: Geochemistry, Geophysics, Geosystems, 5(4), 1–5, doi:10.1029/2003GC000670, 2004.
Pilskaln, C. H., Lehmann, C., Paduan, J. B., and Silver, M. W.: Spatial and temporal dynamics in
5
marine aggregate abundance, sinking rate and flux, Monterey Bay, central California, Deep Sea Res. II, 45, 1803–1837, 1998.
Prospero, J. M.: The atmospheric transport of particles to the ocean, in: Particle Flux in the Ocean., edited by: Ittekott, V.e.a., SCOPE: Chichester, Wiley and Sons, 19–52, 1996. Ramaswamy, V., Nair, R. R., Manganini, S., Haake, B., and Ittekott, V.: Lithogenic fluxes to the
10
deep Arabian Sea measured by sediment traps: Deep Sea Res. I, 38, 169–184, 1991. Ratmeyer, V. and Wefer, G.: A high resolution camera system (ParCa) for imaging particles in
the ocean: System design and results from profiles and a three-month deployment, J. Mar. Res., 54, 589–603, 1996.
Ratmeyer, V., Balzer, W., Bergametti, G., Chiapello, I., Fischer, G., and Wyputta, U.: Seasonal
15
impact of mineral dust on deep-ocean particle flux in the eastern subtropical Atlantic Ocean, Mar. Geol., 159, 241–252, 1999a.
Ratmeyer, V., Fischer, G., and Wefer, G.: Lithogenic particle fluxes and grain size distributions in the deep ocean off northwest Africa, Implications for seasonal changes of aeolian dust input and downward transport, Deep Sea Res. I, 46, 1289–1337, 1999b.
20
Romero, O. E., Lange, C. B., and Wefer, G.: Interannual variability (1988-1991) of siliceous phytoplankton fluxes off northwest Africa, J. Plankton Res., 24, 1035–1046, 2002.
Roy, C. and Reason, C.: ENSO related modulation of coastal upwelling in the eastern Atlantic, Progress Oceanogr., 49, 245–255, 2001.
Schlitzer, R.: Applying the adjoint method for biogeochemical modeling: Export of particulate
25
organic matter in the World Ocean, AGU Monograph, 114, 107–124, 2000.
Sch ¨utz, L., Jaenicke, R., and Pietrek, H.: Saharan dust transport over the North Atlantic Ocean, Geol. Soc. Am. Spec. Pap., 186, 87–100, 1981.
Sch ¨utz, L. W., Prospero, J. M., Buat-Menard, P., Carvalho, R. A. C., Cruzado, A., Harriss, R., Heidam, N. Z., and Jaenicke, R.: The long-range transport of mineral aerosols: group report,
30
in: The long-range atmospheric transport of natural and contaminant substances, edited by: Knap, A. H., Mathematical and Physical Sciences, Kluwer Academic Publshers, Dodrecht, 197–229, 1990.
OSD
3, 903–938, 2006 Distribution and transport processes of marine particles N. Nowald et al. Title Page Abstract Introduction Conclusions References Tables Figures J I J I Back CloseFull Screen / Esc
Printer-friendly Version Interactive Discussion
EGU
Shanks, A. L. and Trent, J. D.: Marine snow: sinking rates and potential role in vertical flux, Deep Sea Res. I, 27A, 137–143, 1980.
Silver, M. W. and Alldredge, A. L.: Bathypelagic marine snow, Deep-sea algal and detrital community, J. Mar. Res., 39, 501–530, 1981.
Stemmann, L., Picheral, M., and Gorsky, G.: Diel variation in the vertical distribution of
par-5
ticulate matter (>0.15 mm) in the NW Mediterranean Sea investigated with the Underwater Video Profiler, Deep Sea Res., 47, 505–531, 2000.
Stemmann, L., Gorsky, G., Marty, J.-C., Picheral, M., and Miquel, J.-C.: Four-year study of large-particle vertical distribution (0–1000 ) in the NW Mediterranean in relation to hydrology, phytoplankton, and vertical flux, Deep Sea Res. II, 49, 2143–2162, 2002.
10
Stolzenbach, K. D.: Scavenging of small particles by fast-sinking porous aggregates, Deep Sea Res. I, 40, 359–369, 1993.
Swap, R., Ulanski, S., Cobbett, M., and Garstang, M.: Temporal and spatial characteristics of Saharan dust outbreaks, J. Geophys. Res., 101, 4205–4220, 1996.
Thomsen, L.: The benthic boundary layer, in: Ocean Margin System, edited by: Wefer, G.,
15
Billet, D., Hebbeln, D., Jorgensen, B. B., Schl ¨uter, S., and van Weering, T. C. E., Berlin Heidelberg New York, Springer Verlag, 143–155, 2003.
Van Camp, L., Nykjær, L., Mittelstaedt, E., and Schlittenhardt, P.: Upwelling and boundary circulation off Northwest Africa as depicted by infrared and visible satellite observations, Prog. Oceanogr., 26, 357–402, 1991.
20
Walsh, I. D. and Gardner, W. D.: A comparison of aggregate profiles with sediment trap fluxes, Deep Sea Res. I, 39, 1817–1834, 1992.
Walsh, I. D., Chung, S. P., Richardson, M. J., and Gardner, W. D.: The diel cycle in the integrated particle load in the equatorial Pacific, A comparison with primary production, Deep Sea Res. II, 42, 465–477, 1995.
OSD
3, 903–938, 2006 Distribution and transport processes of marine particles N. Nowald et al. Title Page Abstract Introduction Conclusions References Tables Figures J I J I Back CloseFull Screen / Esc
Printer-friendly Version Interactive Discussion
EGU
Table 1. ParCa station list: positions and depths.
Position Depths (m)
Cruise Station Lat. Lon. Date Water Profile POS 272 GeoB 7404 20◦38.10N 21◦10.2 W 4 April 2001 4313 4170 April 2001 GeoB 7408 20◦17.10N 18◦14.80W 6 April 2001 1860 1820 GeoB 7411 20◦23.60N 18◦01.10W 6 April 2001 1213 1180 GeoB 7415 20◦48.60N 18◦15.70W 7 April 2001 1933 1930 M 53-1 GeoB 7920 20◦45.20N 18◦34.90W 24 April 2002 2280 2280 April/May 2002 GeoB 7927 19◦56.30N 19◦09.10W 27 April 2002 3118 726
GeoB 7938 18◦50.10N 18◦02.50W 1 May 2002 2606 2546 M 58-2b GeoB 8628 21◦16.80N 20◦46.70W 30 May 2003 4159 3000 May/June 2003 GeoB 8630 20◦49.00N 17◦58.20W 1 June 2003 1323 1300
OSD
3, 903–938, 2006 Distribution and transport processes of marine particles N. Nowald et al. Title Page Abstract Introduction Conclusions References Tables Figures J I J I Back CloseFull Screen / Esc
Printer-friendly Version Interactive Discussion
EGU
Table 2. Size classifications and ranges for particles.
Size Class 1 2 3 4 5 6 7 8 9 10 11 12 13 14 15 16 17 18 19 20 21 22 23 24 Range (µm) ≤185 245 269 296 324 356 391 429 471 517 623 684 751 825 905 994 1091 1198 1315 1443 1584 1739 1909 >2000
OSD
3, 903–938, 2006 Distribution and transport processes of marine particles N. Nowald et al. Title Page Abstract Introduction Conclusions References Tables Figures J I J I Back CloseFull Screen / Esc
Printer-friendly Version Interactive Discussion
EGU
Fig. 1. Map of camera stations acquired during RV Poseidon cruise POS 272 (2001), RV
Meteor cruise M 53-1 (2002) and RV Meteor cruise M 58-1 (2003). All profiles were obtained during spring in the highly dynamic upwelling system off Cape Blanc/Mauritania.
OSD
3, 903–938, 2006 Distribution and transport processes of marine particles N. Nowald et al. Title Page Abstract Introduction Conclusions References Tables Figures J I J I Back CloseFull Screen / Esc
Printer-friendly Version Interactive Discussion
EGU
Fig. 2. Vertical distribution of particulate matter off Cape Blanc. Although particle abundances
are variable throughout the years, the distribution patterns look very similar (except GeoB 7415). All profiles, apart from GeoB 8628, are characterised by a subsurface particle max-imum (grey dashed line) located between 200 m and 400 m depth. A bottom near particle maximum is seen at sites, where images were acquired down to the seafloor. Note, that there is a picture gap at profile GeoB 7408 (Fig. 2b) between 630 m and 1270 m (dashed line).
OSD
3, 903–938, 2006 Distribution and transport processes of marine particles N. Nowald et al. Title Page Abstract Introduction Conclusions References Tables Figures J I J I Back CloseFull Screen / Esc
Printer-friendly Version Interactive Discussion
EGU
OSD
3, 903–938, 2006 Distribution and transport processes of marine particles N. Nowald et al. Title Page Abstract Introduction Conclusions References Tables Figures J I J I Back CloseFull Screen / Esc
Printer-friendly Version Interactive Discussion
EGU
OSD
3, 903–938, 2006 Distribution and transport processes of marine particles N. Nowald et al. Title Page Abstract Introduction Conclusions References Tables Figures J I J I Back CloseFull Screen / Esc
Printer-friendly Version Interactive Discussion
EGU
Fig. 5. Close-up of camera stations with available CTD data. Significant changes in the density
structure occur only in the upper water column but a connection between the density and the subsurface particle maximum is not seen.
OSD
3, 903–938, 2006 Distribution and transport processes of marine particles N. Nowald et al. Title Page Abstract Introduction Conclusions References Tables Figures J I J I Back CloseFull Screen / Esc
Printer-friendly Version Interactive Discussion
EGU
Fig. 6. Particle concentration and size distribution at site GeoB 7411. Changes in the particle
OSD
3, 903–938, 2006 Distribution and transport processes of marine particles N. Nowald et al. Title Page Abstract Introduction Conclusions References Tables Figures J I J I Back CloseFull Screen / Esc
Printer-friendly Version Interactive Discussion
EGU
Fig. 7. Concentration and size distribution of profile GeoB 7415 very likely reflects a sinking
event, where material is transferred rapidly from the ocean surface to the seafloor. The sinking cloud (600 m–800 m) preferably scavanges the more abundant smaller size fraction on its way through the water column. This results in a depletion of small particles and a coarsening of the material above and within the sinking cloud (see text for further description).
OSD
3, 903–938, 2006 Distribution and transport processes of marine particles N. Nowald et al. Title Page Abstract Introduction Conclusions References Tables Figures J I J I Back CloseFull Screen / Esc
Printer-friendly Version Interactive Discussion
EGU
Fig. 8. Chlorophyll distribution off Cape Blanc during early April 2001 and late May 2003
acquired by SeaWiFS. Figure 5a is an 8 day average of the chlorophyll distribution starting with day 089 (30 March 2001) and ending with day 096 (6 April 2003). Figure 5b is an 8 day chlorophyll average starting with day 145 (25 May 2003) and ending with day 152 (1 June 2003).