HAL Id: hal-02640747
https://hal.inrae.fr/hal-02640747
Submitted on 28 May 2020
HAL is a multi-disciplinary open access
archive for the deposit and dissemination of
sci-entific research documents, whether they are
pub-lished or not. The documents may come from
teaching and research institutions in France or
abroad, or from public or private research centers.
L’archive ouverte pluridisciplinaire HAL, est
destinée au dépôt et à la diffusion de documents
scientifiques de niveau recherche, publiés ou non,
émanant des établissements d’enseignement et de
recherche français ou étrangers, des laboratoires
publics ou privés.
Fabio Takeshi Matsunaga, Jonas Barbosa Tosti, Armando Androcioli-Filho,
Jacques Duílio Brancher, Evelyne Costes, Miroslava Rakocevic
To cite this version:
Fabio Takeshi Matsunaga, Jonas Barbosa Tosti, Armando Androcioli-Filho, Jacques Duílio Brancher,
Evelyne Costes, et al.. Strategies to reconstruct 3D Coffea arabica L. plant structure. SpringerPlus,
SpringerOpen, 2016, 5 (1), �10.1186/s40064-016-3762-4�. �hal-02640747�
Strategies to reconstruct 3D Coffea
arabica L. plant structure
Fabio Takeshi Matsunaga
1, Jonas Barbosa Tosti
1, Armando Androcioli‑Filho
2, Jacques Duílio Brancher
1,
Evelyne Costes
3and Miroslava Rakocevic
2,4,5*Background
The coffee tree architecture, described as Roux’s model, is a characterized by a contin-uous growth and dimorphic axes (Hallé et al. 1978). An orthotropic axis of 1st order forms, at each node, two syllepetic plagiotropic axes of 2nd order, even though some-times, no branch, or just one develops. The orthotropic axis respects an opposite-decus-sate phyllotaxy. The lateral axes follow an orthogonal—decusopposite-decus-sate pattern of leaf initiation of orthotropic axis, but both internode torsion and petiole angle reorient leaves, result-ing in dorsiventral phyllotaxy (Dengler 1999). In Coffea canefora, the 2nd order axes are rarely branched in 3rd order ones, while in Coffea arabica L. (Arabica coffee), the
Abstract
Accurate model of structural elements is necessary to model the foliage and fruit distributions in cultivated plants, both of them being key parameters for yield predic‑ tion. However, the level of details in architectural data collection could vary, simplifying the data collection when plants get older and because of the high time cost required. In the present study, we aimed at reconstructing and analyzing plant structure, berry distributions and yield in Coffea arabica (Arabica coffee), by using both detailed or par‑ tial morphological information and probabilistic functions. Different datasets of coffee plant architectures were available with different levels of detail depending on the tree age. Three scales of decomposition—plant, axes and metamers were used reconstruct the plant architectures. CoffePlant3D, a software which integrates a series of math‑ ematical, computational and statistical methods organized in three newly developed modules, AmostraCafe3D, VirtualCafe3D and Cafe3D, was developed to accurately reconstruct coffee plants in 3D, whatever the level of details available. The number of metamers of the 2nd order axes was shown to be linearly proportional to that of the orthotropic trunk, and the number of berries per metamer was modeled as a Gauss‑ ian function within a specific zone along the plagiotropic axes. This ratio of metamer emission rhythm between the orthotropic trunk and plagiotropic axes represents the pillar of botanical events in the C. arabica development and was central in our mod‑ eling approach, especially to reconstruct missing data. The methodology proposed for reconstructing coffee plants under the CoffePlant3D was satisfactorily validated across dataset available and could be performed for any other Arabica coffee variety.
Keywords: Plant architecture, Berry distribution, Metamer, LAI, Vertical profile,
Gaussian model, Python
Open Access
© The Author(s) 2016. This article is distributed under the terms of the Creative Commons Attribution 4.0 International License (http://creativecommons.org/licenses/by/4.0/), which permits unrestricted use, distribution, and reproduction in any medium, provided you give appropriate credit to the original author(s) and the source, provide a link to the Creative Commons license, and indicate if changes were made.
RESEARCH
*Correspondence: [email protected]
4 Present Address: Institute
of Biology, UNICAMP, Rua Monteiro Lobato, 255 ‑ Cidade Universitária, Campinas, SP 13083‑862, Brazil
Full list of author information is available at the end of the article
plagiotropic axes develop from the 2nd to the 5th orders. The highest axes orders appear in three to four years after pruning (Rakocevic and Androcioli-Filho 2010).
Coffea canefora has been the first vegetative species to be modeled based on stochas-tic processes for representing growth distribution and branching. And in early stages, linear regression linking the number of metamers emitted on 1st and 2nd order axes is defined (de Reffye 1981). Despite numerous studies and models previously developed on C. canefora (Cilas et al. 2006) no model presently exists for C. arabica. Such model would allow predicting 3D tree architecture, berry distribution within tree structure and yield over time. For modeling the foliage distribution, berry distribution and yield, an accurate model of structural elements dynamics is thus necessary for this species. A first module called ‘VirtualCafe3D’ (Matsunaga and Rakocevic 2011) was previously devel-oped to reconstruct coffee mock-ups from local geometrical and topological measure-ments. This development mainly allowed us to overcome some limitations in VPlants (Pradal et al. 2009), which referred to branch and leaf dimorphism observed in Coffea sp. In ‘VirtualCafe3D’, geometrical adjustments of branch cardinal orientation and spatial distribution of the two leaves in a pair at a node were achieved by insertion of very short “virtual” internodes.
Plant architecture can be described at various degrees of detail (Barthélémy 1991; Godin et al. 1999a), from very detailed description, when all plant metamers are meas-ured, to low detailed description, when only some of components are measured. Inter-mediate and mixed levels of details can also be considered, when parts of the plants are described with low details while others are described with high detailed measurements (Godin 2000). Whatever is the detail level, data for plant 3D reconstructions could be collected by diverse methods of digitizing (Godin et al. 1999a; Li et al. 2015; Preuksa-karn 2012) or local measurements (Godin et al. 1999a; Rakocevic and Androcioli-Filho
2010). In experiments, we carried out over years, architectures of Arabica coffee plants were collected with different levels of details and different sampling strategies, depend-ing on the plant age and observation year. This generated a general problem of 3D recon-struction of plants with missing data, to fully benefit from the data acquired. To face this problem, a second module—‘AmostraCafe3D’ was proposed (Rakocevic et al. 2013; Matsunaga et al. 2014). In this module, the berry presence and number were modeled by a Gaussian function, considering as parameters the maximum number of berries and the interval of metamer ranks at which berry may occur along 2nd order axes. Even though such Gaussian functions were able to reproduce the asymmetry of the maximum num-ber of num-berries in a specific zone of num-berry appearance along 2nd order axes, the estimation of mean berry number per 2nd order axes were under-estimated.
In the present study, we aimed at further improving our strategy to be able to recon-struct a 3D recon-structure of whole C. arabica trees using either detailed or partial morpho-logical information collected on whole plants, as branching structure and leaf/berry distribution. For this purpose, several modules for reconstruction of virtual plants were integrated to make the ‘CoffePlant3D’ system. Following previous findings on we hypothesized that the growth of 2nd order axes could be linearized with respect to that of the orthotropic trunk. The berry distribution was hypothesized to follow a Gauss-ian function with berries number mean at boundaries of zones of appearance along the
orthotropic and plagiotropic axes. With these new assumptions we built CoffePlant3D system.
Results
Software development
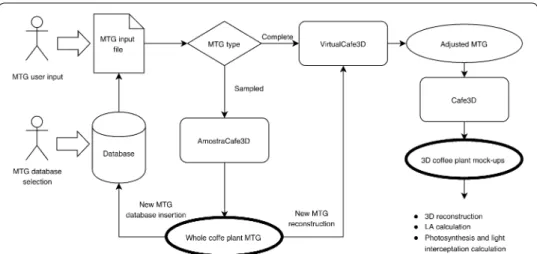
CoffePlant3D software, dedicated to 3D coffee reconstructions, integrated three inter-connected modules (AmostraCafe3D, VirtualCafe3D and Cafe3D) and processes, rang-ing from user interface to input of information related to plant, field and productivity (Fig. 1). All modules of CoffeePlant3D were developed with Python language (Borcherds
2007) under PyCharm IDE, using NumPy and SciPy libraries and packages for numerical and statistical methods, respectively. AMLPy was used for multiscale tree graph (MTG) architecture manipulation, and PlantGLViewer (Pradal et al. 2009) for plant geometric reconstruction and visualization.
In CoffePlant3D, the output of one module was the input to the next one performing an automatic process flow (Fig. 1). The initial input of CoffeePlant3D can be a MTG file created by the user or selected from the database as a MTG like conditions of inter-est (year of production—PY, spatial plant arrangement). The datasets and extracted data were stored in a database, projected in Oracle. The entity-relationship model (Codd
1970) was applied to represent the data storage, aiming at modeling the relationship between entities. Entities data were inserted, queried and updated by Structured Query Language scripts. The database was modeled in a normalized form (Codd 1982), opti-mizing the data representation and avoiding data redundancy.
The hierarchy of CoffePlant3D software was represented by multiple class inherit-ance and composition, using object-oriented programming concepts (Kindler and Krivy
2011). The data structure was composed by three main object classes, corresponding to the MTG scales. The recursive routing algorithm (Javanian and Vahidi-Asl 2006) was applied to convert the CoffeePlant3D data structure to MTG or vice versa. This algo-rithm routed all metamer objects, starting from the orthotropic axis, and writing all
Fig. 1 CoffeePlant3D dataflow linking complete or partially detailed MTG of coffee plants, MTG database,
AmostraCafe3D (inclusion of missing data at metamer scale), VirtualCafe3D (geometrical correction of axes orientation and leaf pair position and orientation) and Cafe3D (visualization of the 3D plant structure) mod‑ ules to final 3D coffee mock‑ups
metamers respecting the hierarchy of branching orders. The temporal algorithm com-plexity was O(log(n)), where log(n) represents the average time processing in a tree node search, since the tree data structure is efficient to search elements and nodes.
Reconstruction from partial or simplified datasets
When coffee plants were sampled under mixed levels of details, the MTG needed to be topologically complemented by AmostraCafe3D module. This module receives as input one MTG with mixed levels of details about axes and performs the reconstruction of missing data. For this, both partially and detailed measured 2nd order axes were clas-sified by their position along the orthotropic axis, considering 40 cm-thick layers along the vertical tree profile (Rakocevic et al. 2013). The total numbers of berries and axis length were used as variables to classify all axes (partially and completely described) that appeared on the same cardinal orientation, using the k-means method. In our case, two or three classes and two to five vertical layers were considered, depending on the tree height.
The AmostraCafe3D considered four attributes for each metamer in reconstruction: leaf, branching and berry presence or absence and internode length. Their probabili-ties were generated based on properprobabili-ties of completely measured axes classified in the same cluster, attributing the presence or absence at each node along the partially meas-ured 2nd order axes. These probabilities were randomly chosen by running the ‘choice’ function, which uses the Mersenne twister as the core generator (Katzgraber 2010). The input of this function was a binary vector Vi of n positions (for leaf/branching/berry presence), and it returns one random element from this vector as output, respecting the generated probability. The Mersenne twister generates pseudorandom number gen-erator (PRNG), for generating a sequence of numbers x1, x2, …, xn using a recurrence
defined as xi=f (xi−1, xi−2, . . . , xi−n), where n is the initial numbers needed to start the
recurrence. All generated PRNGs in AmostraCafe3D produced the binary vector Vi of
0 and 1. This procedure was recursively applied to 3rd 4th and 5th order axes, when the vectors representing the berry presence or absence were generated. A different approach was performed for the leaf and branching presence or absence, where the whole struc-ture of 3rd, 4th and 5th order axes was copied from completely measured to partially measured axes, but respecting the synchronization of events. The reconstruction of each internode length, along 2nd order partially measured axes, was based on point wise esti-mated probability of real length and average length of the internodes obtained from the completely described axes situated in the same cluster and ‘choice’ function.
It was assumed that the second order axes have the same phyllochron with 3rd, 4th and 5th order axes. A linear model was applied, permitting the syn-chronization to the emitted metamer number in partially measured axes. The rule applied to generate the correct index at each metamer was defined as fol-lows: y = (a − b) + x, if a > b; y = x − (b − a), if a < b and x > (b − a); y = 1, if x < (b − a) where the variables a and b represented the orthotropic rank axis to be reconstructed and the orthotropic rank of the complete measured axis, respectively. The variable x represents the metamer index being reconstructed, while y represents the metamer index on the measured axis equivalent to x.
After clustering the branches by k-means method, the partially measured axes recon-struction started, respecting the indexes from the bottom to the top. The length and number of metamers of the 2nd order axes, as well as the zones containing mature (mb) and immature berries (ib), were estimated depending on their rank along the orthotropic axes and field treatments.
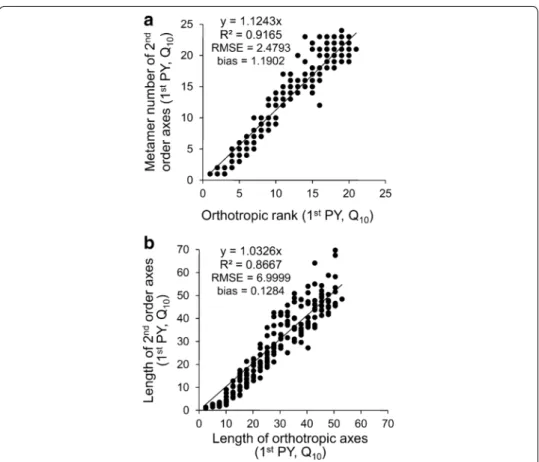
Axes growth depending of year of production and cultural practices
The mean number of metamers and length of the 2nd order axes were linearly depend-ent on their insertion rank from the top of the trunk (Table 1; Figs. 2, 3). In the 1st PY, the regression coefficient between the number of metamers of the 2nd order axes and the number of metamers of the orthotropic axis above their insertion rank was close to 1 (Table 1). Its values decreased with tree development and years, from more than 1 to 0.91 in Q10 and from 0.97 to 0.71 in R6. They also varied between cultural practices,
with lower values observed for R PP (0.87 and 0.97 for R10 and R6 in 1st PY, respectively)
than Q PP (1.12 and 1.00 for Q10 and Q6 in 1st PY, respectively; Table 1). This means that
the 2nd order axes emitted slightly less metamers when the plant was grown in R PP. When the length of 2nd order axes was related to the same variable on the orthotropic axes, measured above the insertion rank, higher slopes were observed in 1st than 2nd PY (Table 1; Figs. 2, 3). Obviously, the number of metamers increased with years in both 1st and 2nd order axes (Fig. 2a vs. Fig. 3a).
The 2nd order axes were filled by metamer number based on the length probability of each internode and the defined regression coefficients (Table 1) plus their respective R2,
all stored in the database. The regression coefficients had a role to adjust the metamer number to the total measured axis length based on the predicted length and to consider a range of variability consistent with R2. Finally, the measured axes length was attributed.
The difference between the expected and measured axes was either added or subtracted to the length of each internode.
Computing the berry distribution
The next step was to compute the berry distribution based on metamer number, vectors of berry presence/absence and measured total berry number per axes. The equations for berry distribution were obtained by manipulation of experimental datasets extracted from MTGs, which were crossed and combined to logical rules referent to the Arabica
Table 1 Coefficient of the linear regressions between the number of metamers and the length of orthotropic and plagiotropic axes
Plants grown under two densities (6000 and 10,000 plants ha−1) and planting patterns—PP (square—Q and rectangular—R)
in 1st, 2nd, 6th and 7th production year (PY) after the pruning
PY Variable Q10 Q6 R10 R6
1st Metamer number 1.124 1.000 0.871 0.974
Length of 2nd order axes 1.033 0.891 0.828 0.960
2nd Metamer number 0.959 1.138 0.895 0.930
Length of 2nd order axes 0.794 0.859 0.931 0.798
6th Metamer number 0.956 0.868 0.887 0.793
coffee architectural patterns. Incidence range (initial and final index of berry occurrence) and the respective berry number on the boundaries, maximum productivity value and their position index considering all branching orders, were used in Gaussian function to model berry distribution along the 2nd order axes: f (x) = G(x) + (Nb(i) − G(i));
G(x) = a · exp −(x − b)2/ 2c2
where a was the curve height, defined as the maxi-mum number of berries (mb or ib); b was the position of a curve peak center, defined as the local of highest incidence of berries; c the controlled length of the sinus; x was the index of a 2nd order axes internode; i was the region (limits determining the region of berries incidence, i.e. the beginning and the end) of the respective value of berry number Nb(i). If x < a, i and Nb(i) considered the beginning, while if x > a, i and Nb(i) considered
the end of the region. The modification of curve center allowed the curve displacement, while the values of extreme limits allowed the deformation and asymmetry of the curve. After the Vi and Gaussian function definition, the total berry number was distributed proportionally over the axes metamers, considering the proportional values attribution over the metamer rank with berry existence (1 on the Vi): B(i) = Ceil (Nb·Vi)/ Vi ,
for 0 ≤ i ≤ n, where B(i) is the computed berry number (for mb and ib) to be attributed in a metamer i, Nb is the total berry number obtained from MTG, n is the number of
the metamers and the Ceil(x) function was applied to round the berry number up to
Fig. 2 Linear model established in the 1st production year between: a measured number of metamers of
2nd order axes and their rank of insertion on orthotropic trunk and b measured length of 2nd order axes and the length above their insertion on orthotropic trunk. Example of square planting pattern and 10,000 plants per ha−1—Q
attribute the non-zero values, when the Vi value is equals to 1. The same methodology
was applied on 3rd, 4th and 5th order axes.
Accuracy of axes and berry distributions on trees reconstructed with AmostraCafe3D
The accuracy of axis attributes (i.e. number of metamers, length and number of berries) obtained with AmostraCafe3D was verified in the 2nd PY, in which low detailed meas-urements were performed, by comparison with the 1st PY in which the metamer num-ber was measured on all axes. The dispersion in the estimated numnum-ber of metamers of the 2nd order axes, depending on their rank along orthotropic axes, increased in 2nd PY (Fig. 3a) compared to the 1st PY (Fig. 2a), as shown by comparing the R2 (0.62 vs.
0.92), RMSE (5.31 vs. 2.48) and, to a lesser extent, bias values (−0.77 vs. 1.19 at Fig. 3a vs. Fig. 2a). Similar observation could be done about the 2nd order axes length estimations in 2nd PY (Fig. 3b) compared to length measurements in the 1st PY (Fig. 2b), with R2
(0.79 vs. 0.87), RMSE (11.12 vs. 6.99) and bias (8.28 vs. 0.13), respectively. However, we decided that these values of R2, RMSE and bias were acceptable for modeling of
meta-mer and length distribution at axis scale to further proceed to validation at more inte-grated scales.
Fig. 3 Linear model established in the 2nd production year between: a measured and computed number of
metamers of 2nd order axes and their rank of insertion on orthotropic trunk and b measured length of 2nd order axes and the length above their insertion on orthotropic trunk. Example of square planting pattern and 10,000 plants per ha−1—Q
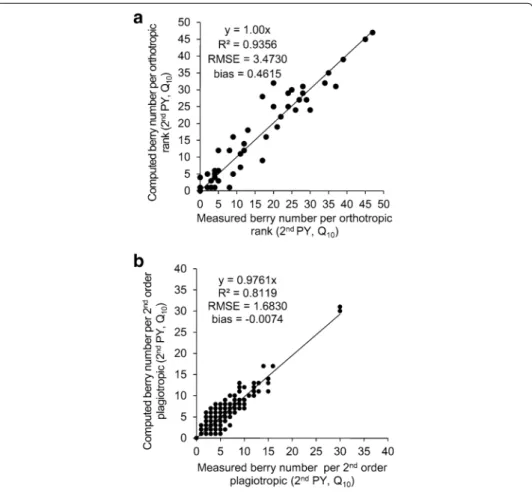
The measured and computed sum of berries of the 2nd order axes were compared using the whole dataset regardless the particular square planting pattern under 10,000 plants per ha−1 (Q
10) in the 2nd PY (Fig. 4). The berry occurrence was observed across a
vertical profile, i.e. on the 2nd order axes inserted along the orthotropic trunk (Fig. 4a) and across the horizontal profile, i.e. along the 2nd order plagiotropic axes (Fig. 4b). The Gaussian model of berry distribution that was used to estimate berry distributions was considered accurate, considering the R2 close to 1 (1.00 and 0.98, along the vertical and
horizontal profiles, respectively).
Visualization of the mock‑ups
The software flow (Fig. 1) proceeded to reconstruction and visualization module (Cafe3D). All vertices of the MTG, considering the three scales of decomposition were extracted, and a ‘Dressing Data’ file from the PlantFrame function—an AMLPy method (Godin et al. 1999b; Pradal et al. 2009) was used to define the geometrical structure of the coffee plant. For berries, an ellipsoidal form was attributed, simpler than the com-plex geometrical fruit modeling (Tinoco et al. 2014).
Fig. 4 Validation of the Gaussian model for berry distribution. Comparison between measured and com‑
puted number of berries: a on 2nd order axes inserted along orthotropic trunk and b along ranks of 2nd order axes. Example of square planting pattern and 10,000 plants per ha−1—Q
10 dataset in the 2nd produc‑ tion year
The general data structure permitted the lecture, conversion, creation and further pro-cessing of MTG that represented coffee plants. Depending on the detail degree of the input (mixed or high detailed), the processing might not use all the modules for the 3D reconstruction. If the leaf length and width were defined, the reproduction of individual 3D coffee leaf, constructed on 16 triangles, was performed by reduction of leaf length and width equally to the measured values of individual leaf surface (Rakocevic et al.
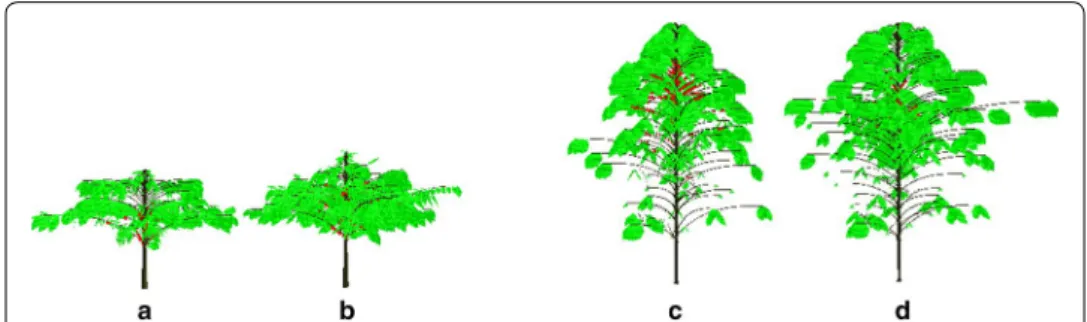
2013). The functions applied were: length = len × √0.685 and width = wid × √0.685. The mock-ups were considered the final output of CoffePlant3D software. The visuali-zation of average coffee plant reconstructed for four observed production years, i.e. 1st, 2nd, 6th and 7th PY cultivated under Q10 planting design, was performed considering
the periods of berry ripening (Fig. 5).
Accuracy of the leaf area (LA) and mock‑ups reconstructed with AmostraCafe3D at plant scale
The reduced dataset was used to test the adequacy of reconstructions with Amostra-Cafe3D at the plant scale, including the total number of metamers (Fig. 6a), axes (Fig. 6b), mb (Fig. 6c) and ib (Fig. 6d) per plant. The dispersion in estimations of the four variables was acceptable according to R2 (0.83, 0.85, 0.93 and 0.97) and RMSE compared
to mean value (55.56–733.15, 2.51–91.3, 13.55–93.35 and 8.58–10.15), respectively (Fig. 6a–d). The average bias indicated a general underestimation of all estimated vari-ables: −15.7 for the total number of metamers per plant (Fig. 6a) and −2.35 for the total number of axes per plant (Fig. 6b), likely to result from rules used to reconstruct high order axes (3rd order axes appeared in the 1st PY). The berry number was reconstructed with high accuracy, with the bias of −5 and −11.1, for the total mb and ib per plant (Fig. 6c, d, respectively).
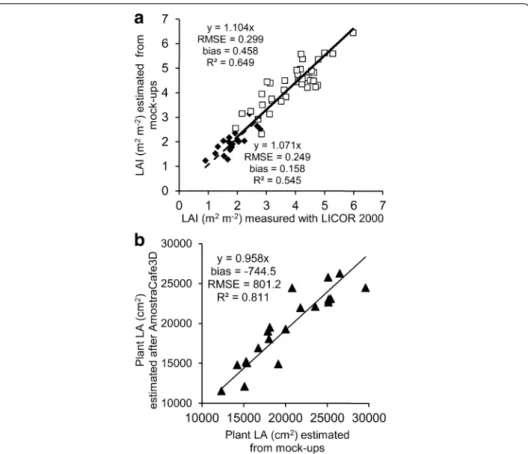
The leaf area index (LAI) of reconstructed mock-ups, based on either detailed or par-tial datasets was estimated under the VegeSTAR for the 1st PY and the 2nd PY and com-pared to the measured values obtained with LICOR-2000 (Fig. 7a). The reconstructed LAI was accurate, considering the average bias and RMSE values (0.158 and 0.249 for the 1st PY, and 0.458 and 0.299 for the 2nd PY, respectively). The bias values suggested that the LAI estimated from the mock-ups were in average slightly overestimated com-pared to measured values. The LA issued from the detailed description of twenty plants collected 1st PY was compared with the same data after its reduction to a partial data-set (Fig. 7b). The reduced dataset was posteriorly processed with AmostraCafe3D to be
Fig. 5 Mock‑ups of average Arabica coffee plants in: a 1st, b 2nd, c 6th and d 7th production years. Example
of square planting pattern and 10,000 plants per ha−1—Q 10 dataset
modeled into the three scales described, and fitted to the original data. The RMSE for LA was low (801.2 cm2 compared to mean value 20,271 cm2). The LA estimation after
AmostraCafe3D was slightly underestimated compared to the original detailed datasets (average bias = −744.5 cm2).
Discussion
In this study, we proposed an empirical approach to model the 3D structure and berry distribution of C. arabica based on experimental data collected manually. This led us to build static reconstructions of coffee plants at three scales and for several dates of berry ripening. The final CoffePlant3D out-puts were accurate mock-ups that could be used for further ecophysiological and environmental manipulation and calculation. Our strat-egy was close to methods based on a limited number of partial measurements of organs geometry on which allometric relationships are applied to reconstruct plant architec-ture from organ scale to the entire stand scale (e.g. Casella and Sinoquet 2003). Another strategy could have been to record 3D points by digitizing (Sinoquet et al. 1997), but this method has been shown to be also highly time consuming, and not adapted to describe many individuals. More recently, reconstruction methods based on image processing (Phattaralerphong and Sinoquet 2005; Quan et al. 2006), 3D laser scanner (Preuksa-karn 2012), and 3D vision sensors (Nakarmi and Tang 2012) have been proposed and
Fig. 6 Comparison between measured structural and reproductive parameters, based on detailed dataset
and estimated after AmostraCafe3D processing on the reduced dataset: a number of metamers per plant, b number of axes per plant, c number of mature berries (mb) per plant and d number of immature berries (ib) per plant
are likely to improve data collection efficiency. Image-based approaches proved useful in fast phenotyping providing the information needed to compute plant traits summary, such as total LA or mean leaf angle (White et al. 2012). However, many difficulties still should be overcome, regarding organ occlusions or accessibility in high-density planting systems, before data issuing from such alternative methods could be performed on cof-fee tree and integrated in the Cofcof-feePlant3D pipeline we proposed herein.
The coffee plants reconstructed with CoffeePlant3D was shown to be accurate, espe-cially in berry distribution, number of metamers and axes, and LA. At plant scale, LAI estimations were validated by the measurements performed with LICOR 2000 since the overestimation was about 10%, i.e. within a range considered acceptable for coffee plants (Angelocci et al. 2008). Our modeling approach was based on the exploration of rich databases and rules derived from coffee plant architecture. A central rule we used was based on the linear regression linking the number of metamers emitted on 1st and 2nd order axes. This growth pattern, herein observed in C. arabica, was similar to that previ-ously defined between the orthotropic and 2nd order axes growth at early stages of C. canefora vegetative growth (de Reffye 1981). The emission rate was shown to decrease with plant age and depended on branching order in C. arabica, thus following classical ontogenetic rule previously observed by Dauzat et al. (2012).
Fig. 7 Validation of the leaf area parameters at plant scale: a measured and estimated LAI from mock‑ups
in the 1st and 2nd PY and b LA of plants estimated from mock‑ups based on detailed dataset and obtained after AmostraCafe3D processing of the reduced dataset
In many species, the plant dynamics showed synchronous emergence of organs, as for instance in rice the synchronized emergence of leaves on the main stem and on the tillers up to flowering (Jaffuel and Dauzat 2005). A similar synchronization in the emergence of metamer number, depending on position and branching order was accounted in our computational approach for coffee mock-up reconstructions. In CoffePlant3D, the prob-ability of ‘choice’ function was used to access the information from axes to metamers scales, if the included variables were independent (Magidson and Vermut Magidson and Vermunt 2002). Moreover, this function was fitted to the observed values of the number of metamers, berries and leaves in the whole plant. The intensity of berry distribution along plagiotropic axes was modeled by Gaussian function in CoffeePlant3D, consider-ing the probability of berry occurrence within specific zones. The Gaussian function is a parametric and low-cost function appropriate for modeling biological and natural sys-tems, as responses of wind plant turbulence (Wu and Infield 2013), real-life behavior framework for non-playable character simulation (Kyungeun et al. 2007), or for mod-eling the plants size variation in maize plots (Picoli et al. 2012). This strategy permitted the reconstructions of Arabica coffee plants at specific static stages of berry ripening.
To reconstruct Arabica coffee plant at any stage, further developments of Coffe-Plant3D will be required, for instance by exploring Markovian models and dynamic functions. Indeed, Markovian models (Costes and Guédon 2002; Renton et al. 2006), L-systems (Prusinkiewicz and Lindenmayer 1990; Loik and Cournède 2008), or dynamic functions—Poison law and binomial (de Reffye 1981), have been successfully applied in mechanistic and probabilistic models, such as GreenLab (Kang et al. 2007), MAppleT (Costes et al. 2008) and LPeach (Lopez et al. 2010) to generate dynamically 3D plant structures.
Conclusions
The 2nd order axes growth was shown to be linearly correlated to that of the ortho-tropic axis, this synchronizing the branching structures and berries distribution in both the vertical and horizontal profiles. This dynamic is a pillar event in the Arabica cof-fee life and was central in our modeling approach at all scales, from plant to metamer scale. Reconstructions of coffee plants under the CoffePlant3D could now be performed for any other Arabica coffee variety in a period of production of plants. Our research efforts will focus in the next future on the development of a dynamic model of coffee tree growth, in interaction with its environment, including the apex mortality and varia-tions on phyllochron depending on temperature and water availability.
Methods
Plant material and architectural data collection
The experiment was set up at the Agronomical Institute of Paraná (IAPAR), Londrina (23°18′S and 51°17′W, 563 m above the sea level), Brazil, with adult C. arabica trees, of the most popular Paraná cultivar—IAPAR 59. The seedlings were planted in 1995 and pruned close to the ground (1st in 2000 and 2nd in 2008). Two high plant densi-ties (6000 and 10,000 plants ha−1) combined to two planting patterns (PP), square (Q)
and rectangular (R) defined four treatments identified as Q10, R10 (3 m × 0.33 m), Q6
The plants were coded as a Multi Scale Tree Graph—MTG (Godin and Caraglio 1998), under VPlants. The coffee plant topology was decomposed into three scales: the plant, the axes and the metamer scale in which two distinct subclasses were used to distinguish the axes they belong to, orthotropic and plagiotropic (Rakocevic and Androcioli-Filho
2010). The branching process started from the orthotropic axis (1st order) to higher axes orders (up to 5th), which were recursively defined.
The level of details in data collection could vary, simplifying the detailed collection when older coffee plants were measured, because of the high time cost for data col-lection. Whatever was the level of detail, the orthotropic axis was always described at the metamer scale. A very detailed architectural description was performed in the 1st PY after the low pruning, in June 2010, before the first berry collection. For each pla-giotropic axis was defined the length of each internode, length/width/elevation angle/ cardinal orientation of leaves, number of mature (mb) and immature berries (ib) and position/orientation/total length of borne plagiotropic axes.
When plants were more developed (2nd, 6th and 7th production year) partially detailed data collection was performed. Four 2nd order axes were sampled (each one oriented to one cardinal point), in each 40 cm-thick layer along a vertical tree profile. These axes were described at the metamer scale, as well as their lateral axes of 3rd to 5th order. The detailed description of plagiotropic metamers included the same param-eters as for orthotropic metamers, plus mb and ib number. All other 2nd order axes were described by their position along the orthotropic trunks, total length, mb and ib number, elevation angle and cardinal orientation.
To validate the computational methods used for reconstructions of coffee plants, the very detailed dataset collected in 2010, the 1st production year (PY), was transformed into a partially detailed dataset. Four 2nd order axes, oriented to four cardinal points, were maintained in each 40 cm-thick layer with their detailed description at metamer scale. Data collection on all the other axes was reduced to their attributes, i.e. total length, elevation, total mb and ib number. The accuracy of 3D reconstruction obtained from the simplified dataset was tested for the total number of metamers per plant, num-ber of axes per plant and leaf area index (LAI). This latter variable was estimated from mock-ups in VegeSTAR (Adam et al. 2006) and measured with LICOR 2000 in the 1st and 2nd PY, with an indirect method adapted for coffee plants on a set of ten shots: the first one was made above the canopy, the next eight below the plant crown at 5 cm and 35 cm from the trunk and oriented to four cardinal points; the tenth shot was again per-formed above the canopy. Measurements were perper-formed on 20 plants in the 1st PY and on 36 in the 2nd PY.
Data extraction from the MTGs was performed using AMAPstudio—Xplo software (Griffon and de Coligny 2014). A special attention was paid on berry distribution along the orthotropic trunk and along 2nd to 5th order axes. The extracted data (number of axes metamers per axes, length of axes, number of berries per rank/metamer/axes) were used to generate relationships between the metamer number/length of 1st and 2nd order axes, as for the berry distribution. Those relationships, together with boundaries and zones of berry distribution were included into a database linked to CoffeePlant3D software.
Statistical analyses
Statistical analyses were performed with R.3.2.2 (R Development Core Team 2015). Lin-ear regressions were used to compare the estimations of measured plants versus those processed under CoffeePlant3D on the following variables: number of metamers along the orthotropic and plagiotropic axes, number of lateral axes. R2, RMSE and medium
bias were used as indicators of the reconstruction quality.
Authors’ contributions
FTM developed the VirtualCafe3D and Cafe3D, JBT developed the AmostraCafe3D under coordination of JDB. AA‑F coordinate the establishment and maintenance of the field experiment. MR and AA‑F collected the experimental data, MR conceived of the study and participated in its design and coordination, while EC, MR and FTM were most involved in data analyses and manuscript confection. All authors read and approved the final manuscript.
Author details
1 UEL, Rodovia Celso Garcia Cid, Pr 445 km 380, P.O.Box 10011, Londrina, PR 86057‑970, Brazil. 2 IAPAR, Rodovia Celso
Garcia Cid, km 375, P.O.Box 481, Londrina, PR 86047‑902, Brazil. 3 UMR AGAP Equipe Architecture et Fonctionnement des
Espèces Fruitières, INRA, Avenue Agropolis, TA A‑96/03, 34398 Montpellier, France. 4 Present Address: Institute of Biol‑
ogy, UNICAMP, Rua Monteiro Lobato, 255 ‑ Cidade Universitária, Campinas, SP 13083‑862, Brazil. 5 Embrapa Informática
Agropecuária, Avenida André Tosello 209, P.O.Box 6041, Campinas, SP 13083‑886, Brazil. Acknowledgements
This work was partially supported by Brazilian Consórcio Pesquisa Café (02.09.20.008.00.03 and 02.13.02.042.00.03), which also offered the Grant for the invited researcher [MR]. The Grant for the assistant in research [FTM] offered by CNPq (381241/2014‑9) is gratefully acknowledged.
Competing interests
The authors declare that they have no competing interests. Received: 11 February 2016 Accepted: 30 November 2016
References
Adam B, Dones N, Sinoquet H (2006) VegeSTAR: software qui calcule l’interception lumineuse et la photosynthèse. Ver‑ sion 3.2., INRA, Clermont‑Ferrand
Angelocci LR, Marin FR, Pilau FG, Righi EZ, Favarin JL (2008) Radiation balance of coffee hedgerows. Rev Bras Eng Agríc Ambient 12(3):274–281. doi:10.1590/S1415‑43662008000300008
Barthélémy D (1991) Levels of organization and repetition phenomena in seeds plants. Acta Biotheor 39:309–323. doi:10.1007/BF00114184
Borcherds PH (2007) Python: a language for computational physics. Comput Phys Commun 177(2):199–201
Casella E, Sinoquet H (2003) A method for describing the canopy architecture of coppice poplar with allometric relation‑ ships. Tree Physiol 27:1153–1170. http://treephys.oxfordjournals.org/content/23/17/1153.full.pdf
Cilas C, Bar‑Hen A, Montagnon A, Godin C (2006) Definition of architectural ideotypes for good highest capacity in Coffea canephora. Ann Bot 97:405–411. doi:10.1093/aob/mcj053
Codd EF (1970) A relational model of data for large shared data banks. Commun ACM 13(6):377–387. doi:10.1145/362384.362685
Codd EF (1982) Relational database: a practical foundation for productivity. Commun ACM 25(2):109–117. doi:10.1145/358396.358400
Costes E, Guédon Y (2002) Modelling branching patterns on 1‑year‑old trunks of six apple cultivars. Ann Bot 89(5):513– 524. doi:10.1093/aob/mcf078
Costes E, Smith C, Renton M, Guédon Y, Prusinkiewicz P, Godin C (2008) MAppleT: simulation of apple tree development using mixed stochastic and biomechanical models. Funct Plant Biol 35(10):936–950. doi:10.1071/FP08081
Dauzat J, Griffon S, Marraccini P, Rodrigues G (2012) Modelling vegetative growth and architecture of Coffea arabica cultivars under water stress. 24th ASIC. http://asic‑cafe.org/en/system/files/2012_A18_DAUZAT.pdf
de Reffye P (1981) Modèle mathématique aléatoire et simulation de la croissance et de l’architecture du caféier Robusta 1re partie Etude du fonctionnement des méristemes et de la croissance des axes végétatifs. Café Cacao Thé
25(2):83–104
Dengler NG (1999) Anisophylly and dorsiventral shoot symmetry. Int J Plant Sci 160(S6):67–80. doi:10.1086/314218
Godin C (2000) Representing and encoding plant architecture: a review. Ann For Sci 57(5):413–438. doi:10.1051/ forest:2000132
Godin C, Caraglio Y (1998) A multiscale model of plant topological structures. J Theor Biol 191(1):1–46. doi:10.1006/ jtbi.1997.0561
Godin C, Costes E, Sinoquet H (1999a) A plant architecture description method integrating topology and geometry. Ann Bot 84(3):343–357. doi:10.1006/anbo.1999.0923
Godin C, Guédon Y, Costes E (1999b) Exploration of a plant architecture database with the AMAPmod software illustrated on an apple tree hybrid family. Agronomie 19:163–184. doi:10.1051/agro:19990301
Griffon S, de Coligny F (2014) AMAPstudio: an editing and simulation software suite for plants architecture modelling. Ecol Model 290(1):3–10. doi:10.1016/j.ecolmodel.2013.10.037
Hallé F, Oldeman R, Tomlinson P (1978) Tropical trees and forests: an architectural analysis. Springer‑Verlag, Berlin Jaffuel S, Dauzat J (2005) Synchronism of leaf and tiller emergence relative to position and to main stem development
stage in a rice cultivar. Ann Bot 95:401–412. doi:10.1093/aob/mci043
Javanian M, Vahidi‑Asl MQ (2006) Depth of nodes in random recursive k‑ary trees. Inf Proc Lett 98(3):115–118. doi:10.1016/j.ipl.2005.11.020
Kang M‑Z, Cournède P‑H, de Reffye P, Auclair D, Hu B‑G (2007) Analytical study of a stochastic plant growth model: appli‑ cation to the GreenLab model. Math Comput Simul 78(1):57–75. doi:10.1016/j.matcom.2007.06.003
Katzgraber HG (2010) Random numbers in scientific computing: an introduction. Mod Comp Sci. arXiv:1005.4117v1
Kindler E, Krivy I (2011) Object‑oriented simulation of systems with sophisticated control. Int J Gen Syst 40(3):313–343. doi:10.1080/03081079.2010.539975
Kyungeun C, Wei S, Kyhyun U (2007) Gaussian distribution for NPC character in real‑life simulation. IEEE Int Conf IPC, pp 132–135. http://doi.ieeecomputersociety.org/10.1109/IPC.2007.90
Li D, Xu L, Tan C, Goodman ED, Fu D, Xin L (2015) Digitization and visualization of greenhouse tomato plants in indoor environments. Sensors 15:4019–4051. doi:10.3390/s150204019
Loik C, Cournède P‑H (2008) A Markovian framework to formalize stochastic L‑systems and application to models of plant development RR‑6830, pp 24. https://hal.inria.fr/inria‑00359515/document
Lopez G, Favreau RR, Smith C DeJong TM (2010) L‑PEACH: a computer‑based model to understand how peach trees grow. HortTechnology 20(6):983–990. http://horttech.ashspublications.org/content/20/6/983.full.pdf
Magidson J, Vermunt JK (2002) Latent class models for clustering: a comparison with K‑means. Can J Mark (20):37–44.
http://members.home.nl/jeroenvermunt/cjmr2002.pdf
Matsunaga FT, Rakocevic M (2011) Software for geometry adjustments of coffee plant reconstructions in 3D. 7th Braz Symp Coffee Res http://www.sapc.embrapa.br/arquivos/consorcio/spcb_anais/simposio7/52.pdf
Matsunaga FT, Oyamada RS, Novaes MP, Tosti JB, Brancher JD, Rakocevic M (2014) Modeling the berry distribution in AmostraCafe3D software for coffee Arabica reconstructions in 3D 25th ASIC. http://asic‑cafe.org/en/system/ files/2014_pa187_matsunaga.pdf
Nakarmi AD, Tang L (2012) Automatic inter‑plant spacing sensing at early growth stages using a 3D vision sensor. Com‑ put Electron Agric 82:23–31. doi:10.1016/j.compag.2011.12.011
Phattaralerphong J, Sinoquet H (2005) A method for 3D reconstruction of tree crown volume from photographs: assessment with 3D‑digitized plants. Tree Physiol 25:1229–1242. http://citeseerx.ist.psu.edu/viewdoc/ download?doi=10.1 .1.105.6944&rep=rep1&type=pdf
Picoli S Jr, Mendes RS, Lenzi EK, Malacarne LC (2012) Scale‑invariant structure of size fluctuations in plants. Sci Rep 2(328):1–3. doi:10.1038/srep00328
Pradal C, Boudon F, Nouguier C, Chopard J, Godin C (2009) PlantGL: a Python‑based geometric library for 3D plant mod‑ elling at different scales. Graph Model 71(1):1–21. doi:10.1016/j.gmod.2008.10.001
Preuksakarn C (2012) Reconstructing plant architecture from 3D laser scanner data. Modeling and Simulation. PhD Thesis Université Montpellier II—Sciences et Techniques du Languedoc. Reconstructing plant architecture from 3D laser scanner. https://tel.archives‑ouvertes.fr/tel‑00859843
Prusinkiewicz P, Lindenmayer A (1990) The algorithmic beauty of plants. Springer‑Verlag, New York
Quan L, Tan P, Zeng G, Yuan L, Wang J, Kang SB (2006) Image‑based plant modeling. ACM Trans Graph 25(3):599–604.
http://research‑srv.microsoft.com/en‑us/um/people/luyuan/paper/PlantModeling_SIGGRAPH06.pdf
R Development Core Team (2015) R: a language and environment for statistical computing. http://www.rproject.org. Accessed 20 Nov 2015
Rakocevic M, Androcioli‑Filho A (2010) Morphophysiological characteristics of Coffea arabica L. in different arrangements: Lessons from a 3D virtual plant approach. Coffee Sci 5(2):54–166. http://www.coffeescience.ufla.br/index.php/ Coffeescience/article/download/117/pdf
Rakocevic M, Tosti JB, Matsunaga FT (2013) AmostraCafe3D—software for inclusion of missed data on metamer scale to the partially measured branches. 8th Braz Symp Coffee Res. http://www.sapc.embrapabr/arquivos/consorcio/ spcb_anais/simposio8/93.pdf
Renton M, Guédon Y, Godin C, Costes E (2006) Similarities and gradients in growth unit branching patterns during ontog‑ eny in ‘Fuji’ apple trees: a stochastic approach. J Exp Bot 57(12):3131–3143. doi:10.1093/jxb/erl075
Sinoquet H, Rivet P, Godin C (1997) Assessment of the three‑dimensional architecture of walnut trees using digitising. Silva Fennica 31:265–273. doi:10.14214/sf.a8525
Tinoco HA, Ocampo DA, Peña FM, Sanz‑Uribe JR (2014) Finite element modal analysis of the fruit‑peduncle of Coffea arabica L. var Colombia estimating its geometrical and mechanical properties. Comput Electron Agric 108:17–27. doi:10.1016/j.compag.2014.06.011
White JW, Andrade‑Sanchez P, Gore MA, Bronson KF, Coffelt TA, Conley MM, Feldmann KA, French AN, Heun JT, Hunsaker DJ, Jenks MA, Kimball BA, Roth RL, Strand RJ, Thorp KR, Wall JW, Wang G (2012) Field‑based phenomics for plant genetics research. Field Crops Res 133:101–112. doi:10.1016/j.fcr.2012.04.003
Wu L, Infield DG (2013) Towards an assessment of power system frequency support from wind plant‑modeling aggre‑ gate inertial response. IEEE Trans Power Syst 28(3):2283–2291. doi:10.1109/TPWRS.2012.2236365