HAL Id: lirmm-01362428
https://hal-lirmm.ccsd.cnrs.fr/lirmm-01362428
Submitted on 8 Sep 2016
HAL is a multi-disciplinary open access
archive for the deposit and dissemination of
sci-entific research documents, whether they are
pub-lished or not. The documents may come from
teaching and research institutions in France or
abroad, or from public or private research centers.
L’archive ouverte pluridisciplinaire HAL, est
destinée au dépôt et à la diffusion de documents
scientifiques de niveau recherche, publiés ou non,
émanant des établissements d’enseignement et de
recherche français ou étrangers, des laboratoires
publics ou privés.
Patterns of Retweets
Tomy Rodrigues, Tiago Cunha, Dino Ienco, Pascal Poncelet, Carlos Soares
To cite this version:
Tomy Rodrigues, Tiago Cunha, Dino Ienco, Pascal Poncelet, Carlos Soares. RetweetPatterns:
De-tection of Spatio-Temporal Patterns of Retweets. 4th World Conference on Information Systems and
Technologies (WorldCIST), Mar 2016, Recife, Brazil. pp.879-888, �10.1007/978-3-319-31232-3_83�.
�lirmm-01362428�
RetweetPatterns: detection of spatio-temporal
patterns of retweets
Tomy Rodrigues1, Tiago Cunha1, Dino Ienco2, Pascal Poncelet3, and
Carlos Soares1
1 Faculdade de Engenharia da Universidade do Porto, Porto, Portugal
{ei08159,tiagodscunha,csoares}@fe.up.pt
2 IRSTEA - Institut National de recherche en sciences et technologies pour
l’environment et l’agriculture, Montpellier, France [email protected]
3 LIRMM - Laboratoire d’Informatique, de Robotique et de Micro´electronique de
Montpellier , Montpellier, France [email protected]
Abstract. Social media is strongly present in people’s everyday life and Twitter is one example that stands out. The data within these types of services can be analyzed in order to discover useful knowledge. One in-teresting approach is to use data mining techniques to perceive hidden behaviours and patterns. The primary focus of this paper is the identifi-cation of patterns of retweets and to understand how information spreads over time in Twitter. The aim of this work lies in the adaptation of the GetMove tool, that is capable of extracting spatio-temporal pattern tra-jectories, and TweeProfiles, that identifies tweet profiles regarding several dimensions: spatial, temporal, social and content. We hope that the more flexible clustering strategy from TweeProfiles will enhance the results ex-tracted by GetMove. We study the application of said mechanism to one case study and developed a visualization tool to interpret the results. Keywords: Pattern Mining, Spatio-temporal, Clustering
1
Introduction
The proliferation of social media services, like Twitter for instance, has con-tributed to an increase of public available data. Since this data has the potential of holding interesting hidden patterns, many researchers have attempted to ag-gregate and organize it, in order to try to find relationships, relevant changes and anomalies [1, 2].
In this work, we aim to integrate two data mining tools (TweeProfiles [3] and GetMove [10]) and apply the resulting process to a dataset built about the manifestations in Brazil during the period of June to July 2013. TweeProfiles allows the extraction of tweet profiles by taking into account several dimensions: social, temporal, spatial and content. On the other hand, GetMove attempts to extract trajectories from spatio-temporal data. Therefore, our motivation lies
with assessing if by considering the social, temporal, spatial and content dimen-sions of tweets we can obtain an enhancement on the GetMove results for our problem. The process consists in exchanging the standard clustering stage in GetMove with a multidimensional clustering process provided by TweeProfiles. Since the data required and the results can be easily adapted to GetMove, the only di↵erence is that we hope that the results provided by TweeProfiles will empower the clustering with greater detail by taking advantage of the complex relationships in the data. Another goal for our work is the development of a visualization tool capable of displaying the multidimensional trajectory patterns extracted by the previous data mining tool. It is important to find suitable ways of displaying how information propagates, while paying particular attention to the social, temporal, spatial and content dimensions.
This paper is organized as follows: Section 2 discusses the related work on the relevant scientific areas, while Section 3 presents our proposal to integrate TweeProfiles with GetMove in order to apply it to the retweet pattern problem. Section 4 presents our visualization tool and in Section 5 its application to a case study. Lastly, in Section 6, we present our conclusions and future work tasks.
2
Related Work
2.1 Twitter
Twitter4 is a social network that allows to publish instant messages with the
maximum number of 140 characters (also known as a tweet). Within Twitter, social relationships are represented in at least two ways: a user is following some-one and can be followed by other users. These relationships allow the propagation of tweets throughout the platform. There are several tools to aid the communi-cation among users in Twitter, namely mentions (identify a specific user), replies (answer to previous tweet), hashtags (keywords that describe the topic of the tweet) and retweets (share another user’s tweet). Although all of these tools promote data propagation, we focus our study in the retweet actions since we consider them the most unbiased data propagation tool. We justify this decision arguing that by performing a retweet we want to show a specific tweet only to our followers. In fact, in a retweet the content remains unchanged and there is no explicit contact with other users. We believe this means that the tweet con-tains an important message (at least considering the user’s interest) and then the analysis of this specific data propagation tool has potential interest.
2.2 TwitterEcho and TweeProfiles
The TwitterEcho project [1] is a research platform for extracting, storing and analysing the Portuguese Twittosphere for research and journalistic purposes. It collects data using the Twitter API. This platform accesses the Twitter Stream-ing API to obtain real time tweets through the crawler clients. These tweets
RetweetPatterns: detection of spatio-temporal patterns of retweets 3
are sent to a message broker and processed on two components: stream pro-cessing and pre-propro-cessing. After the information is stored, it is subjected to batch processing in order to mine di↵erent kinds of knowledge. This knowl-edge is available through analysis modules which include text mining, opinion mining, sentiment analysis and social network analysis. A more recent version of this project is called SocialBus5 and it has several improvements regarding
query control, monitorization and interoperability with other systems.
The main goal of TweeProfiles [4] is to analyze Twitter’s spatio-temporal data in several dimensions and display the information retrieved with appro-priate visual representations. It contains a multidimensional clustering strategy that considers spatial, temporal, content and social dimensions in an unified fashion. The process consists in the manipulation of dissimilarity matrices for the several dimensions using appropriate distance measures to perform cluster-ing. It creates a dissimilarity matrix per dimension using appropriate distance functions: Haversine for spatial, time di↵erence for temporal, TF-IDF represen-tation with cosine similarity for content and geodesic distance in social graph for the social dimension. After each matrix is created, a min-max normalization pro-cess is executed and the final combination propro-cess delivers the resulting matrix for clustering. The combination formula to obtain the final dissimilarity matrix D4D is a linear combination of the spatial (DSp), temporal (DT), content (DC)
and social (DSo) dissimilarity matrices with the respective pre-defined weights
wSp, wT, wC and wSo:
D4D= wSpDSp+ wTDT + wCDC+ wSoDSo (1)
Afterwards, the final dissimilarity matrix is fed to the DBSCAN clustering algorithm [5] and the results stored. These are accessible by a visualization tool that displays the multidimensional patterns using a spatio-temporal approach. It allows users to choose di↵erent weights for the dimensions considered and provides a wide range of usability features to better analyse the results. The visualization tool is available online6.
2.3 GetMove
The main objective of the GetMove tool [10] is to extract di↵erent kinds of moving object patterns, exploiting techniques coming from the field of frequent closed itemset mining. These patterns can be classified as Swarm, Closed Swarm, Convoy, Moving Clusters and Group Patterns. Before dwelling in the patterns, let us introduce appropriate notations. Considering that we have a group of objects defined as O = {o1, o2, o3...on} and a set of timestamps T = {t1, t2, t3...tn}
associated with each object, each pattern is represented by ({Ok}, {tl}), where
Ok ⇢ O and tl ⇢ T . We consider that the objects at each timestamp tl are a
cluster.
5 http://reaction.fe.up.pt/socialbus/
A Swarm [7] is a group of objects that contains at least " objects during a minimum time mint. The pair ({Ok}, {tl}) is a swarm if there is at least one
cluster containing all the objects at each timestamp tl. A Swarm can be defined as
a Closed Swarm [9] only if the objects remain unchanged for a minimum number of (possibly non-consecutive) timestamps mint. A Convoy is a group of objects
that contains at least " objects for a minimum number of timestamps mint. The
di↵erence to a Closed Swarm is that the timestamps must be consecutive. Moving clusters can be seen as special cases of convoys with the additional condition that they need to share some objects between two consecutive timestamps. A Group Pattern is the combination of the two patterns defined previously. In other words, it is a group of objects that remain unchanged for a minimum number of consecutive timestamps mintand after an indefinite period reappear once again
for a minimum number of consecutive timestamps mint.
The GetMove algorithm has several steps, being the first one the extraction of clusters of objects for each timestamp. To achieve this, the GetMove framework uses a cluster matrix representation where each row represents an item and each column a cluster. The weighting scheme is binary based and similar to the bag-of-words representation: when a cell has the value 1 means that a given item is in the corresponding cluster. Afterwards, it uses the LCM algorithm to extract frequent closed itemsets. It iteratively finds the transitions in which the objects are present and also extracts the common elements for these transitions. The process is repeated for each combination of object subsets possible and the results stored if they fulfill all the conditions required by each pattern.
2.4 Visualizing Twitter Data
There are several approaches to represent Twitter data or information extracted from such data in the literature. It depends not only on the data, but also on the scope of the problem. Silicon Graphics International [6] has partnered with researchers from the University of Illinois in order to perform Sentiment Analysis on tweets. They use a visualization tool to represent the extracted patterns by considering several representations: a map with various geo-referenced tweets, where each tweet is represented according to the feelings expressed with a red (negative feelings) or blue dot (positive feelings). On top of this representation, they use heatmaps that illustrate the feelings of people on Twitter during Hur-ricane Sandy and the presidential elections of 2012.
Another visualization tool that takes advantage of tweets was developed in order to detect the birth and death of rumors on Twitter: Riots [11]. The tool developed was designed to visualize the evolution of tweets related to a partic-ular rumor. The authors decided to represent said rumors in the form of tweets grouped into larger circles, where each circle consists of a set of retweets of a given tweet. In this way, circles represent clusters that define a group of the same or similar elements gathered or occurring closely together. It is also possible to view the progress and associated sentiment of the tweets and retweets clusters over time. The influence and importance of each cluster in the social network is
RetweetPatterns: detection of spatio-temporal patterns of retweets 5
represented by the size of the circle. The tool also features a timeline with the most relevant tweets over time.
Mentionmapp [8] is a web application that uses data from Twitter and allows us to see tweet themes of a user and the people who follow him. The tool shows the connections with di↵erent friends and followers of each user in the social network, as well as relevant hashtags employed by di↵erent users. By selecting a friendship connection, customized information is displayed. There are several types of nodes depending on the geographical distance between users, where closest nodes identify nearby users. Finally, links between nodes also reflect the frequency with which a user makes reference to another user. The thickness of the line represents the amount of information exchanged between the two users.
3
RetweetPatterns
The main focus of this paper is to find retweet patterns using multidimensional clustering. In order to achieve this goal, we use the GetMove tool to extract moving object patterns applied to retweet data. Although the original purpose of the tool is not the retweet patterns, by having access to spatio-temporal data and a data propagation mechanism such as retweets, we can make the required adaptation. Therefore, we use GetMove to extract frequent itemsets. But, unlike in the original implementation, we wish to apply TweeProfiles clustering strategy to find the clusters. We argue that since its process is oriented to spatio-temporal data, it may improve the clustering results, while providing a greater control over the clustering process.
After collecting geo-referenced data from Twitter, we need to process it to fit our problem. The first problem at hand is the di↵erent notion of timestamp in the tweet data and in the GetMove tool. The problem is that if we consider ti to be the timestamp of a retweet, then it will be very hard to find ti in more
than one retweet. Therefore, we solve the problem by using sequences instead, where tiis the order of the timestamp in the set of retweets. The next step is to
separate all extracted retweets with identical content in order to obtain sets of retweets. Afterwards, to obtain the various timestamps ti...tn, we sorted them
in chronological order.
After defining the timestamps, the next step is to perform clustering for each timestamp. We filter the tweets related to each timestamp and apply the TweeProfiles clustering strategy. This step will create more clusters per each timestamp with regards to the spatial, temporal, content and social dimensions. After individually performing the clustering process, we can then build a cluster matrix to be used in GetMove. This way we can apply the GetMove algorithm to analyze the evolution of the clusters over time. We can thus extract Closed Swarms, Convoys, Moving Cluster and Group Patterns.
It is important to understand beforehand the meaning of each moving ob-jects pattern when we apply the GetMove tool to retweet data. Since Closed Swarm extracts patterns involving groups of objects that can be together in non-consecutive timestamps, this means that this pattern tries to find sets of retweets
that are recurrent over time. On the other hand, Convoy extracts groups of ob-jects that need to be together in consecutive timestamps. In our scenario this means that we find sets of retweets that have consecutive timestamps. With re-garding to Moving Cluster, such a pattern can be seen as a special case of convoys with the additional condition that they need to share some retweets between two consecutive timestamps. Finally, the Group Pattern means that we have found disconnected convoys, i.e. sets of retweets having consecutive timestamps which exist up to a certain point and reappear some time later again.
4
Visualization tool
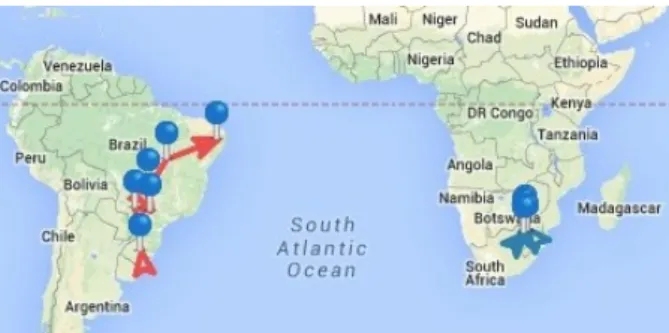
After obtaining the result from GetMove it is important to display the extracted patterns in an intuitive and explicit fashion. The RetweetPattern tool was de-signed to present the results extracted from the GetMove algorithm using one component for each one of the 4 dimensions. The first component is a map that represents the spatial patterns found with GetMove (see Figure 1). The user can observe several patterns: Closed Swarms, Convoys, Moving Clusters and Group Patterns. The choice of patterns a↵ects the data represented in the map and, by extension, in the remaining visualization components.
Fig. 1: Map close-up with moving patterns represented.
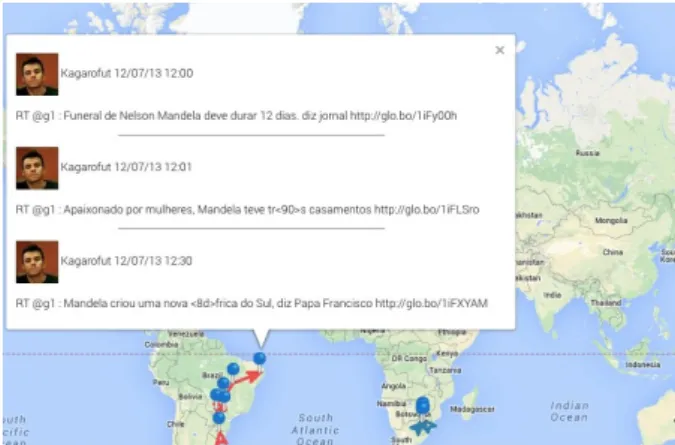
The map displays each pattern by a line that indicates the propagation of tweets (or clusters of tweets) over time. When a point refers to a cluster instead of a single point, its location is averaged from all tweets in the respective cluster. By clicking on the line that represents a pattern we can see the various retweets constituting the pattern. Each point on that line represents a timestamp for the GetMove algorithm. Clicking on a point we can view the users who retweet and when they do it. Figure 2 shows the respective visualization.
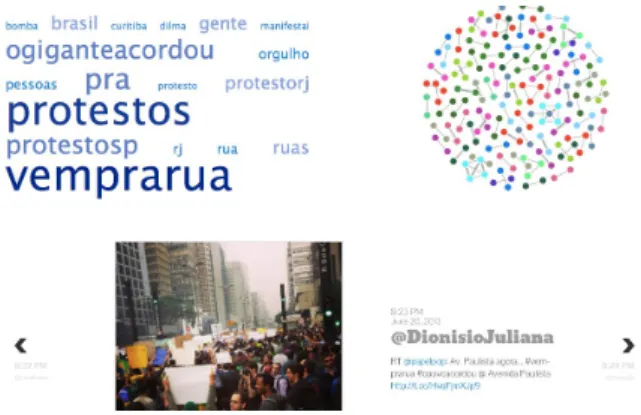
The tool displays the content and the social dimensions using a wordcloud and a social graph, respectively. The wordcloud is simply built using all the text from the retweets, but due to its characteristics enables a clear visualization of the most important topics. The social graph is more complex, since the patterns are represented with the same colors used on the map, but the improvement
RetweetPatterns: detection of spatio-temporal patterns of retweets 7
Fig. 2: Detailed information after clicking on a point.
is that you can quickly view how many paths of retweets are present in each pattern. Each node in the graph represents a user, which represents a point on the map. It is also possible to visualize the social relationship of each user by analysing the graph edges. The thickness of the edge between two nodes is directly proportional to the number of retweets in common. It is also possible to show the name of the user hovering the mouse on top of the node. Due to space constraints, we only present the complete tool layout in Figure 5.
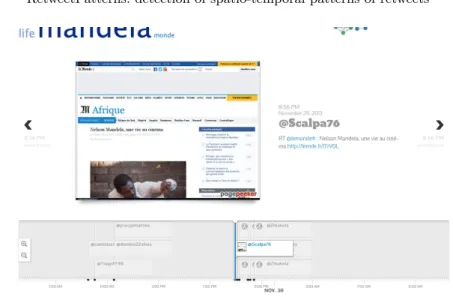
Finally, the temporal dimension is presented by a timeline with all retweets extracted from the algorithm. Figure 3 shows the timeline widget. The retweets here are presented in chronological order and the timeline gives the user the possibility to interact with the person that posted the retweet or with whoever made the initial tweet. By simply pressing its name, the tools present the selected user’s Twitter timeline. Furthermore, if the retweet contains URLs, it is possible to view the content in another browser tab. Our tool is available online7 for
further inspection.
5
Validation and Results Illustration
In this section we will look at a case study referring to a set of retweets extracted at the time of the protests in Brazil. The dataset ranges from June 2013 and July 2013 and consists of a total of 17083 tweets extracted from Twitter during a protests period in Brazil. We performed the pre-processing tasks defined in Section 3 and ended up with 260 di↵erent retweets. The timestamps for GetMove were defined by sorting the tweets chronologically, considering that each retweet is part of a tweet sequence.
Afterwards, we applied TweeProfiles’ DBSCAN clustering algorithm with the following parameters: the minimum number of points always set as 2 and
Fig. 3: Timeline with extracted patterns.
the maximum radius value which we defined as 10%. The minimum number of points was always set as 2, which means that if at least 2 retweets are reachable within the circle radius, they belong to the same cluster. As for the circle radius, it depends directly on the dissimilarity matrix. After executing tests upon all combinations, we concluded that the best value possible is 10% over the maxi-mum value in the matrix. This is a critical value, since if it is too small the result may not return any clusters. On the other hand, if the value is too high, it will return a single cluster with all items, being therefore not representative.
Fig. 4: Closed Swarm patterns found.
The next step involves applying the GetMove algorithm and extracting the moving object patterns. We found 18 closed swarms, 5 convoys, 5 moving clusters and no Group Pattern. Due to space restrictions, we are limited to displaying
RetweetPatterns: detection of spatio-temporal patterns of retweets 9
Fig. 5: Timeline and wordcloud for the Closed Swarm patterns found.
one example here, while the remaining results are available elsewhere8. Figure 4 shows the 18 paths of Closed Swarm found which are composed by 84 retweets. We can see that the majority of paths found are located in Rio de Janeiro and S˜ao Paulo. This reflects the importance of the protests in these cities. The most frequent words are ”protestos” and ”vemprarua” which mean protests and ”come to street” (see Figure 5).
6
Conclusion
The goals of the work are the extraction of spatio-temporal patterns of retweets in various dimensions and create a visual platform to represent and enable the analysis of the information retrieved. The purpose of using di↵erent dimensions was to enable their combination and to validate if the results obtained would successfully return interesting patterns. To accomplish such goals, a data min-ing process was developed combinmin-ing Tweeprofiles and GetMove with di↵erent stages: data preparation, dissimilarity matrices computation, matrices normal-ization and combination, clustering and lastly, application of the GetMove algo-rithm. The visualization tool uses visual patterns associated with all dimensions. Namely a map, a timeline, a social graph and a wordcloud. These widgets allowed the simultaneous representation of information in di↵erent dimensions and to in-teract with them in order to enable a deeper exploration of the results presented. From the results obtained we can argue that the inclusion of TweeProfiles as the clustering stage in the GetMove has been succesfull and that it has improved the quality of results as well as provided greater control over the clustering process. We plan to explore more advanced visualization strategies to enable a deeper usability of our tool and also to propose and implement a proper evaluation strategy.
Acknowledgments. This work was partially supported by projects REAC-TION (Retrieval, Extraction and Aggregation Computing Technology for Inte-grating and Organizing News - UTA-Est/MAI/0006/2009), POPSTAR (Pub-lic Opinion and Sentiment Tracking, Analysis, and Research - PTDC/CPJ-CPO/116888/2010) and Sapo Labs. It was also financed by the ERDF – Eu-ropean Regional Development Fund through the Operational Programme for Competitiveness and Internationalisation - COMPETE 2020 Programme, and by National Funds through the FCT – Funda¸c˜ao para a Ciˆencia e a Tecnologia (Portuguese Foundation for Science and Technology) within project POCI-01-0145-FEDER-006961.
References
1. Boanjak, M., Oliveira, E., Martins, J., Mendes Rodrigues, E., Sarmento, L.: Twit-terEcho: A Distributed Focused Crawler to Support Open Research with Twitter Data. In: Proceedings of the 21st International Conference Companion on World Wide Web. pp. 1233–1240. ACM, New York, NY, USA (2012)
2. Byun, C., Kim, Y., Lee, H., Kim, K.K.: Automated Twitter Data Collecting Tool and Case Study with Rule-based Analysis. In: Proceedings of the 14th International Conference on Information Integration and Web-based Applications and Services. pp. 196–204. IIWAS ’12, ACM, New York, NY, USA (2012)
3. Cunha, T., Soares, C., Mendes Rodrigues, E.: TweeProfiles: dete¸c˜ao de padr˜oes esp´acio-temporais no Twitter (2013), http://hdl.handle.net/10216/68545 4. Cunha, T., Soares, C., Mendes Rodrigues, E.: TweeProfiles: Detection of
Spatio-temporal Patterns on Twitter. In: Advanced Data Mining and Applications, pp. 123–136 (2014)
5. Ester, M., Kriegel, H., Sander, J., Xu, X.: A density-based algorithm for discov-ering clusters in large spatial databases with noise. In Proceedings of the 2nd International Conference on Knowledge Discovery and Data Mining pp. 226–231 (1996)
6. Fitzgerald, B.: SGI Twitter Heat Map: Supercomputer Shows Where Angriest Tweeters Live. http://www.huffingtonpost.com/2012/11/19/ sgi-twitter-heat-map\_n\_2138726.html(2012)
7. Li, Z., Ding, B., Han, J., Kays, R.: Swarm: Mining Relaxed Temporal Moving Object Clusters. Proc. VLDB Endow. 3(1-2), 723–734 (2010)
8. Mentionmapp: Mentionmapp. http://mentionmapp.com/ (2013)
9. Nhat Hai, P., Ienco, D., Poncelet, P., Teisseire, M.: Extracting Trajectories through an Efficient and Unifying Spatio-temporal Pattern Mining System. In: Proceedings of the European Conference on Machine Learning and Principles and Practice of Knowledge Discovery in Databases. pp. 820–823. Lecture Notes in Computer Science (2012)
10. Nhat Hai, P., Poncelet, P., Teisseire, M.: GeT Move: An Efficient and Unifying Spatio-temporal Pattern Mining Algorithm for Moving Objects. In: Hollm´en, J., Klawonn, F., Tucker, A. (eds.) In Proceedings of the Eleventh International Sym-posium on Intelligent Data Analysis, Lecture Notes in Computer Science, vol. 7619, pp. 276–288. Springer Berlin Heidelberg (2012)
11. Richards, J., Lewis, P.: How Twitter was used to spread – and knock down – rumours during the riots. http://www.theguardian.com/uk/2011/dec/07/ how-twitter-spread-rumours-riots(2011)