CONVECTION AND THE DYNAMICS OF
LARGE-SCALE HORIZONTAL FLOW
by
RICHARD DAVID ROSEN
Massachusetts
Massachusetts
Institute
1970
Institute
1970
of Technology
of Technology
SUBMITTED
IN PARTIAL FULFILLMENT
OF THE REQUIREMENTS FOR THE
DEGREE OF DOCTOR OF
PHILOSOPHY
at the
MASSACHUSETTS INSTITUTE OF TECHNOLOGY
September, 1974
Signature of Author ... rn.- n..-.. . .. ....au..s....
Department of Meteorology
July 19,
1974
Certified by
...a
'a ...- 4. 8 X...Thesis Supervisor
Accepted by ... ... ....
Chairman, Departmental Committee
on Graduate Students
- 2
-CONVECTION AND THE DYNAMICS OF
LARGE-SCALE HORIZONTAL FLOW by
Richard David Rosen
Submitted to the Department of Meteorology on July 19, 1974 in partial fulfillment
of the requirements for the degree of Doctor of Philosophy.
ABSTRACT
An observational and statistical approach is taken to investigate certain implications which follow from a simple mathematical consideration of the interaction between
convection and rotation in a fluid body. The mathematical
treatment leads to the suggestion that when convection is present to a proper extent, a large-scale horizontal eddy flux of momentum equatorward is likely to be generated as a result of the rotation's influence on the induced field of convergence. Such a phenomenon, it is advanced, providps a basic explanation for the observed field of differential rotation on the sun, and also perhaps for that on Jupiter.
The maijor part of this study, however, deals with the implications of th,e theory as it might be expected to apply
to terrestrial atmospheric motions in mid-latitudes. The
hypothesis that strong convective activity tends also to be associated with large-scale equatorward fluxes of momentum on the earth is investigated by considering four years of convective season data for a fixed region in the central United States. An index measuring the extent of convective activity is devised based on station reports of thunderstorm occurrence in the region. A measure of the direction of the
large-scale eddy momentum flux over the region is obtained from observations of the trough tilt in the synoptic scale wave patterns which pass through the region at the 500 mb
level.
Enough data has been compiled here to permit meaningful statistical tests to be performed. Results of two such tests
3
-high convective activity
orientation (representat
does exist in the data,
presented suggests.
and troughs with a NW-SE
ve of an equatorward momentum flux)
n accordance with what the theory
An index providi
convergence over the
with the same trough
between instances of
NW-SE is found to exi
significance.
ng a rough estimate
region also is test
tilt
data.
Again,
strong convergence
st, at a high level
of the amount of
ed in conjunction
an
association
and troughs tilting
of statistical
The conclusion is drawn that a tendency does exist in
our atmosphere for outbreaks of strong convective activity
to be related to an orientation in the synoptic scale trough
system which implies an equatorward flux of momentum, at
least for the region of our study.
Thesis Supervisor:
Victor P. Starr
Title:
Professor of Meteorology
4
-TABLE OF CONTENTS
Page
ABSTRACT. . . . a . . . a . . . 2 LIST OF FIGURES . . . . . . . . a . . . 6 LIST OF TABLES. . . . . . . . . . . . . . . . . . . . . 7 1.INTRODUCTION.
. . . . . . . . . a a . . . . . . . .8
Ia.
Background and Statement of Problem . . . . .8
lb. Basic Approach. ... . . a a a a a a a . . I Ic. Outline of the Presentation of Results. . . . 12
2. THEORETICAL CONSIDERATIONS. . . . . . . . . a a a a 15
2a. A Mathematical Treatment.
. a . a . .a . . . 152b. Application of Theory to the
Terrestrial Atmosphere. . a a a a a a . a a . 222c. Some Indirect Observational Evidence
On the Earth . . . . . . . . . . . . . . . . 283. OBSERVATIONAL STUDY
I:
THUNDERSTORM ACTIVITY AS THE PARAMETER OF CONVECTION. . . . . . . . . 303a.
Selection of Data . . . . . . . . . . . . . .30
3b. Further Details Regarding the Data. . .. a .
35
3c. A Statistical Test Relating the Area
g
Number to the Presence of Troughs . . . . . .43
3d.
Tests Relating Convection to Trough Tilt, . a49
4.
OBSERVATIONAL STUDY
II:
AREAL CONVERGENCE
AS A PARAMETER. . . . . a . w a a a a a . . a a a a 624a. An Index of Convergence and
Its Suitability . . . . . . 624b.
Technique for Computing . .a a a a a a a . a66
4c. Statistical Test Results. . a a a a a a a70
4d. A Test Relating the Area 9 Number
And Mc3 Indices . . . a . . a a . a . . . . a 79 5. FINAL COMMENTS. . . . . . . . .a a a a . 83 5a. Summary of Results. . a a . a a a . .83
-5-Page
5b.
Suggestions for Future Research . . . . . . .88
APPENDIX A. LARGE-SCALE VERTICAL FLUXES OF MOMENTUM. .
96
APPENDIX B. DERIVATION OF THE MOMENTUM
BALANCE EQUATIONS. . . . . . . . . . . . . 105ACKNOWLEDGMENTS . . . . . . . . . . . . . . . . . . . . 112
REFERENCES. . . . . .. . . . . . .. . . . . . . . 114
-
6
-LIST OF FIGURES
1. Idealized picture of the proposed effect of
convection on the horizontal motion field.
2. Distribution of upper-air stations used
in the computation of a) . . . . . . . . . .
3. Reynolds' stress values associated with
large-scale vertical eddies for winter at
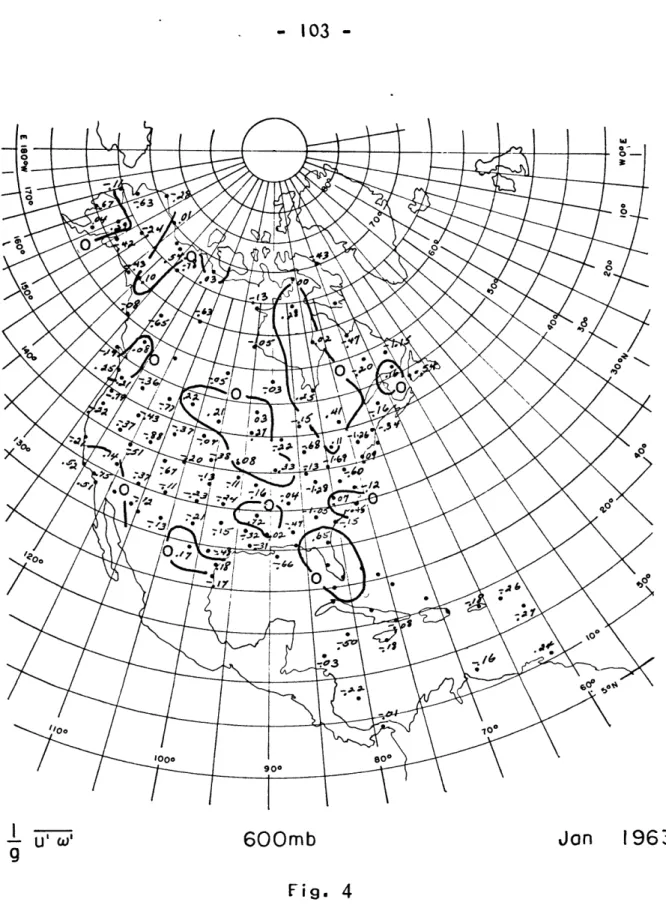
300 mb . . . . . . . . . . . . .4. Reynolds' stress values associated with
large-scale vertical eddies for January 1963
at 600 mb. . . . . . . . . . . . . . . . . . . . . U 25 . . . . 69 . . . . 99 . . . . 103
Page
-
7
-LIST OF TABLES
-Page
1. Contingency tables relating thunderstorm
activity and trough tilt. . . . . . . . .
2. Contingency tables relating contemporary
values of [W3 and trough ti It . . . . . .
3. Contingency tables relating 12-hour lead
values of
fooJ
and trough tiIt
. . . . . .U U U U U
. . . . .
53
75
-8-CHAPTER
I.
-INTRODUCTION
Ia. Background and Statement of Problem
When a comparison is made between the solar and
terrestrial mean fields of differential rotation, it is
observed that the maximum zonally averaged zonal wind lies
at the equator in the former case, but is to be found in
mid-latitudes in the latter instance. Whether this
difference is a consequence of still more basic differences
between the two bodies or is just happenstance is a question
not easily disposed of. The viewpoint held here is that the
solar equatorial acceleration (as it is often referred to)
is a result of eddy heating, and hence eddy motions, arising
from Rayleigh-type convection in a vertically unstable
system. Our planet, of course, represents in the main a
baroclinically unstable system, driven essentially by
pole-to-equator temperature contrasts.
It is suggested that
this, the form of thermal instability predominant in a
system (either vertical or baroclinic), is what may help
determine whether the system possesses an equatorial
-9
-mention also the observation that the planet Jupiter appears
to exhibit an equatorial acceleration,
and it is widely
believed to possess an internal heat source as well (see,
for example, Aumann et. al., 1969).
The main concern of this
connection between convective
the direction in which large-s
angular momentum proceed. The
however, will not be considere
point, primarily because of th
observational data.
The situa
really quite uncertain as to t
processes actually going on in
not surprising that Durney (19
commonly accepted theory of th
simply does not exist at prese
with the difficulties
extra-terrestrial bod
largely on conditions
work will be with showing a
instability in a system and
cale horizontal fluxes of
solar and Jovian systems,
d in much detail as cases in
e lack of sufficient relevant
tion is such that we are
he exact nature of the complex
these bodies.
Indeed, it is
74) is forced to note that a
e sun's differential rotation
nt.
So rather than contend
caused by a lack of data for these
ies, our attention wil
l be focused
here on earth.
Although, as stated earlier, the terrestrial
atmosphere is for the most part subjected to baroclinic
forcing, the interplay between vertical convective activity
- 10
-and the larger-scale
circulation is not entirely an
unimportant process.
so-cal led CISK theory
interplay has been the
Since the
by Charne
subject
particularly as regards motions
has been done, however, concern
vertical convective activity an
in the extra-tropical regions,
recently given evidence of the
the initiation of cyclogenesis.
introduction of the
y and Eliassen (1964), this
of much attention,
in the tropics. Less work
ing the interaction between
d the large-scale circulation
though Tracton (1973) has
importance of convection in
Thus, Tracton's work seems
to show that even in mid-latitudes, convection,
intense enough, can be organized in such a way a
effect on synoptic scale motions.
In light of t
earlier suggestion that vertical convection on t
what gives rise to its equatorial acceleration,
following question:
If there is sufficiently in
extensive convection over a region of the earth,
also an associated equatorward flux of momentum
synoptic scale?
In
'the mean, the mid-latitudes
characterized by such a flux in the troposphere.
does the situation change
important enough so that,
resembles the solar case?
if
st
his
he
we
ten
is
on
are
it
is
o have
ai
and our
sun is
pose the
se and
there
the
not
owever,
when convective processes become
in some loose sense, the earth
It is towards seeking answers to
-
I1
-these questions that the present study is primarily
directed.
lb.
Basic Approach
The hypothesis under consideration then is that there
is an association between the degree of convective activity
over a region of the earth and the direction of momentum
flux in the synoptic scale over the region. When the
convection is intense enough, an equatorward flux is
anticipated. Several approaches to investigating this
hypothesis are possible, but the one chosen here is
observational in nature. However, having decided to rely on
observational data still leaves open any number of possible
ways to proceed. Our task is made complicated by the fact
that other processes besides the one which we are interested
in are going on in the atmosphere simultaneously and may be
acting to obscure the picture. Then too, it is also
possible that an equatorward flux of momentum in
mid-latitudes may sometimes result from processes not
connected with convection, though this is not normally to be
expected, since these latitudes are after all characterized
- 12
-perhaps be looking for is, therefore, a statistical trend in
the data, showing in the long term a tendency for intense
convection and equatorward fluxes to be statistically
related. This is the approach taken here. Thus, statistics
relating to convective activity and to the direction of
momentum flux have been accumulated by the writer for a
lengthy time period over a selected region of the United
States.
Individual synoptic case histories have not been
studied in favor of gathering a large enough data sample to
allow meaningful statistical conclusions to be drawn.
Ic. Outline of the Presentation of Results
The main body of this
matters discussed above.
mathematical argument on
w
a link between convective
acceleration is based. A
inferred from the mathemat
earth is discussed. Some
which may be taken to show
convection and equatorward
mentioned.
thesis is concerned with the
Chapter 2 contains the
hich our contention that there is
activity and an equatorial
simple physical picture may be
ics, and its application to the
evidence already in existence
a relationship between
- 13
-Chapter 3 presents in detail one portion of the
observational study performed. This portion of the study,
following the basic approach discussed in the previous
section, uses thunderstorm statistics as the measure of
convective activity in the region of interest.
The data is
described, and its weaknesses for certain purposes are
pointed out.
The manner in which the data is organized for
statistical testing and the statistical procedures used and
results obtained are discussed.
Chapter 4 describes a second portion of the
observational study, this one employing computations of
vertical velocity to serve as a measure of horizontal
convergence over the region. The technique for calculating
the vertical velocities is reviewed, and statistical tests
similar to those performed in Chapter 3 are made.
Chapter 5 contains a summary of all the results
obtained here concerning the relationship between convection
and large-scale fluxes. Suggestions for future research are
also included.
An appendix to this work is included which makes
further use of the vertical velocities discussed in
- 14
-Chapter 4 to investigate a question 'of some current interest
which, however, is otherwise largely independent of the
study conducted and reported in the main body of this work.
This question deals with the role of large-scale vertical
eddy fluxes of momentum in the general circulation.
No
attempt has been made to link this study with the earlier
one.
Even so, it is felt that the results of Appendix A
are of sufficient interest to warrant their brief
- 15
-CHAPTER 2.
THEORETICAL CONSIDERATIONS
2a.
A Mathematical Treatment
Starting from the dynamical equation governing the
absolute angular momentum of a fluid body, it is possible to
derive a simple system of equations describing the balance
between the square of its zonal average and its variance
along the length of closed latitude circles.
It is this
system of balance equations from which the suggestion made
earlier was inferred, that thermal forcing of the pure eddy
type (perhaps like Rayleigh convection) tends to establish
an equatorial acceleration in a fluid body, through negative
eddy viscous
presented bel
Appendix B.
effects. The equations on a sphere
ow. A derivation by this writer is
~Jf
[d~T=
cWjtlVZIJrl
7-L~P~
T
T -+J~j
V.My
JT
'0(~'fJ17
4T
where the following symbols have been employed:
are
given
in
- 16
-time
density
absolute angular momentum per unit mass =
rLA-where
r
is perpendicular distance to the polar
axis and LL is the absolute linear particle
velocity eastward.
volume
vector velocity
two dimensional, purely frictional, transport
of angular momentum vector lying in the
meridional plane.
pressure
longitude
zonal average around a complete latitude circle.
deviation from zonal average
Any explicit variation of density withX and t
neglected in writing (I) and (2), for t
simplicity. The more general case is g
As pointed out by Starr and Rosen (1972
above system of equations, any number o
which would satisfy it. However, follo
procedure, we will assume that if initi
which favor the growth of a particular
condition of rest and that such a state
according to (1)-(2), then indeed this
to be found dominant in the fluid body
has been
he sake of
iven in Appendix B.
)
in
discussing the
f steady states exi
wing accustomed
al conditions exist
state from a
may become steady
is the state likely
as observed.
We wish to demonstrate that if the thermal
sphere of fluid is such as to make a convective
dominant, then an equatorward flux of momentum
i
st
forcing in a
reg
i
me
s
likely to
t
/19 MT
AV
[()]
-ry
- 17
-ensue. Consider therefore a fluid mass initially in solid
rotation. The solid rotation could of course persist as a
steady state, but we imagine now that an eddy disturbance is
introduced by the appearance of a purely eddy heating and
cooling. Such an eddy component to the thermal field will
9ive rise to non-zero values of().
Such pressure
forces will in turn give rise to non-zero eddy velocities.
If the eddy
the final steady
solid
body rotat
must be positive
motions are now supposed to persist so that
state approached differs from the original
ion, then the pressure force term in (2)
in its effect, bearing in mind that the
friction term
in (2) is undoubtedly
effect.
In other words,
correlation betwee
take place an init
pressure term.
If
scale or otherwise
Coriolis force is
negative correlati
sorting mechanism
selectively toward
there must
n
M'
and
()in
ial building up o
the disturbances
arranged so that
not insignificant
on (N.H.) between
whereby particles
the equator. Su
dissipative in
its
be a negative
order that there should
f the eddy motions by the
are on a large enough
the effect of the
,
then this would imply a
U! and V and hence a
having high momenta move
ch a convergence further
implies a negative value for the conversion term,
- 18
-Jr17oMvdT
,since the convergence is taking place in a
region where[Ml is largest. Thus a balance is achieved
between, on the one hand, the eddy pressure term tending to
build up the eddy motions and, on the other hand, the
conversion and, presumably, the friction terms tending to
limit the eddy growth. The conversion term is also of a
proper sign so that the
[MI
quantity in
(I) is
increased at
the expense off(T'ft
in (2).
The general result, then, is
that of generating an equatorial acceleration of some type
depending upon further particulars. A more complete
picture would no doubt depend also upon the latitudes and
levels at which the eddy heating is introduced and other
such matters.
What the preceding considerations suggest, therefore,
is that an equatorial jet could develop as a consequence of
eddy heating introduced by Rayleigh-type convection arising
from a vertical instability.
It is felt that the arguments
presented in the preceding paragraphs provide a basic
explanation for conditions observed on the sun. Certainly,
however, the picture on the sun is in reality more
complicated than the simple one we have drawn here.
If we
were to consider the solar case in more detail, we would
- 19
-probably want to investigate the properties of an ensemble
of convective cells which range over several scales of
motion and are in different stages of their lifetimes.
Under such circumstances, more care would have to be taken
in simply concluding, as we did earlier, that the sign of
the meridional component of motion
sign of (M
because of Coriolis t
statistical considerations such as
Starr (1973) should be entered into
a positive value for the integral
necessarily implies an equatorward
coefficient of linear correlation b
equivalently
IL'
)
and
(A
along the
latitude circle be denoted by A
,t
coefficient between
V'
and
(
)
by
coefficient between
L41and V' by
C
that a sufficient condition for C t
N.H.,
thus
implyin
A2+
B2>
I
(so
B>0
). Hence,so long as this in
arguments concerni
acceleration will
may simply replace the
urning. Rather,
those discussed by
before deciding whether
MS d
in (2)
momentum flux.
Let the
etween M
(or
length of a complete
he correlation
, and the correlation
.
It can then be shown
o be negative in the
g an equatorward flux of momentum, is that
long as it is still true that
A<O
and
even for a complicated ensemble of cells,
equality remains satisfied, then our
ng the convection and an equatorial
still follow, by and large.
Of course,
p 1
- 20
-for the larger-scales of motion on a rotating fluid system,
we might expectB to be quite large, and the inequality
normally satisfied.
Numerical experiments have been performed by several
investigators attempting to model
maintaining the solar differentia
tend to be somewhat complex, and
of their results is made difficul
Gilman (1972), for example, seems
that convective cells can induce
momentum. However, while equator
rotate faster than the mid-latitu
equatorial deceleration is someti
reason for this is not clear, but
artificiality imposed by boundary
of wave modes to be studied. The
in the model as well, but a major
the role of convection in
I rotation. The models
so a clear interpretation
t. A recent model by
to confirm the possibility
an equatorward flux of
ial regions do generally
des in the model, a local
mes produced as well.
The
it may be related to the
conditions or the choice
re are other deficiencies
problem seems to be the
lack of proper solar data, requiring use of non-dimensional
parameters in the model whose true values are not well
known.
It would seem that the problems involved in
modelling the solar motions numerically are formidable ones.
- 21
-of equations (1)-(2), mention should be made -of what can said concerning a fluid driven primarily by baroclinic forcing. Unfortunately, it seems little can be said, for the system (1)-(2) does not seem to lend itself to easy
interpretation in the case of motions arising initially f a baroclinic type of instability, involving as it does a species of convection due to meridional temperature
be
rom
gradients between the equator and poles. Unlike the
horizontal eddy motions induced by convection, baroclinic wave motions cannot be so simply claimed to be the result of
zonal eddy pressure gradient forces. Therefore, the growth
of an eddy regime from an initial resting state in the case of baroclinic forcing cannot be treated by our simple
system of equations in a manner analogous to that already given. This does not mean that we have shown that an equatorial acceleration cannot result in a purely
baroclinic fluid; merely, the point is that the equations considered here are just not capable of dealing with this case. It is true though that once baroclinic motions have ensued, they are characterized by a field of differential
thermal advection. Such thermal contrasts may induce zonal
eddy pressure gradients as a secondary effect, and this in turn may create a secondary tendency to transport momentum
- 22
-equatorward (perhaps
i
thermal contrasts woul
to be effective in the
for the generation ter
happens we cannot say.
a secondary effect of
equatorward, we reiter
field responsible for
cannot be shown by our
acceleration.
Actuall
our experience is that
characterized by both
momentum fluxes in the
opposition to the basic wave).
of course, have to be strong
The
enough
sense of creating a positive value
m,
-SM'(,)'
4T
,in (2).
Whether thi
However, although it is possible fo
this sort to transport momentum
ate our point that the basic thermal
creating the original baroclinic wave
analysis to induce an equatorial
y, one might suspect otherwise, since
the mid-latitudes of the earth are
baroclinic forcing and poleward
mean.
s
r
2b.
Application of Theory to the Terrestrial Atmosphere
Much of what has been written in the previous section
was initially motivated by a concern to explain conditions
thought to exist on the sun and Jupiter. The interaction
between convection and rotation which (1)-(2) seek to
describe is felt to be the basic mechanism responsible for
the equatorial westerly jets observed on these bodies.
However, as mentioned before, lack of available data for
- 23
-these systems would probably make unambiguous results from further study difficult to come by. For this reason, among others, our attention is now to be shifted away from further consideration of the sun or Jupiter to matters dealing with
terrestrial conditions. By comparison, observations of
terrestrial motions are plentiful. Moreover, of course, we
live here, and so the role of convection in our own atmosphere is of more than academic interest. As was discussed in the Introduction, it is now generally
recognized that convective activity on the earth can be organized in such a way as to have an effect on larger
scales of motion, even in mid-latitudes, mainly through the mechanism of latent heat release. The question we seek to answer here is whether one such effect might be an attempt to induce an equatorward flux of momentum in mid-latitudes.
Our theoretical considerations thus far have supposed a fluid whose prime thermal drive is a vertical instability. This, of course, is not the mean situation to be found in middle latitudes on the earth. However, there are times when convective activity can become quite strong over a
portion of a mid-latitude belt. Now even though strictly
- 24
-considering conditions around complete latitude circles, it is felt that essentially similar conclusions can be drawn when attention is restricted more locally to a segment of a
latitude circle whose central portion is affected by
convection. That is to say, it is our belief that based on the theory developed in the previous section, one might
expect to see an equatorward flux of momentum characterize the region of a mid-latitude belt in which there is
sufficiently intense convective activity occurring, provided that the region influenced by the convection is large
enough.
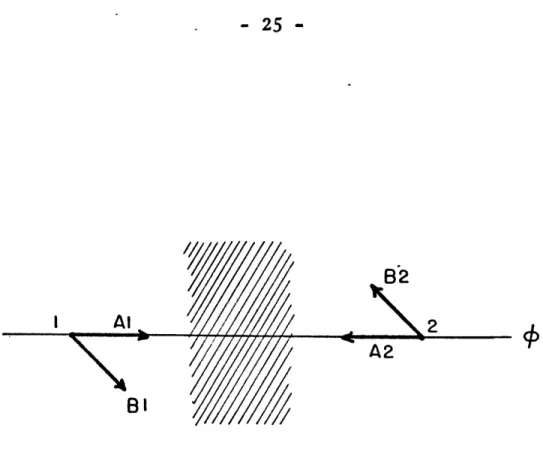
To better visualize the situation, it is possible to construct a very simple physical picture suggested by our
analysis of equations (1)-(2). Fig. I depicts a segment of
a latitude circle drawn for an arbitrary height in the atmosphere, the central portion of which is assumed to be the subject of intense convective activity, as denoted by the shading. Actually,O in the picture can be viewed more
as being representative of a band of latitudes over which the convection is assumed to extend, in line with the
observational studies described in the next two chapters. An eddy component to the thermal field along
#
will result,- 25
-Al
Fig. I
An idealized picture of t the horizontal motion fie representative latitude c the shaded region in the at points I and 2 indicat final flow field is given
he proposed effect of convection on
Id over a portion of a
ircle. Convection, indicated by
figure, induces a pressure gradient
ed by vectors Al and Aa- . The by vectors 0l and 5A.
82
\
2
- 26
-most effectively because of the release of latent heat.
If
the latent heat release is strong enough, and Tracton's work
certainly indicates that this is possible, an eddy pressure
gradient force is created along the latitude circle.
Its
direction at the two chosen points in Fig. I is indicated by
the vectors
Al
and
AZ
,these vectors also giving the
direction in which zonal eddy components of motion begin to
respond to the forcing. Thus, a non-zero value to the
generation term in (2),
-
nT)
,has been created.
If we now assume, however, that the motions are on a
large enough scale to feel the effects of the Coriolis
force, then the actual motions will be deflected toward the
right (N.H.) of the pressure gradient force.
Of course,
some component of flow radially inward will remain to allow
for a release of the convective instability. The vectors
81
and
Ba
indicate the final flow resulting from the
action of the pressure gradient and Coriolis forces.
Assuming that the mean of the components of the velocity
field around the latitude circle vanish, what vectors
B1
and B2 imply is a negative value for the
correlation
fPt']'
and so an equatorward flux of momentum.
It might be noted that if the flow were perfectly
- 27
-geostrophic, so that no component of. inflow existed, there
would be no net momentum flux across
,since the velocity
vectors
B
would now lie perpendicular to the latitude
circle.
This simple picture, following as it does the
mathematical analysis which suggested it, shows the manner
in which a field of convergence, induced by convection,
might be expected to lead to an equatorward flux of momentum
over a region of a rotating fluid system. The same result
holds, by the way, if we had considered a region influenced
by strong divergence. Of course, in our atmosphere many
other complex processes would be occurring at the same time,
and all sorts of interactions might serve to mask the effect
with which we are concerned. Still, it is believed that if
the convective activity is of sufficient magnitude, a
tendency towards developing an equatorward flux of momentum
in the larger scales will make itself shown, in accordance
with the basic physics contained in Fig. I and our
mathematical analysis.
One cautionary note about the figure
though:
if one wishes to consider the effect of a random
ensemble of large convective units on the horizontal motion
field over a whole sphere, such as may be desired in
- 28
-applications to the sun, then simple pictures like Fig. I will no longer suffice, and attention should be returned to equations (1)-(2) for such a case, as discussed in the
previous section. In other words, Fig. I should be
regarded as suggestive of, but not containing entirely, the whole story told by equations (1)-(2). For our present purposes though, the picture contained in Fig. I will be useful to keep in mind.
2c. Some Indirect Observational Evidence on the Earth
There is already in existence some indirect
observational evidence that convection may be associated with an equatorward momentum flux on the earth. An
analysis of southern hemisphere data by Starr and
Rosenstein (1973) shows an equatorward eddy transport of angular momentum in the zonal mean for low levels at all
latitudes in the five-year average. While there is no specific evidence that this low level equatorward
transport is related to convective processes, it seems plausible to suggest that the presence of vast expanses of
relatively warm ocean waters in the southern hemisphere is conducive to the generation of large areas of convective
- 29
-activity.
A similar eddy flux of momentum equatorward at low
levels can also be found in the northern hemisphere, but only on the mean meridional cross-section for the winter months, as shown for example by Starr, Peixoto and Gaut
(1970). Here, there is displayed an equatorward flux in
the zonal average for all latitudes south of
600N,
and again convection could be a factor, since it is observed that large areas of cumulus clouds develop over the oceansdownwind from continents when outbreaks of polar air take place in winter.
Such evidence of course is quite indirect, as has been noted. Still, it is an indication that the process we have envisioned may indeed be operating in our atmosphere. In the next chapter, an observational study is described which seeks to show more directly an association between
convection and equatorward fluxes of momentum in the mid-latitudes of the northern hemisphere.
- 30
-CHAPTER 3.
OBSERVATIONAL STUDY 1
THUNDERSTORM ACTIVITY AS THE PARAMETER OF CONVECTION
3a.
Selection of Data
As previously discussed in the Introduction, the basic
philosophy behind the data studies performed here has been a
desire to accumulate a fairly large sample of observations
on which to base conclusion
from an appreciation of the
the foregoing chapter, whil
might expect to find, is Ii
of the various other proces
which also are occurring in
included in it. In short,
range of interacting proces
picture may be quite compli
looking for easily masked.
that if proper statistics a
between outbreaks of strong
appearance of equatorward f
s. The reason for this stems
fact that the theory outlined in
e highly suggestive of what we
mited in the sense that effects
ses (baroclinic or otherwise)
the atmosphere have not been
our atmosphere exhibits a wide
ses, and in individual cases the
cated and the effect we are
However, it is strongly believed
re gathered, a relationship
convective activity and the
luxes of momentum will be found,
- 31
-even on customary meteorological maps. The use of a large
enough sample of data is required for this purpose, so that
we may ha
Unfortuna
procedure
the detai
hand, the
individua
frought w
chosen wh
initially
it can be
procedure
flow fiel
much woul
ye a measure of confidence in our statistics.
tely, it is true that the use of such bulk
s will involve the loss of much information about
Is of the process being considered.
On the other
accumulation of such details from the study of
I synoptic case histories, for example, would be
ith difficulties, as observed above. We have
at we believe to be the most fruitful way of
proceeding into largely unexplored territory.
If
reasonably demonstrated, through even fairly gros
s, that convection is related to the large-scale
d in the way we have proposed, it is believed this
d represent a substantial accomplishment.
Having decided then to make use of a large data sample
in our investigations, we are further constrained by the
necessity of using data which is easily accessible and
handled. Additional compromises are thus required in order
that a simple nature to the study be maintained.
In this
manner perhaps, a clear, even though limited, interpretation
of our results might be hoped for.
Accordingly, it was felt
- 32
-that attention should be restricted to a fixed region of the
middle latitudes, one which is known to exhibit convective
activity, is fairly well observed, and is not tremendously
influenced by orography.
For these reasons, following the
guide provided by a pilot study into these matters by
Macdonald and Ward (1974), a region of the midwestern
United States was selected. Specifically, the region is the
box bounded by the latitude circles at 45*N and 35*N, and by
the meridians at
97.5*W
and 850W (See Fig. 2).
Now that a choice of fixed region has been made, the
next problem to be confronted is the manner in which fluxes
over the region are to be identified. A difficulty arises
in this matter because less than a complete latitude circle
is being considered, making the definition of horizontal
eddy components of motion somewhat ambiguous.
However,
resort can be made to general considerations of the types of
wave patterns commonly found in our atmosphere and the
momentum fluxes they generally imply.
Longwave troughs in
the N.H. motion field which are oriented basically in a N-S
direction may be considered in a sense to contribute no eddy
flux of momentum to the total amount crossing a latitude
circle, whereas those with a NE-SW orientation contribute a
- 33
-poleward flux and those with a NW-SE orientation, an
equatorward flux.
It was felt, therefore, that an
acceptable method of determining the sense of the direction
in which momentum is being transported over our region
would be to simply identify the type of wave pattern
characterizing the region.
For this purpose, use was made
of a daily series of upper-level weather maps. More details
about this source of data will be provided in the next
section.
In keeping with our desire to study a fairly large
amount of data, it was decided to consider the late spring
and summer seasons for a period of four years. The choice
of season was motivated, of course, by the knowledge that
this is when convective activity is most pronounced in the
selected region. A period of four years was required in
order that there would be enough cases of troughs with a
NW-SE tilt (indicative of equatorward momentum fluxes) to
make our chosen statistical procedures valid. More
precisely, then, the period of our study consists of the
months May, June, July and August for the years 1959
through 1962, a total of 16 months.
It is interesting to
note, by the way, that a cursory examination of the fall and
- 34
-winter seasons for these four years -revealed no more than a handful of cases of troughs with a NW-SE tilt. It appeared however that all these cases were associated with greater than normal convective activity for these seasons. If the
hypothesis under investigation is valid, of course, then this observation should not be very surprising.
The final process that needs to be dealt with in some manner is the convective one. Many parameters for
convective activity are available and would probably be suitable. The one we have selected for use in this first study is an obvious one -- thunderstorm
(R7
)
occurrence. Thus, a gross measure of the thunderstorm activity in our region for each day ofway elaborated upon in that strong convection development, but the o
station does serve as
convenient, measure of particularly when the
desired. In any case,
thunderstorm activity
for convection. In Ii
the period was decided upon, in a the next section. It is recognized can occur without thunderstorm
ccurrence of a thunderstorm near a a generally reliable, and very
intense convective activity,
collection of a great deal of data is for this first study, it is
which has been used as the parameter ght of this choice, and the manner in
- 35
-which equatorward fluxes of momentum over the region are to
be identified, our basic hypothesis may be reformulated
thus:
instances of widespread thunderstorm activity in the
region considered should be most related to the existence of
synoptic scale troughs over the region which have a NW-SE
orientation.
3b.
Further Details Regarding the Data
Data concerning the orientation of troughs passing
through the region was obtained in part from the Daily
Weather Map series published by the United States Weather
Bureau. This series contains once daily (00 Z) maps of
the field of geopotential height observed at the 500 mb
level over the United States. For the year 1959 only, the
Daily Series of Synoptic Weather Maps, Part
I
(Northern
Hemisphere Sea Level and 500 Millibar Charts) are
available to provide similar upper-level maps of better
quality. The procedure followed was to identify from these
map series the type of trough, if any, located over our
selected region for the day of the map. To qualify for
identification, a trough was required to have a wave
- 36
-southernmost portions of a given contour line, greater than
100 in latitude.
If any portion of such a trough was
located over our region on the map for a particular day,
then that day became labeled as a "trough day". No attempt
was made to keep track of troughs on an individual basis.
The single determination regarding the existence of some
trough over our fixed region at the time of the map was the
only information used in making the "trough day"
identification.
Once a trough day has been labeled as such, it then
becomes necessary to characterize the nature of the momentum
flux implied by the wave pattern for that day. Three
categories of wave tilt were recorded:
negative or NW-SE
tilt (equatorward flux), zero or N-S tilt (no net flux),
and positive or NE-SW tilt (poleward flux).
Although there
was a degree of subjectivity involved in deciding into which
category a particular trough might be placed, a rough
criterion was adhered to.
If the trough axis intersected
the relevant meridian at an angle of greater than 100, then
the trough was placed in the appropriate category, negative
or positive. Otherwise, the trough was labeled as having a
zero tilt. For the 16 convective season months in our
- 37
-study, there were 28 negative, 69 zero, and
55
positive
trough days, in all, a total of
152
trough days out of the
complete record of 492 calendar days in the sample.
At this point, perhaps, mention should be made of some
of the shortcomings of the trough data used as they affect
our study. For one thing, the Daily Weather Map series was
produced on a more or less real-time basis, and so not much
error checking was performed in preparing the maps.
Moreover, maps for only the 500 mb level are available, and
while this level is certainly within the limits of the
atmospheric heights likely to be affected by convection,
other levels would possibly show stronger relationships. It
would have been interesting in any event to investigate
other levels, but maps for them are not easily obtained.
Finally, of course, there is the point that the maps are
drawn in terms of the contours of the height field, and not
of the wind field (although some wind data is included on
the maps and these were looked at).
It is, after all, the
wind field which physically is responsible for a momentum
flux.
However, for the scale of motions indicated on the
maps, the tilt given by the height field should be a fair
enough approximation to the tilt in the actual wind field,
-
38
-particularly if only the sign of the.tilt is the desired
quantity, which is the case here. These, then, are some of
the shortcomings in the trough data which we have chosen to
accept, in return for the accessibility the data provides.
It is believed, however, that these, and other deficiencies
in the trough data which may exist are neither very serious
nor very limiting, considering the nature of what we hope
to show.
Within our midwest region, there existed continuously
during the period forty (40) surface observing stations
which reported on thunderstorm occurrence. These reports
have been collected by the National Weather Records Center
in Asheville, N.C. and are part of the information
available on the Local Climatological Data Sheets series.
It was from this series that our thunderstorm data was
collected. Data on thunderstorms is recorded for each
station only on a daily basis in this series.
If at any
time during a day at least one thunderstorm occurs at or
near the observing station, then that day is simply labelled
as a "thunderstorm day". No information as to the hour of
occurrence is reported in this series, nor is it reported if
more than one thunderstorm occurred that day. So again, as
- 39
-the case for -the trough data, we wil.I be using a
somewhat gross measure of conditions.
For each station then, a given date will be labelled as a "thunderstorm day" if at least one thunderstorm occurred
sometime between 12:01 a.m. and midnight local time, without further regard to the intensity of activity. Our
procedure was to then form for a given calendar date the sum of the "thunderstorm day" reports for all the stations in the region. It is this statistic, hereafter to be referred to as the daily "area lI number", which serves as our basic
measure of the convective activity in the region on each day of the period studied. If, for example, on a certain
day twelve of the stations reported that day to be a "thunderstorm day" (i.e., they each reported the
occurrence of at least one thunderstorm near them sometime during the day), then the "area
W
number" for that day is12. If all the observing stations individually reported a
day to be a "thunderstorm day", then the number 40 is used to characterize the thunderstorm activity over the region for that day and is the assigned "area
17
number". At the other extreme, if no station reported the day to be a- 40
-It is recognized that the area
fW
number, as it is
defined here, can only be a rough estimate of the convective
activity in a region.
Nevertheless, this number does
satisfy physical intuition. When it has a relatively large
value, this does correspond to a situation in the region as
a whole which we would tend to think of as deserving the
label "high or widespread convective activity". When its
value is low, then the absence of widespread thunderstorm
activity which that indicates does make the situation a
logical candidate for the label "low convective activity".
It is true that the procedure of defining an area FI
number
means that any effects which may arise from the convection's
being localized on a scale smaller than that of the entire
area itself cannot be studied. However, the use of our area
N
number will enable us to study whether convective
activity on the scale it does measure has an effect on
large-scale momentum fluxes.
For the present, we would be
quite pleased enough were we able to show that such a
connection does exist.
This, then, concludes our more detailed description of
the manner in which the two elements basic to our study,
momentum flux and convective activity, have been measured.
- 41
-To summarize, the former has been obtained from a
consideration of the wave pattern seen to exist over the
region on the 500 mb synoptic map made once each day.
If
no trough is present on the daily map, then the day is so
labelled.
If a trough is present, then its tilt is noted
and the day is labelled appropriately.
Convective activity
has been observed independently, with the area
I?
number
defined earlier obtained as the measure of activity for each
day. We thus have daily time series for both trough tilt
and thunderstorm data over the period, and in a following
section we subject these series to statistical testing to
investigate our main hypothesis that there should be a
connection between negative trough tilts and large values of
the area
I?
number.
One limitation imposed by the data used here and our
method of treating it should be discussed first, however.
The theory delineated in Chapter 2 indicates that a causal
relationship between convection and equatorward momentum
fluxes should exist.
Ideally, we would like to have
obtained data capable of showing such a causal relationship,
but this would not have been a very simple task. The data
we do have, and which has been described here, restricts
- 42
-attention to troughs as they pass through a fixed region, the other history of the troughs being ignored. Under such conditions, an ambiguity in testing the hypothesis that
intense convection should precede a negative tilting trough in time arises from the fact that convection would normally be expected to be found ahead of an advancing trough in space as well. Moreover, the troughs are viewed once a day only, while the thunderstorm data has a 24 hour period of
resolution. Therefore, determining cause-and-effect
relationships on the basis of our data alone is a tricky matter, and we must be careful of what we claim for our
results. Along these lines, it might be mentioned that there does exist the possibility that, once established, a negative tilting trough might produce conditions which are particularly conducive to further convective activity, perhaps because of a favorable advection of its associated
vorticity field. In other words, a feedback mechanism
between convection and negative tilting troughs may exist. The possible existence of such an instability should be explored theoretically, but this is not in the purview of our present study. Certainly though, if such an instability
is operating in the atmosphere, our data lacks the
- 43
-doubt just which element, the convection or the trough tilt, is "causing" the other. In light of all this, therefore, perhaps the best view of what our data is capable of
showing at present is simply that an association between convection and trough tilt does exist, with further details
left unresolved.
3c. A Statistical Test Relating The Area
I?
Number toThe Presence of Troughs
Before proceeding to the testing of our main
hypothesis, it seems reasonable to consider the behavior of our index of convection, the area I? number, as it relates
in general to the presence, or absence, of troughs over the region, leaving the matter of trough tilt momentarily aside. Thus, the question to be explored now is whether convection
is associated more with trough passages than otherwise in our data. Our synoptic experience tells us that for the region considered, we would indeed expect more convective activity when there is a trough in the region than when no trough is present. Therefore, we might expect to find in our data that larger values of the area
I?
number are- 44
-associated with trough days (as we defined these earlier) than with non-trough days, and it is this expectation which we seek to test statistically.
Unfortunately, the matter is not so straightforward.
Two problems exist. First, not surprisingly, the time
series of area
I?
numbers is serially correlated, i.e. thereis persistence in this data. In fact, the autocorrelation
at lag I day has been computed to be 0.347. Reliable
methods for taking this type of dependence in the data into account are not handy. A usual, though rough, procedure is
to simply reduce the number of degrees of freedom assumed
by an appropriate amount. Our second problem deals with the
difference in time spans measured by the thunderstorm and trough data, the former dealing only in quanta of 24 hour periods, the latter viewing conditions at only one time of the day for a fixed region. Under such circumstances, can
it be said, for example, that if there is a high area 9 number on a particular date and that date is not a "trough day", but the next date is, then the convection is not
associated with a trough passage? In other words, given the factors involved, the question of associating convection with the presence of troughs in our data involves some
- 45
-ambiguity. We will take the simplest approach for now
though by allowing an area r? number for a given calendar
date to be associated with a trough if and only if that very
same date is also recorded as a trough day.
Otherwise, the
area
)
number will be placed in the "no trough" sample.
In brief then, the statistical test we have chosen here
involves creating two samples out of our entire data set,
one consisting of trough days (regardless of tilt) and the
other composed of non-trough days.
The area
I
number for
each day will then fall into one or the other of the two
samples, in the manner described at the end of the last
paragraph. The means of the area I? numbers for each
sample may then be computed and compared for the
significance of the difference between them.
Let the mean
of the series of area
?
numbers in the sample consisting of
trough days be denoted by X, , their variance by5
, andthe total number in the sample by Ni
.
Define similarly
S,
,and
N;
to apply to the sample of non-trough
days. One then forms the nul I hypothesis that these two
sample means, X, and X,
,
have been drawn from populations
in which an equality between the means of these sample
- 46
-normally rejected if it can be shown that obtaining the
observed difference in the sample means by chance is less
than 5%.
With the aid of the central limit theorem, it may be
shown that the distribution of
V
S + S2.NS,- N,-/
(3)
is normal, with mean 0
standard deviation
1.
data were independent,
= 9.7
= 7.3
5, = 60.4
S; = 40. I
(under
the null
Now in our case
we have the fol
N = 152
Na = 340
hypothesis) and
assuming that the
owing statistics:
(trough days)
(other days)
Substituting
in the normal
of less than
(4) into (3) gives a value
distribution has a probab
0.1%. We feel justified,
for y = 3.33, which