HAL Id: hal-01436567
https://hal.sorbonne-universite.fr/hal-01436567
Submitted on 16 Jan 2017
HAL is a multi-disciplinary open access
archive for the deposit and dissemination of
sci-entific research documents, whether they are
pub-lished or not. The documents may come from
teaching and research institutions in France or
abroad, or from public or private research centers.
L’archive ouverte pluridisciplinaire HAL, est
destinée au dépôt et à la diffusion de documents
scientifiques de niveau recherche, publiés ou non,
émanant des établissements d’enseignement et de
recherche français ou étrangers, des laboratoires
publics ou privés.
Mesoporous thin film WO 3 photoanode for
photoelectrochemical water splitting: a sol–gel dip
coating approach
Samantha Hilliard, Guido Baldinozzi, Dennis Friedrich, Stéphane Kressman,
Henri Strub, Vincent Artero, Christel Laberty-Robert
To cite this version:
Samantha Hilliard, Guido Baldinozzi, Dennis Friedrich, Stéphane Kressman, Henri Strub, et al..
Mesoporous thin film WO 3 photoanode for photoelectrochemical water splitting: a sol–gel dip
coating approach. Sustainable Energy & Fuels, Royal Society of Chemistry, 2017, 1, pp.145-153
�10.1039/C6SE00001K�. �hal-01436567�
Journal Name
ARTICLE
J. Name., 2013, 00, 1-3 | 1
a.Sorbonne Universités, UPMC Univ Paris 06, CNRS, Collège de France, Laboratoire
de Chimie de la Matière Condensée de Paris, 4 place Jussieu, 75005 Paris.
b.Laboratoire de Chimie et Biologie des Métaux, Université Grenoble Alpes, CNRS,
CEA, 17 rue des Martyrs 38054, Grenoble Cedex 9, France
c.CEA, DEN, DANS, SRMA,LRC CARMEN,LA2M, F-91191 Gif Sur Yvette, France d.Total Energies Nouvelles, La Défense, 24 Cours Michelet 92800 Puteaux, France e.Helmholtz-Zentrum Berlin für Materialien und Energie Gmbh, Institute for Solar
Fuels, Hahn-Meitner-Platz 1, Berlin 14109, Germany
† corresponding author: christel.laberty@upmc.fr
Electronic Supplementary Information (ESI) available: additional Table and Figure, See DOI: 10.1039/x0xx00000x
Mesoporous Thin Film WO
3Photoanode for Photoelectrochemical
Water Splitting: A Sol-Gel Dip Coating Approach
Samantha Hilliard
a,b, Guido Baldinozzi
c, Dennis Friedrich
d, Stéphane Kressman
e,
Henri Strub
e, Vincent Artero
b, and Christel Laberty-Robert
a,†A facile and cost-efficient method to fabricate a mesoporous structured WO3 photoanode was implemented for use in a
tandem dual water splitting photoelectrochemical cell. Semi-transparent thin films of tungsten trioxide were fabricated by sol-gel process, incorporating a block co-polymer to induce a template-directed mesoporous structure. These thin films are deposited by dip coating onto transparent conducting oxide substrates and crystallized at a low temperature of 400°C in air. These thin film photoanodes exhibit a photocurrent of up to 0.6 mA/cm² in potassium phosphate buffers of pH 2, 4, and 6 at 1.23 V vs. RHE under 300 mW/cm² visible (400 – 900 nm) light irradiation with a faradic efficiency of up to 75%. Furthermore, we have demonstrated that corrosion occurs in electrolytes of pH > 4. The faradic efficiencies in varying pH solutions however suggest that parasitic redox reactions occurs in acidic conditions, limiting the O2 production and
demonstrating the need for stable surface co-catalysts to increase faradic efficiencies. In neutral conditions, protective layers and/or co-catalysts are needed for increasing WO3 photoanode stability.
1. Introduction
Due to the increasing demand for energy, the development of renewable fuels is imperative to account for the decrease of fossil fuels which will become scarce in the near future. Hydrogen is a promising energy carrier which could potentially aid in weaning off fossil fuel dependency. An attractive solution is to directly convert solar energy into hydrogen which can be stored and re-used in the chemical (fertilizer production by the Haber-Bosch process) as well as energy industries, transportation, etc. One of the most promising potential approaches to this issue is the concept of water splitting photoelectrochemical cells (PECs) which combines the concepts of photovoltaics and electrolyzers - two types of technologies which are presently well developed, mature technologies. 1-4
One of the challenges of this technology is to find suitable and robust materials for both light harvesting and catalysis of
the oxygen and hydrogen evolution reactions. Metal oxides are encouraging materials due to the fact that they possess photovoltaic effect and are stable in aqueous solutions, which enables them to avoid potential competitive redox reactions associated with degradation and corrosion.5
Tandem PECs combine two photoelectrode materials generally an n-type semiconductor photoanode for the OER and p-type semiconductor for the HER. As most large band bap materials are n-type semiconductors, this designates them as appropriate photoanode candidates. The first discovery of photocatalytic characteristics in metal oxides was reported in 1972 by Fujishima and Honda using rutile TiO2.6 Since then, many metal oxides, notably, α-Fe2O3, WO3,
anatase TiO2, and BiVO4, have been investigated as n-type
photoanode materials for the water oxidation half reaction. These photoanode materials have been additionally coupled with numerous surface co-catalysts to increase their efficiency by decreasing the photocurrent onset/overpotential, increasing faradic efficiencies, and avoiding parasitic reactions and degradation which may compete with water splitting reactions. Typical co-catalysts used for the OER on n-type photoanodes are cobalt phosphate (Co-Pi)7-11, Co
3O412, 13, MnO214, FeOOH15, 16,
NiOOH17, 18, IrO
219, 20, RuO221, RhO213, or Pt.22
Tungsten trioxide has been studied extensively as a n-type photoanode material for water oxidation in photocatalytic
ARTICLE Journal Name
2 | J. Name., 2012, 00, 1-3
systems.23 It was the subsequent material selection
regarding metal oxide materials for water splitting photoanodes following the discovery of TiO2.24 WO3 typically
possesses a band gap of 2.7 eV, slightly smaller than that of anatase TiO2 of 3.2 eV, thus enabling increased absorption of
the solar spectrum (e.g. WO3 can utilize 12% of the solar
spectrum; whereas TiO2 can only harness 4%).25 Despite the
narrow range of light absorption towards the ultraviolet range of the light spectrum, WO3 photoanodes typically
display larger steady state photocurrents than α-Fe2O3
photoanodes due to the higher incident photon to current efficiency (IPCE).26 WO
3 possesses inherently good electron
transport.27 The hole diffusion length in WO
3 is believed to be
150 nm while α-Fe2O3 has a limited hole diffusion length of
only 2 – 4 nm.23, 28 Thus, WO
3 is advantageous compared to
both TiO2 and α-Fe2O3 for solar absorption.
Metal oxides, specifically WO3, can be fabricated using
several techniques: drop-casting28, anodization29-33,
electrodeposition9, 34-36, chemical vapor deposition37, spray
pyrolysis38, magnetron sputtering39, e-beam evaporation40,
doctor blade41-43, and spin-coating.44, 45 Nanostructuration46, 47-49and doping have been shown to increase photocurrents
by augmenting the surface area between the semiconductor and electrolyte, as well as decreasing the distance between the production sites of holes and the interface where they are used to produce oxygen.
This article examines easily fabricated, low cost, thin film, semi-transparent, mesoporous, WO3 as an n-type
photoanode for water splitting application in a dual photosystem device. These WO3 photoactive thin films are
fabricated by an inexpensive, robust, reproductive, sol-gel dip coating technique, which is easily scalable and transferrable to industrial application.
2. EXPERIMENTAL
2.1. Synthesis. Ethanol (99.9% ACS reagent AnalaR
NORMAPUR) and tetrahydrofuran (THF, 99.9% ACS reagent AnalaR NORMAPUR) purchased from VWR. WCl6 (99.9%
trace metal basis), KH2PO4 (≥99.995% TRACESELECT),
K2HPO4 (≥ 99.9% ACS reagent) as well as H3PO4 were
purchased from Sigma Aldrich. Poly(isobutylene-b-ethylene oxide) (#P4793-IbEO or #P4792-IbEO) was purchased from Polymer Source.
4.4 mL of ethanol were mixed with 1.6 mL THF with 100 mg of PIB-b-PEO in a closed vial and then placed in an oven at 70°C until the block co-polymer was dissolved. Finally, 1 g WCl6 was added to the cooled solution containing the polymer (0.28 M final tungsten concentration). An exothermic reaction occurred, evolving chlorine gas which was vented, and the solution is left to stir for at least 1 hour resulting in a turquoise-blue solution. The block co-polymer was omitted in the sol for dense WO3 thin films preparation.
Fluorine doped tin oxide (FTO) transparent conducting oxide substrates (Solems Asahi-100), consisting of 80 nm FTO (approximately 80 Ω/square) on 1.1 mm glass substrates which were rinsed with ethanol before thin layers were
deposited. The hybrid solution was deposited on the FTO substrates by dip coating technique at 2.7 mm/s at low relative humidity (measured with HANNA thermohygrometer HI9564) at room temperature with an annealing treatment at 350°C for 2 – 5 minutes in a ceramic plate oven in air between each layer depositions. In total, each layer deposition measured about 70 nm, and several layers were consecutively dipped to increase the thickness as to increase the light absorption for better performance. In total, 8 layers were deposited by dip coating and final thermal treatment/calcination was effectuated between 400 – 550°C for 30 minutes in a ceramic oven in air.
2.2. Characterization. UV-visible light absorption and
transmission was measured with an Agilent Technologies Cary Series 5000 UV-visible-near infrared spectrometer using a double beam with a background of FTO defined. X-ray diffraction patterns were taken using Bragg-Brentano flat-specimen geometry on all the samples using a high-resolution Bruker D8 diffractometer using CuKα radiation and equipped with a linear position sensitive detector. The diffraction patterns were refined using the Rietveld program Xnd.65 Field emission gun scanning electron microscopy (FEG-SEM) was effectuated using a Hiatchi Oxford x-max beam SU-70 with a 50 mm² tungsten filament at 10 – 15 kV. Material elements were also detected using the Hiatchi Oxford microscope for energy-dispersive X-ray spectroscopy (EDX). High resolution transmission electron microscopy (HR-TEM) was done using a JEOL JEM-2010.
2.3. Photoelectrochemical. Photoelectrochemical
measurements were completed with an AMETEK Solartron Analytical Modulab potentiostat which measured a linear voltage sweep (LVS) of dark and illuminated samples in a 3 electrodes setup. The LVS sweeps were effectuated from 0 V to 1.8 V vs. Ag/AgCl KCl saturated reference electrode (ALS Co. LTD RE-1C referenced 0.197 V vs. NHE) with a platinum wire as a counter electrode using a 10 mV/s scan rate. All current density curves were referenced to the reversible hydrogen electrode (RHE), according to the equation: E vs. RHE = E vs. Ag/AgCl + E0(Ag/AgCl) (0.197) + 0.059 × pH. The
geometric active area of the WO3, which acts as the working
electrode, is defined by Hi-Bond polyamide scotch tape (HB830-19) which measured 0.2 cm² for LVS and 1 cm² for faradic efficiency measurements. Electrical contacts were made by conductive copper scotch (3M Scotch 1245) which was adhered directly to the FTO exposed portion of the photoelectrode. All solutions used were 1 M potassium phosphate buffers in order to compare different pH values (2, 4, and 6) while maintaining the same ionic force and anion composition. The output power of the Xenon lamp was measured using a Newport 1918-R photodiode. Photocurrent density is measured 50 cm away from a 300 W Xenon lamp (Newport Xe ozone free lamp model 6258) working at 280 W equipped with an IR water filter Oriel Liquid Filter 61945 (250 – 950 nm). The Xenon lamp output was 300 mW/cm² for visible light (400 – 900 nm) and 350 mW/cm² for visible and
Journal Name ARTICLE
J. Name., 2013, 00, 1-3 | 3
ultraviolet light. J-V curves were performed either under 300 mW/cm2 (when visible light was considered) or
350 mW/cm2 (when both visible and ultraviolet light were
considered). On the J-V curves, the experimental conditions are reminded.
Stability and faradaic efficiency of the 500 nm mesoporous WO3 film was performed under visible light, i.e.
300 mW/cm2.
550 nmn of mesoporous WO3 under AM1.5G illumination,
back illuminated in 1M H2SO4 (black) and with 1M Na2SO3
(red) 50cm from the lamp (standard) with a Pt counter, Ag/AgCl (KCl saturated) reference using a LVS from -0.2 to 1.8V vs. ref with a step of 10mV and newport 81088A Air Mass Filter, AM 1.5 Global and a Newport (Xe 300W Ozone free) lamp 67001. Visible light measurements were possible using a 400 nm UV filter Oriel UV filter 51272 (cut off 400 nm). A Newport electronic shutter (model 76994) was also used for chopped light measurements with controller (model 76995, combined with a Jeulin very low frequency generator reference 293049).
All electrochemical eexperiments were performed with BACK SIDE illumination, as tests suggest the photoelectrochemical performance is similar for both back and front side illumination – thus in the final dual tandem PEC configuration the photoanode will be illuminated from the back.
2.4. Stability and Faradic measurements. Stability and
faradic measurements were tested in a laboratory fabricated air tight H-cell with a plastic window allowing a 3-electrode setup separated by glass frits. Oxygen in the headspace of the cell was detected with a Perkin Elmer Clarus 580 gas chromatograph TCD at 32°C with nitrogen carrier gas. Oxygen in solution was measured simultaneously with a Unisense Ox-N 13987 Clark electrode calibrated at 40°C (due to increase in solution temperature under illumination during testing) with a two point calibration in air saturated solution and deoxygenated solution.
2.5. Electrocatalyst deposition. Cobalt phosphate was
photoelectrodeposited onto the WO3 in pH 6 using a 0.5 mM
cobalt concentration in 0.1 M potassium phosphate solution. The deposition was completed for 1, 5, or 10 minutes with 300 mW/cm² illumination with platinum mesh counter electrode (2 cm² active area exposed to catalyst deposition – back illuminated). Samples were rinsed with deionized water and dried with compressed air after deposition. 5 minute depositions were found to be the most performant of the varied deposition times and resulting in dispersed cobalt over the WO3 surface.
3. RESULTS AND DISCUSSION 3.1. Structure.
Calcination treatment of the thin films at 400°C resulted in a distorted β-orthorhombic/γ-monoclinic WO3 structure with
crystal orientation preferential to the (1 0 0) plane modeled
from refined diffraction patterns using the orthorhombic β polymorph.50, 51
Fig. 1 XRD Cu Kα pattern of mesoporous WO3 (indicated by
red squares and indexed peaks are labelled in red for the orthorhombic phase, only one peak corresponds to orthorhombic phase, noted ) on glass FTO substrate (triangles).
X-ray diffraction patterns (XRD) suggest the WO3 crystal
system orients orthorhombic along the a-plane and monoclinic in b/c plane shown in Fig.1. Lattice parameters are calculated to be 7.34 Å, 6.89 Å, and 7.65 Å for a, b, and c planes, respectively.
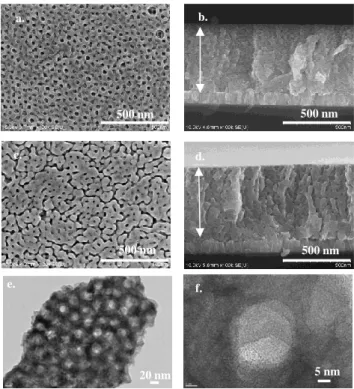
The WO3 film is mesoporous, with an average thickness of
550 nm from 8 consecutive depositions by dip coating and possessing (Fig. 2). The pores have an average of 20 nm diameter size verified by HR-TEM (Fig. 2e, 2f). The film nanostructure is columnar, consisting of needle-shaped crystallites (see Fig. 2b, 2d). The needle cross-sections normal to their axis are randomly oriented in the plane perpendicular to the sample surface, while their a-axis is always well aligned along the direction normal to the sample surface (see Fig. 2b and 2d).
The WO3 thin film is visually transparent with a slight yellow
tint. The absorption and transmission spectra of WO3 are
seen in the UV-visible transmission spectrum in Fig. 3a. The absorption edge of WO3,according to UVvisible absorption
spectra, is found around 430 nm confirming a large band gap. This slight yellow tint indicates a large band gap, allowing shorter wavelengths to 430 nm to pass to the photocathode to be absorbed in an envisioned tandem dual photosystem photocatalytic cell configuration. The band gap of sol gel processed WO3 was estimated from absorption and
transmission data, using Tauc plot representation. A linear fit suggested a value of 2.89 eV (inserted in Fig. 3a).52 Fringes
are seen in the visible and near-infrared portion of the transmittance spectrum and are most likely due to the refraction of WO3 pores and dip coated layers.
ARTICLE Journal Name
4 | J. Name., 2012, 00, 1-3
3.2. Photoelectrochemical Performance.
The photoelectrochemical performance of mesoporous WO3
photoanode has been evaluated in a three electrode cell upon linear sweep voltage in pH 2 – 6 potassium phosphate solutions.
3.2.1. Impact of the nanostructuration.
The impact of the nanostructuration on the photocurrent tested by linear voltage sweeps was measured on 550 nm thick mesoporous and dense thin films of WO3 heat-treated
at 400°C (Fig. 3b). Upon illumination, the onset potential decreases to 0.6 V vs. RHE – a major cathodic shift of 1.7 V comparable to other literature values.49 Visible light response
(400 nm – 950 nm) of WO3 results in a photocurrent of up to
0.55 mA/cm² at 1.23 V vs. RHE with saturated photocurrent of 0.7 mA/cm² reached at 1.5 V vs. RHE under 300 mW/cm² Xenon lamp output power density. The mesoporous WO3
thin film had a larger photocurrent response than the dense one (Fig. 3b). The photocurrent differences indicate that mesostructuration of thin films creates a larger surface area exposure to the electrolyte, increasing the photoelectrochemical performance for water splitting applications. After correction for film thickness, the 0.55 mA/cm² photocurrent value measured at 1.23 V vs. RHE under 100 mW/cm² visible-light illumination (see Fig S1, ESI) is comparable to that reported for another mesoporous WO3
film reported by Yagi and coworkers. 28
Fig. 2 FEGSEM images of WO3 thermally treated at (a)
400°C, (b) corresponding cross section at 400°C, (c) WO3
thermally treated at 500°C and (d) cross section at 500°C,
(e,f) HRTEM images of mesoporous WO3 flakes calcined at
400°C dispersed in ethanol at 50k (e) and 400k magnification (f)
3.2.2. Impact of the heat-treatment.
Thermal treatment of 400°C and 500°C in air was applied to WO3 thin films to understand the impact of temperature on
the photoelectrochemical performance. The layers treated at 500°C exhibited a slightly lesser photocurrent in acidic to neutral conditions than when treated at 400°C (Fig. 3c). This modification is attributed to the change of the porosity network upon thermal treatment at 500°C, as seen on FEGSEM images in Fig. 2 (Fig. 2 b vs. 2d). The electrode/electrolyte interface is probably less developed in 500°C calcined thin films, decreasing the overall performance of the electrode.
3.2.3. Understanding physical limitations of WO3
mesoporous films
Impact of UV light. Upon removal of the ultraviolet optical
filter (cut off 400 nm), the photocurrent of WO3 is greatly
increased due to the absorption of additional UV wavelengths as seen in Fig. 4a. This UV light (360 – 400 nm) addition increases photocurrent from 0.55 mA/cm² to 6.5 mA/cm² at 1.23 V vs. RHE under 350 mW/cm² illumination. This increase upon addition of UV light is in line with IPCE measurements (Fig. 4c). Under AM 1.5 G 100 mW/cm² illumination, the photocurrent value is 0.4 mA/cm² at 1.23 V vs. RHE Fig. 4a. Compared to other state of the art WO3 photoandoes for the OER in a tandem dual
photosystem, the dip coated FTO/WO3 photoanode
performance found in literature reports 2.7mA/cm² for 6µm of WO3 under 100 mW/cm² illumination in pH 0 H2SO4 at
1.4V vs. RHE. Seeing as our WO3 photoelectrodes are 10x less
thick, this suggests that the performances is comparable. The quantum yield or incident photon to current efficiency (IPCE) was measured using a 300 W Xenon lamp calibrated with a total power of 100 mW/cm² output in 1 M H2SO4 (pH 0)
between 300 – 600 nm. IPCE exhibits a maximum of 95% at 310 nm for mesoporous WO3 treated at 400°C as shown in
Fig. 4b. The UV-visible absorption spectra as well as WO3
IPCE responses resemble very much those obtained by other groups.40 Upon calculation of the light penetration depth
from UV-visible absorbance measurements and thickness (shown in supplementary Fig. S2, ESI), it seems that all incident light of wavelengths up to 370 nm are absorbed. Absorption losses start to occur between 370 – 430 nm and efforts should be taken to increase absorption towards this range of the solar spectrum to increase future performance.
20 nm 5 nm e. f. a. b. c. d. 500 nm 500 nm 500 nm 500 nm
Journal Name ARTICLE
J. Name., 2013, 00, 1-3 | 5
Fig.3 (a) UVvisible absorption (black) and transmission (blue) spectra of mesoporous WO3 with interlaced Tauc plot
suggesting band gap of 2.89 eV, (b) Linear voltage sweep of mesoporous (blue) and dense (black) WO3 electrodes in 1 M
potassium phosphate solution under visible light with corresponding FEG-SEM, (c) Linear voltage sweep of mesoporous WO3 thermally treated at 400°C (blue) and
500°C (black) upon visible illumination
Fig. 4 (a) WO3 linear voltage scan in 1 M (pH 6) potassium
phosphate buffer under 300 mW/cm² visible light illumination (blue) and with addition of UV light (350 mW/cm2, red), and under AM1.5 (in green) (b)
Quantum yield of mesoporous WO3 at 1.23 V vs. RHE in 1 M
H2SO4 (pH 0)
To further understand the physical limitations and characteristics of the WO3 mesoporous films, electrochemical
impedance measurements were conducted in 1 M potassium phosphate to measure the flat band potential (EFB) by
Mott-Schottky technique (Fig. S3, ESI). Measurements taken at 1000 Hz with 10 mV amplitude suggest that the EFB of WO3 is
at 0.37 V vs. RHE (shown by dotted line in Fig. S3, ESI). This measured flat band value compared well with thin film WO3
photoanodes.24, 53 This value, compared to the illuminated
onset potential (0.60 vs. RHE) in Fig. 4, indicates an OER overpotential requirement of > 0.2 V for this WO3
photoanode. The difference between the flat band potential and the onset value of photocurrent is related to fast recombination of photogenerated carriers together with slow OER kinetics at the material-electrolyte interface.
The impact of light intensity was then studied to determine whether the reaction is limited by surface kinetic or by
a.
ARTICLE Journal Name
6 | J. Name., 2012, 00, 1-3
photocarrier generation. Upon increasing the light intensity from 100 mW/cm² to 300 mW/cm² a linear trend is observed for the WO3 mesoporous thin films regarding the current
density and light intensity (shown in supplementary information Fig. S2, ESI). Thus, charge carrier generation and/or recombination in the bulk material is a potential rate limiting step in WO3 for the OER.These efficiency limiting
processes are generally observed with large band gap semiconductors.24 The linear response of photocurrent with
light intensity suggest that surface oxidation kinetics do not participate in limiting overall photoelectrochemical performance of mesoporous sol-gel process thin film WO3
photoanodes under these conditions.
Surface limitation. To confirm that surface oxidation kinetics
do not participate in limiting overall photoelectrochemical performance in these mesoporous WO3 photoanode,
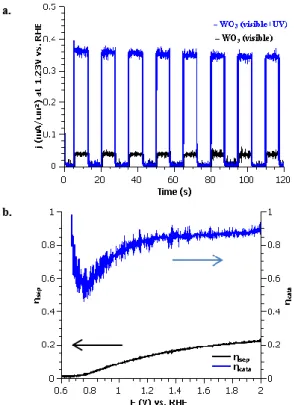
photocurrent was tested with chopped light under chronoamperometric conditions at 1.23 V vs. RHE (Fig. 5a).
Fig. 5 (a) Light response of WO3 under 100 mW/cm² visible
irradiation (black) and upon addition of UV light (blue), (b) Charge separation efficiency (black) and surface catalytic efficiency of WO3 in 1 M potassium phosphate buffer (pH 6)
under 100 mW/cm² illumination using a sacrificial reagent 1 M H2O2
The photocurrent current displays a square response, suggesting the photoresponse to light is rapid, exhibiting no transient photocurrent. This behavior suggests that the surface extraction of holes is more rapid than the arrival charge carriers at the semiconductor liquid junction (SCLJ). Therefore, overall efficiency is limited by material bulk properties.
To better quantify the surface reactivity, a sacrificial reagent (1 M H2O2 or Na2SO3) was added to the electrolyte (Fig. 5b).
Under these conditions, 100% surface catalytic efficiency can be assumed due to the kinetically favoured reactions with the reagent anions compared to the kinetically restrained OER. The method of Dotan, et al. was used to quantify absorption losses under AM1.5G irradiation conditions.54 The
mesoporous WO3 thin films absorb only 55% of the light
considering a band gap of 2.89 eV. This limits the theoretical maximum photocurrent to 2.13 mA/cm² compared to the theoretical maximum of 3.88 mA/cm² (obtained by integration of the AM1.5G spectra assuming no optical or quantum losses for a band gap of 3.89 eV). The photoelectrochemical performance by linear voltage sweeps under AM1.5G illumination using an Oriel AM1.5G filter and a Xenon lamp with an output of 100 mW/cm² display a photocurrent of only 0.34 mA/cm². Upon the addition of the sacrificial reagent, this photocurrent only slightly increased to 0.40 mA/cm² at 1.23 V vs. RHE. Assuming 100% surface catalytic efficiency for the photocurrent with sacrificial reagent, this corresponds to a charge separation efficiency of only 18%. Therefore a surface catalytic efficiency of 85% at water splitting potentials in potassium phosphate buffer was determined (displayed in Fig. 6b).
To confirm that conductivity of WO3 is the limiting factor
in these mesoporous WO3 films, time resolved microwave
conductivity (TRMC) measurements were performed to obtain charge carrier mobility (µ) and lifetime (τ) from the change in the photoconductance of the WO3 mesoporous
thin film (shown in Table S1, ESI and Fig. S4, ESI).55 The
charge carrier diffusion lengths were calculated using the following relationship, 𝐿𝐷= √µ𝑘𝑇𝑒 𝜏, where µ is the mobility (m2V-1s-1), k is the Boltzmann constant, and T is the
temperature (K), e is the electronic charge (C), and 𝜏 is the charge carrier lifetime (sec).These measurements propose a maximum diffusion length of 130 nm in mesoporous WO3,
slightly smaller to the one observed in the literature (150 nm).23 For 550 nm thin films, these diffusion lengths are
enough to extract holes at the SCLJ for the OER. This diffusion length could potentially be increased by doping WO3 thin films or further optimization of the mesoporous
network. Nevertheless, metal oxides are known to be poor absorbers of light and possess poor absorption coefficients.56
WO3 is an indirect band gap semiconductor (necessitating
phonons in addition to photons in order to photogenerate charge carriers). Indirect semiconductors generally require thicker layers for increased light absorption for effective photogenerated charge carrier generation. This is reflected in literature studies concerning WO3 as a photoanode, using
thin film thicknesses of at least 1 µm, which is twice as thick as the mesoporous thin film in this study.30, 32, 57-60 The
absorption spectra, IPCE measurements, and addition of a sacrificial reagent all suggest that there are absorption losses at lower wavelength energies which contribute to the
Journal Name ARTICLE
J. Name., 2013, 00, 1-3 | 7
performance limitation of WO3 as well as the poor
separation efficiency in the bulk material. Thus, optical absorption and internal bulk material conductivity seem to be the main limitations in photoelectrochemical activity in these mesoporous WO3 thin films used for the OER in water
splitting applications.
Stability
WO3 mesoporous films were tested under constant
illumination in potassium phosphate buffer at pH 2, 4, and 6 to further understand aspects which affect OER kinetics as well as stability and faradic efficiency. To test stability under continuous operation, the photocurrent and the faradic efficiency of WO3 photoanodes were measured in potassium
phosphate buffer at pH 2, 4, and 6 at 1.5 V vs. RHE under 350 mW/cm² irradiation for 1 hour with UVvisible light (Fig. 6a and S5, ESI). The corresponding photocurrents are shown in Fig. S5a, ESI. A decrease in photocurrent and faradic efficiency were observed especially at high pH. The WO3
photocurrents decreased slowly overtime in pH 2, 4, and more considerably in pH 6. This decrease in photocurrent and faradic efficiency is directly related to the photo dissolution of WO3 (formation of WO42- anions) in neutral to
basic solutions, as indicated by the Pourbaix diagram for tungsten.35 This corrosion is confirmed by post-mortem
FEGSEM analyses of the photoanodes after 1 hour of measurements (Fig. S6, ESI). Further, Fig. 6a indicates that the corrosion of WO3 only occurs for pH values > 4 under
oxidizing conditions. The low faradaic efficiency observed may be attributed to the formation of peroxo species such as S2O82- at the surface of WO3 photoanode as it has been
highlighted in 61. Additionally, the slight decrease in
photocurrent for WO3 photoanodes in acidic conditions may
be due to blocking of the WO3 surface by peroxo species
typically associated with incomplete O2 production or O2
bubble trapping at the surface of the electrode modifying the interface exposed to the electrolyte. It is thought that formation of O2 is preferred over peroxo species at higher
pH.19c
Impact of the addition of electrocatalyst.
Addition of a co-catalyst on photoelectrodes can potentially ameliorate the water splitting surface kinetics and reduce surface recombination. The impact of the addition of electrocatalyst on the surface of these mesoporous WO3 thin
films was investigated (Fig. 6b). A reported OER electrocatalyst, cobalt phosphate (Co-Pi), was photoelectrodeposited onto the WO3 at pH 6, as it has been
reported to increase the performance of α-Fe2O3.62, 35
According to the deposition conditions described in the experimental section, the quantity of electrocatalyst deposited was about 3% atomic cobalt constitution compared to tungsten onto the mesoporous WO3 thin film
surface after 5 minutes. This was verified by EDX measurements (see Fig. S7, ESI). The linear voltage sweep photoresponse of a successful 5-minute Co-Pi deposition on
mesoporous WO3 compared to bare mesoporous WO3 is
shown in Fig. 6b. The addition of Co-Pi failed to exert a cathodic shift of the onset potential; however, the photocurrent slightly increased compared to bare WO3 near
the OER equilibrium potential.9
Faradic testing in 1 M potassium phosphate (pH 6) has been performed for bare mesoporous and for WO3/Co-Pi. Initially,
the WO3/Co-Pi film had a larger O2 production than bare
WO3 (Fig. 6c), but after time it exhibit faradic efficiency
similar to that of the bare mesoporous WO3. With time, the
mesoporous WO3 thin films decorated with Co-Pi still
corroded overtime. This observation may suggest that Co-Pi detaches from the surface and dissolves in the solution as it has been previously demonstrated in 10, 63, 10, 64, 6566,67,68,69.
4. CONCLUSION
Thin films of WO3 obtained by sol-gel dip coating appear to
be a promising lead as low cost n-photoanode materials for use in acidic water splitting technologies. WO3 photoanodes
for the OER were indeed successfully fabricated by the energy-efficient sol-gel dip coating method, furthermore allowing for a control of the microstructure of the films. Nanostructuration increases the performance. We have shown that the mesoporous films exhibit larger photocurrents than dense layers of WO3, which is attributed
to their larger specific surface area. The performance of our sol-gel dip coated WO3 compared with other reported work.
At AM1.5 conditions, a photocurrent of 0.4 mA/cm² has been measured for roughly 550 – 600 nm thin films mesoporous WO3. The surface, though struggling with peroxo species in
acidic conditions and stability in neutral conditions, is not the rate limiting step for WO3.
Photoelectrochemical measurements performed under various experimental conditions (e.g. pH, cell configuration, co-catalyst addition and stability, etc.) demonstrate that there is a compromise between stability and light-driven OER efficiency. Under acidic conditions, WO3 thin film
photoanodes suffer from poor OER kinetics and an appropriate surface co-catalyst is required to increase the surface kinetics and favour the production of O2 over
parasitic reactions. Though there are not many known OER co-catalysts stable in acidic conditions, further research is needed to lower the overpotential and increase photocurrent values at WO3 photoanodes under such
ARTICLE Journal Name
8 | J. Name., 2012, 00, 1-3
Fig. 6 (a) Faradic efficiencies measured by charge, gas chromatograph, and Clark electrode data from WO3 in 1 M
potassium phosphate of varying pH at 1.5 V vs. RHE under 300 mW/cm² irradiation, (b) Linear voltage sweep of WO3
(black, plain line : light, dash line: dark) and WO3/Co-Pi (blue,
plain line: light; dash line: dark) in 1 M potassium phosphate buffer (pH 6) under visible light (300 mW/cm²) illumination, (c) Experimental moles of O2 measured (solid line) and
theoretical moles (dotted line) of O2 calculated for WO3
(black) and WO3/Co-Pi (blue) thin films in 1 M potassium
phosphate buffer (pH 6) under 300 mW/cm2.
ACKNOWLEDGMENT
Imaging and microanalysis was performed on a SU-70 Hitachi FEG-SEM and a X-Max Oxford EDX detector, instrumentsfacilited by the IMPC (Institut des Matériaux de Paris Centre FR2482) financially supported by the C'Nano projects of the Region Ile-de-France. Time resolved microwave conductivity measurements were completed at
the Helmholtz Zentrum solar fuels department with Dennis Friedrich and Roel Van de Krol. This work was financed by Total Energies Nouvelles and supported by the French National Research Agency (Labex program, ARCANE, ANR-11-LABX-0003-01).
REFERENCES
1. G. Peharz, F. Dimroth and U. Wittstadt,
International Journal of Hydrogen Energy, 2007, 32,
3248-3252.
2. S. Licht, B. Wang, S. Mukerji, T. Soga, M. Umeno and H. Tributsch, International Journal of Hydrogen
Energy, 2001, 26, 653-659.
3. S. A. Bonke, M. Wiechen, D. R. MacFarlane, L. Spiccia and N. R. d. Tacconi, Energy &
Environmental Science, 2015, 8, 2791-2796.
4. J. W. Ager, M. R. Shaner, K. A. Walczak, I. D. Sharp and S. Ardo, Energy & Environmental
Science, 2015, 8, 2811-2824.
5. M. Grätzel, in Nature, Macmillan Magazines Ltd, 2001, vol. 414, pp. 338-344.
6. A. Fujishima and K. Honda, Nature, 1972, 238, 37-38.
7. M. W. Kanan, Y. Surendranath and D. G. Nocera,
Chemical Society Review, 2009, 38, 109-114.
8. S. K. Pilli, T. E. Furtak, L. D. Brown, T. G. Deutsch, J. A. Turner and A. M. Herring, Energy &
Environmental Science, 2011, 4, 5028–5034.
9. J. A. Seabold and K.-S. Choi, Chemistry of
Materials, 2011, 23, 1105-1112.
10. A. Irshad and N. Munichandraiah, Journal of
Physical Chemistry C, 2013, 117, 8001-8008.
11. D. A. Lutterman, Y. Surendranath and D. G. Nocera,
Journal of the American Chemical Society, 2009,
131, 3838-3839.
12. M. Grzelczak, J. Zhang, J. Pfrommer, J. Hartmann, M. Driess, M. Antonietti and X. Wang, ACS
Catalysis, 2013, 3, 383-388.
13. Y. Park, K. J. McDonald and K.-S. Choi, Chemical
Society Review, 2013, 42, 2321--2337.
14. M. Huynh, D. K. Bediako, Y. Liu and D. G. Nocera,
Journal of Physical Chemistry C, 2014.
15. J. A. Seabold, K. Zhu and N. R. Neale, Physical
Chemistry Chemical Physics, 2014, 16, 1121-1131.
16. J. A. Seabold and K.-S. Choi, Journal of the
American Chemical Society, 2012, 134, 2186−2192.
17. L. Trotochaud and S. W. Boettcher, Scripta
Materialia, 2014, 74, 25–32.
18. F. Lin and S. W. Boettcher, Nature Materials, 2013,
13, 81-86.
19. Y. Lee, J. Suntivich, K. J. May, E. E. Perry and Y. Shao-Horn, Journal of Physical Chemistry Letters, 2012, 3, 399–404.
20. M. Yagi, E. Tomita, S. Sakita, T. Kuwabara and K. Nagai, Journal of Physical Chemistry Letters B, 2005, 109, 21489-21491.
21. R. Kötz and S. Stucki, Electrochimica Acta, 1986,
Journal Name ARTICLE
J. Name., 2013, 00, 1-3 | 9
22. S. Trasatti, Electrochimica Acta, 1984, 29, 1503-1512.
23. X. Liu, F. Wang and Q. Wang, Physical Chemistry
Chemical Physics, 2012, 14, 7894–7911.
24. M. A. Butler, Journal of Applied Physics, 1977, 48, 1914-1920.
25. M. S. Prévot and K. Sivula, Journal of Physical
Chemistry C, 2013.
26. B. D. Alexander, P. J. Kulesza, I. Rutkowska, R. Solarska and J. Augustynski, Journal of Materials
Chemistry, 2008, 18, 2298-2303.
27. M. A. Butler, R. D. Nasby and R. K. Quinn, Solid
State Communications, 1976, 19, 1011-1014.
28. D. Chandra, K. Saito, T. Yui and M. Yagi,
Angewandte Chemie, 2013, 52, 1-5.
29. S. Caramori, V. Cristino, L. Meda, A. Tacca, R. Argazzi and C. A. Bignozzi, Energy Procedia, 2012,
22, 127-136.
30. V. Cristino, S. Caramori, R. Argazzi, L. Meda, G. L. Marra and C. A. Bignozzi, Langmuir, 2011, 27, 7276-7284.
31. K. R. Reyes-Gil, C. Wiggenhorn, B. S. Brunschwig and N. S. Lewis, Journal of Physical Chemistry C, 2013, 117, 14947−14957.
32. A. Tacca, L. Meda, G. Marra, A. Savoini, S. Caramori, V. Cristino, C. A. Bignozzi, V. G. Pedro, P. P. Boix, S. Gimenez and J. Bisquert,
ChemPhysChem, 2012, 13, 3025 – 3034.
33. C. A. Bignozzi, S. Caramori, V. Cristino, R. Argazzi, L. Meda and A. Tacca, Chemical Society
Review, 2013, 42, 2228-2246.
34. Q. Mi, A. Zhanaidarova, B. S. Brunschwig, H. B. Gray and N. S. Lewis, Energy & Environmental
Science, 2012, 5, 5694-5699.
35. Q. Mi, R. H. Coridan, B. S. Brunschwig, H. B. Gray and N. S. Lewis, Energy & Environmental Science, 2013.
36. J. C. Hill and K.-S. Choi, Journal of Physical
Chemistry C, 2013, 116, 7612–7620.
37. K. Sivula, F. Le-Formal and M. Grätzel, Chemistry
of Materials, 2009, 21, 2862-2867.
38. A. Enesca, A. Duta and J. Schoonman, Thin Solid
Films, 2007, 515, 6371–6374.
39. A. Stepanovich, K. Sliozberg, W. Schuhmann and A. Ludwig, International Journal of Hydrogen Energy, 2012, 37, 11618-11624.
40. X. Shi, I. Y. Choi, K. Zhang, J. Kwon, D. Y. Kim, J. K. Lee, S. H. Oh, J. K. Kim and J. H. Park, Nature
Communications, 2014, 5.
41. S. Han, J. Li, X. Chen, Y. Huang, C. Liu, Y. Yang and W. Li, International Journal of Hydrogen
Energy, 2012, 37, 16810-16816.
42. M. Yagi, S. Maruyama, K. Sone, K. Nagai and T. Norimatsu, Journal of Solid State Chemistry, 2008,
181, 175-182.
43. P. J. Barczuk, A. Krolikowska, A. Lewera, K. Miecznikowski, R. Solarska and J. Augustynski,
Electrochimica Acta, 2013, 104, 282-288.
44. I. Fujimoto, N. Wang, R. Saito, Y. Miseki, T. Gunji and K. Sayama, International Journal of Hydrogen
Energy, 2013, 39, 2454-2461.
45. H. W. Jeong, T. H. Jeon, J. S. Jang, W. Choi and H. Park, Journal of Physical Chemistry C, 2013, 117, 9104–9112.
46. H. S. H. Sun Shin, Ju Seong Kim, Ik Jae Park, Myeong Hwan Lee, Kug Sun Honga and In Sun Cho, J. Mater. Chem. A, 2015, 3, 2920-12926. 47. D. F. R. Torsten Brezesinski, Sébastien Sallard,
Markus Antonietti, Bernd M. Smarsly Small, 2006,
2, 1203–1211.
48. C. W. Karla R. Reyes-Gil, Bruce S. Brunschwig, Nathan S. Lewis, J. Phys. Chem. C, 2013, 117, 14947–14957.
49. Y. Z. Bin Yang , Elizabeth Drabarek , Piers R. F. Barnes , and Vittorio Luca Chem. Mater., 2007, 19, 5664–5672.
50. B. O. Loopstra and H. M. Rietveld, Acta
Crystallographica, 1969, B25, 1420-1421
51. E. Salje, Acta Crystallographica, 1977, B33, 574-577
52. J. I. Pankove, Optical Processes in Semiconductors, Dover Publications, New York, 1971.
53. S. J. Hong, S. Lee, J. S. Jang and J. S. Lee, Energy &
Environmental Science, 2011, 4, 1781-1787.
54. H. Dotan, K. Sivula, M. Grätzel, A. Rothschild and S. C. Warren, Energy & Environmental Science, 2011, 4, 958-964
55. F. F. Abdi, T. J. Savenije, M. M. May, B. Dam and R. van de Krol, Journal of Physical Chemistry
Letters, 2013, 4, 2752−2757.
56. M. Woodhouse and B. A. Parkinson, Chemical
Society Review, 2009, 38, 197-210.
57. B. Marsen, E. L. Miller, D. Paluselli and R. E. Rocheleau, International Journal of Hydrogen
Energy, 2007, 32, 3110-3115.
58. W. Li, J. Li, X. Wang, J. Ma and Q. Chen,
International Journal of Hydrogen Energy, 2010, 35,
13137-13145.
59. J. K. Kim, K. Shin, S. M. Cho, T.-W. Lee and J. H. Park, Energy & Environmental Science, 2011, 4, 1465–1470.
60. F. Amano, M. Tian, G. Wu, B. Ohtani and A. Chen,
ACS Applied Materials & Interfaces, 2011, 3, 4047–
4052.
61. N. W. Kojiro Fuku, Yugo Miseki, Takashi Funaki, Kazuhira Sayama, Chemsuschem, 2015, 8, 1593-1600.
62. W. Hamd, S. Cobo, J. Fize, G. Baldinozzi, W. Schwartz, M. Reymermier, A. Pereira, M. Fontecave, V. Artero, C. Laberty-Robert and SanchezClement, Physical Chemistry Chemical
Physics, 2012, 14, 13224-13232.
63. P. Bornoz, F. F. Abdi, S. D. Tilley, B. Dam, R. van de Krol, M. Graetzel and K. Sivula, Journal of
Physical Chemistry C, 2014, 118, 16959–16966.
64. D. R. Gamelin, in Nature Chemistry, 2012, vol. 4, pp. 965-967.
ARTICLE Journal Name
10 | J. Name., 2012, 00, 1-3
65. P. I. M. L. G. Bloor, M. D. Symes, L. Cronin, J. Am.
Chem. Soc. , 2014, 136, 3304-3311.
66. S. G. B. Klahr, F. Fabregat-Santiago, T. Hamann, J. Bisquert, J. Am. Chem. Soc. , 2012, 134, 4294-4302. 67. D. K. Zhong, M. Cornuz, K. Sivula, M. Grätzel and
D. R. Gamelin, Energy & Environmental Science, 2011, 4, 1759-1764.
68. F. A. L. M. R. Nellist, F. Lin, T. J. Mills, S. W. Boettcher, Acc. Chem. Res., 2016.
69. D. H. W. Li, S. W. Sheehan, Y. He, J. E. Thorne, X. Yao, G. W. Brudvig, D. Wang, , Energy Environ.
Sci. , 2016, 9, 1794-1802.