Application of Statistical Quality Control to Improve Yields and
Rationalize Testing in a Low Volume Manufacturing Facility
by
David Charles Knudsen
Bachelor of Science in Civil and Environmental Engineering, Stanford University, 1994 Bachelor of Arts in Economics, Stanford University, 1994
Submitted to the Sloan School of Management and the Department of Civil and Environmental Engineering in Partial Fulfillment of the Requirements for the Degrees of
Master of Science in Management and
Master of Science in Civil and Environmental Engineering BARKER in conjunction with the MASSAHUETTS1NS ITU-h Leaders for Manufacturing Program OF TECHNOLOGY
at the
Massachusetts Institute of Technology
JUL
0 92001
June 2001 1F
-LIBRARIES
© 2001 Massachusetts Institute of Technology. All rights reserved.Signature of Author
Sloan School of Management
5 May 2001 Certified by
RO Welsch, Thesis Advisor Professor of Statistics and Management Science Sloan School of Management Certified by
KevinAar atiga, Thesis Advisor Rockwell International Career Development Assist nt Professor Department..0"l agd4-Environmen1 Engineering
Approved by_________ ___________________
Oratuyukozturk, dla5irman" of Committee,4 Graduate Studies Denartment of Civil and Environmental Engineering Approved by
Margaret t. Anorews, txecutive Director Master's Program Sloan School of Management
Application of Statistical Quality Control to Improve Yields and
Rationalize Testing in a Low Volume Manufacturing Facility
by
David Charles Knudsen
Submitted to the Sloan School of Management and the Department of Civil and Environmental Engineering on May 5, 2001 in Partial Fulfillment of the Requirements for the Degrees of Master of Science in Management and Master of Science in Civil and
Environmental Engineering
Abstract
Qualcomm's Wireless Business Solutions group manufacturers two-way satellite communications systems for the commercial trucking industry at its facilities in San Diego. The testing process for this family of products, called OmniTRACS, is sub-optimal. First-pass yields for the entire test process average 60%, but most of the failed units pass upon retest. Tens of thousands of dollars are wasted each year on additional testing and debug efforts for these units that are ultimately shipped without any rework. This thesis describes the efforts of a yield improvement team chartered to increase first-pass yields dramatically throughout the test process.
The yield improvement team utilized statistical control charts and Gage Repeatability and Reliability studies to better understand the nature of process failures at the final test step and the capability of the test process itself. This knowledge enabled the team to eliminate non-value added tests and increase some arbitrary specification limits. Yields at the final test step increased from 88% to 97%, generating a projected annual savings of more than
$45,000.
Increased visibility of process performance at the final test step was a necessary prerequisite to the process change, so the team developed a decision support tool that enables continuous monitoring of process performance at any test step in the OmniTRACS manufacturing process. The tool should enable future process improvements at other test steps by providing the statistical data necessary to guide process changes.
Thesis Supervisor: Roy Welsch
Professor of Statistics and Management Science Sloan School of Management
Thesis Supervisor: Kevin Amaratunga
Rockwell International Career Development Assistant Professor Department of Civil and Environmental Engineering
Acknowledgements
I wish to acknowledge the faculty and staff of the Leaders for Manufacturing Program for its support of this work and for the outstanding education it has offered me.
The project would not have gotten off of the ground but for the efforts of Alison McCaffree. Thank you for providing so much support both before and during my
internship.
Qualcomm offered me everything I could have hoped for in an internship. John Lloyd and the quality team accepted me as a colleague and supported me in every aspect of the project. Tom Rainwater and the Test Engineering organization were instrumental to the success of the project. The yield improvement team's willingness to explore new ideas and challenge the status quo was exciting and rewarding. Thank you.
My advisors, Roy Welsch and Kevin Amaratunga, provided me insight and support as I worked through the challenges of the project. Thank you for your time and effort.
My LFM classmates are a fantastic group of men and women. I have learned more from them than from any other aspect of the LFM program. Thanks for a great two years.
Finally, thanks to my wife for enduring a difficult time in San Diego. The challenges of work and school are insignificant compared to the challenges of life, but your support over the last two years of me and my work never wavered.
Table of Contents
Abstract...3
1.0 INTRODU CTION ... 11
1.1 Project Description ... 11
1.2 Project Approach and M ethodology... 12
2.0 PROJECT SETTING AND BACKGROUND ... 15
2.1 Company Background, Position, and Outlook ... 15
2.2 Organizational Skills ... 16
2.3 Inform ation Technology ... 17
3.0 THE OM NI TEST PROCESS... 19
3.1 Satellite Com munications Overview ... 19
3.2 Product Overview ... 20
3.3 M anufacturing Flow and Test Description ... 20
3.3.1 Centerplate Functional ... 21
3.3.2 V ibe ... 22
3.3.3 Environm ental... 22
3.3.4 Burn-in ... 22
3.3.5 Acceptance Test Procedure ... 23
4.0 Improving How Existing Tests Are Performed... 24
4.1 Yield Improvem ent Team ... 24
4.2 Characterizing the Current State of the Process... 25
4.2.1 Pareto D iagram s of Failure M odes ... 26
4.2.2 Understanding Process Capability at ATP ... 27
4.2.3 Gage Repeatability and Reliability Study on ATP ... 30
4.3 Changes Implem ented ... 32
4.4 Monitoring Process Performance Over Time - Run Charts and Control Charts. 33 4.5 Test Alarm Response Team ... 36
4.6 Results ... 38
5.0 Software Tools to Support Continuous Process Monitoring ... 40
5.1 Initial State of IT Tools ... 40
5.1.1 Shop Floor Control ... 40
5.1.2 QualityLink... 41
5.1.3 Com m on Test Software (CTS)... 42
5.2 Om ni SPC A nalysis D atabase... 42
5.2.1 Selecting a Development Environment... 43
5.2.2 Key Design Features ... 44
5.2.3 Resulting Application... 48
5.3 Recom mended IT Vision ... 50
6.0 Organizational Observations... 52
6.1 Three Lenses Analysis... 52
6.1.1 Project Setting... 52
6.1.2 Strategic Design Lens ... 54
6.1 .3 Political Lens ... 57
6.1.4 Cultural Lens ... 61
6.1.5 Putting the 3 Lenses Together ... 63
6.2.1 Kotter's Eight Steps ... 65
6.2.2 The Yield Improvement Team - Internal Process Assessment...66
6.3 Evaluation and Recommendations ... 67
7.0 Summary ... 69
R eferences...7 1 Appendix 1 Estimating Expected Process Fallout For a Given Cpk ... 72
List of Figures
Figure 1 Satellite Communications Overview... 19
Figure 2 OmniTRACS Product Overview...20
Figure 3 OmniTRACS Test Process Flow ... 21
Figure 4 Weekly Yield Summary Report ... 26
Figure 5 ATP Failure Mode Pareto...26
Figure 6 ATP CND Failure Pareto...27
Figure 7 ATP Process Capability for Signal-to-noise Ratios ... 29
Figure 8 Gage R&R Data Collection Sheet... 31
Figure 9 CND Reduction Due to Expanded ATP Limits...33
Figure 10 A utocorrelation Chart ... 35
Figure 11 Pre-Change ATP Failure Pareto...38
Figure 12 Post-Change ATP Failure Pareto ... 39
Figure 13 IT Environment Supporting the OmniTRACS Process...40
Figure 14 OmniSPC Analysis Table Structure ... 46
Figure 15 Subgroup Average Run Chart Example ... 49
Figure 16 Nominal Subgroup Average Run Chart Example ... 50
Figure 17 Recommended IT Environment ... 51
Figure 18 QWBS Organizational Design... 54
Figure 19 Stakeholder D iagram ... 59
List of Tables T able I C N D R ate by Test Step...24
Table 2 ATP Gage R&R Results ... 31
Table 3 Omni SPC Analysis Database Design Alternative Ranking ... 44
Table 4 Stakeholder Interests... 58
1.0
INTRODUCTION
The testing process for OmniTRACS Antenna Communications Units (ACU's) at Qualcomm's manufacturing facility in San Diego was sub-optimal. First-pass yields for the entire test process averaged 60%, but most of the failed units pass upon retest. Tens of thousands of dollars were wasted each year on additional testing and debug efforts for these units that were ultimately shipped without any rework.
Statistical Process Control (SPC) has been used effectively in the manufacturing industry to improve quality and reduce costs. But SPC is not a silver bullet. It is not a tool that you buy off the shelf, turn on, and magically generate improvement in your manufacturing process. Rather, implementing SPC is a process of discovery and experimentation. It requires the proper resources, including tools and training, to be used effectively within an organization.
This thesis describes the effort undertaken by a process improvement team within Qualcomm's Wireless Business Solutions (QWBS) division to begin using statistical process control tools to improve manufacturing yields. Over a period of six months, the team was able to improve yields from 88% to 97% at the final test step in the process, resulting in an annual savings of approximately $45,000. The knowledge the team gained through the effort and the tools it developed to support the change should enable future improvements, as well.
1.1 Project Description
QWBS management recognized the need to improve its test procedures in order to increase factory yields and reduce manufacturing costs. An internship proposal was submitted to the Leaders for Manufacturing Program that contained three related, yet distinct potential projects:
1. Reduce/eliminate non-value added testing
* Use statistical analysis to predict field performance of units based on factory parametric test results.
* Conduct experiments by shipping units that have not undergone specific tests and measure performance relative to the general population.
2. Correlate factory parametric test data, factory Can Not Duplicate (CND) rates, and Return Material Authorization (RMA) rates
3. Create an on-line SPC system for displaying real-time statistical analysis
1.2 Project Approach and Methodology
The efforts to improve yields and increase factory efficiency were focused on two parallel paths:
1. How the product is tested (process capability, tester capability).
2. What product attributes are tested (Are the right attributes being tested? Is there any correlation between factory test results and field performance?)
Following is a more detailed description of each path.
How the Product is Tested
The first step of the internship was to characterize the current test process from a statistical standpoint. I analyzed historical test results to understand the central tendency and variation of each test attribute on each test station. I then compared the results to specification limits to understand process capability. I also helped design and perform Gage Repeatability and Reliability (Gage R&R) tests to determine the measurement capability of key test equipment.
Once I understood the capability of the test process, I combined this knowledge with historical test failure data to help explain the high rate of Can Not Duplicate (CND's) seen in the product testing. This allowed the group to focus on improving and/or eliminating the most problematic tests from the process, with the goal of reducing the wasted effort of retesting and debugging "good" units.
Correlate Factory Test Results with Field Performance and Returned Units
The ultimate goal of product testing in the factory is to improve the quality of units in the field. Many tests were developed over time to simulate in the factory the products'
operational environment, but there were no data indicating whether the unit performance in factory tests correlated in any way with unit performance in the field. The goal of this effort was to collect and analyze field performance data to help make the determination whether the current suite of factory tests are useful indicators of field quality.
A wealth of over-the-air field performance data is collected at Qualcomm's Network Management Centers (NMC's) in San Diego and Las Vegas. All messages sent to and received by the OmniTRACS units in the field are routed through one of the two NMC's, and performance metrics are available for each transmission. However, utilizing this data proved more difficult than anticipated. The data is spread across thousands of text files, making it difficult to aggregate for analysis. Qualcomm also has a policy in effect and contractual agreements with its customers that address how long data may be store by Qualcomm.
An NMC operator developed a batch routine to pull the desired data from the different text files, but the process was not completed until the end of the internship. We were therefore unable to collect enough data to perform a meaningful analysis.
Developing a Software Tool to Support Process Analysis
In addition to a set of analyses and recommendations, a further goal of the internship was to develop a set of software tools to enable future analysis and monitoring of the health of the manufacturing process. The organization had no clear vision of what the tool should look like or the capabilities it should possess. So I worked on my own to recognize the latent requirements for statistical data within the organization and then to develop a tool that would address those needs.
Yield Improvement Team
A cross-organizational and cross-functional Yield Improvement Team had been created prior to the internship to drive improvements in the OmniTRACS test process. The internship was proposed in part to provide the team a dedicated resource to collect and analyze test data and to introduce the team to statistical process control concepts and
practices. All decisions regarding resource allocation and process changes associated with the project were made by the team.
2.0 PROJECT SETTING AND BACKGROUND 2.1 Company Background, Position, and Outlook
Qualcomm's Wireless Business Systems (QWBS) is a division of Qualcomm, Incorporated that manufactures two-way satellite communications systems for the commercial trucking industry. QWBS is the largest player in the market with more than 350,000 OmniTRACS units in the field. More than 1,200 U.S. fleets utilize OmniTRACS, including 37 of the top 40 truckload fleets in the country. QWBS also has a strong presence in Mexico, Brazil, Argentina, Canada and Europe, and it is actively trying to penetrate the potentially vast Chinese market.
Despite its strong position in the market, QWBS has set an aggressive growth target known as the 2 x 4 plan: to double both revenue and profitability in four years. But a softening of the commercial trucking market and increased competition have amplified the cost pressures on QWBS. Historically, reductions in product cost were achieved through material price reductions from suppliers. However, suppliers can only be squeezed so far, and additional cost reductions need to be generated through improvements in manufacturing efficiency in order to meet the 2 x 4 plan.
QWBS competes in its market primarily based on quality and technology. It offers customers immediate replacement of units that fail in the field; sometimes new units are shipped to customers before the failed units are received.
As a result, an attitude exists within the division that no product should ship without complete confidence in its ability to perform. Unfortunately, the product was designed more than ten years ago, and many aspects of the design have very little margin. Quality has become an attribute that is tested into the product, as opposed to being designed into the product.
A potential conflict between product quality and manufacturing efficiency was thus exposed, as efforts to reduce test times and improve test effectiveness became more
critical. Two camps developed. One argued that the test process was inefficient and used historical data on failure modes to show the wastefulness of some test steps (the primary failure mode was CND). The other camp replied that low product return rates showed that the test process was effective, and that any efforts to experiment with changes to the test process risked alienating the customer base. No progress was made because no proposals were developed that addressed the needs of both groups.
But there was incentive to change. Coincident with the push to improve manufacturing efficiencies in QWBS's San Diego facility was a move toward outsourcing newer products to contract manufacturers in Mexico. There were no stated plans to ultimately outsource the Omni product, but employees in the San Diego facility recognized that future potential. This added to the support for change.
2.2 Organizational Skills
The two key groups involved in the project, the Quality group and the Test Engineering group, had completely different sets of skills. The Quality group consisted primarily of mechanical engineers, some of whom were familiar with the general concepts of statistics. But they used their knowledge to monitor and improve the process only on an ad-hoc basis. One engineer analyzed process data every two to three months to understand the process capability. Another engineer developed a set of Gage R & R experiments to understand the measurement capabilities of some new test equipment. The engineers spent most of their time fighting fires, and the engineers who understood statistics used their knowledge to help them fight fires more effectively.
The Test Engineering group consisted primarily of software programmers. They developed the hardware and software used to test the products. According to the group manager, the group lacked even basic knowledge of statistics and the concept of variability.
2.3 Information Technology
QWBS utilized a variety of software applications to run its manufacturing operation. Production control was managed through a home grown system called Shop Floor Contro (SFC), which is based on an unsupported version of an Oracle database. The organization was evaluating options for upgrading the system, which included upgrading to Peoplesoft, upgrading to a supported Oracle database, or continuing to support the existing database. Development on the platform had been restricted to maintenance until a decision on the future of the application was made.
Finished goods inventory, customer shipments, and product returns data were maintained on a Peoplesoft database. There was no automated interface between Shop Floor Control (SFC) and Peoplesoft.
Parametric test results were stored in a Microsoft Access database called QualityLink. Each tester generated text files containing the results of the most recent test. A routine ran continuously that pulled those text files into an Access database where they could be analyzed off-line. There were no interfaces between QualityLink and SFC, nor between
QualityLink and Peoplesoft.
This led to some inconsistencies in reports used to evaluate quality metrics. Quality data in SFC were entered manually by operators on the floor at the conclusion of each test. Error codes were selected from dropdown boxes, but there was no safeguard against the selection of an incorrect code. Yield reports were generally generated from SFC. Quality data in QualityLink were generated automatically by the test software, so it was generally guaranteed to be accurate. However, the part number of the unit under test was manually input by the operator before each test, and there were no safeguards against the input of an incorrect part number. Part numbers were input before each successive test, so it was possible to have the part number of a unit change from one test to the next. QualityLink data was used primarily for ad-hoc analysis. Canned quality reports using QualityLink data had not been developed.
I believed it feasible to develop new functionality for the QualityLink system. The database was managed by an engineer in the Test Engineering organization, and he was willing to grant me administrative access to the database.
Development of a new suite of software (called Common Test Software, or CTS) to manage the test systems was almost complete when I arrived. Since it was still under development, I could have focused my efforts on adding a statistical process control module to the system. However, implementation of CTS was scheduled on only the new product lines QWBS was developing. Converting the existing OmniTRACS test process code to CTS would basically require a complete rewrite (a significant effort on the behalf of the Test Engineering group) and the possibility that OmniTRACS manufacturing could be outsourced within two years led QWBS management to de-prioritize the investment. Since virtually 100% of manufacturing's volume consisted of OmniTRACS products, it didn't make sense to pursue CTS.
3.0 THE OMNI TEST PROCESS
3.1 Satellite Communications Overview
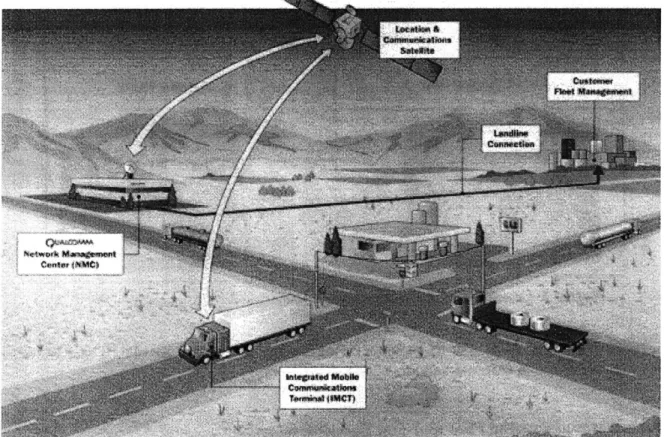
The OmniTRACS product provides two-way satellite communications for the commercial trucking industry. As shown pictorially in Figure 1, Integrated Mobile Communications Terminals located on trucks communicate with a Network Management Center (NMC) run by Qualcomm through a system of satellites. The NMC communicates with the trucks' fleet management office through whatever medium the customer requests (Internet, phone line, etc.). Services include text messaging, position tracking (akin to GPS), and integration capability with other applications, such as route planning, dispatch and accounting. Additional hardware options allow the customer to track trailers and to monitor driver and vehicle performance (mpg average, overrev and overidle data). Unlike most cellular-based systems, nationwide coverage is seamless.
3.2 Product Overview
QWBS manufactures several products at its San Diego facility. Its most mature product, the OmniTRACS, comprises most of the plant's volume and was the focus of the yield improvement efforts.
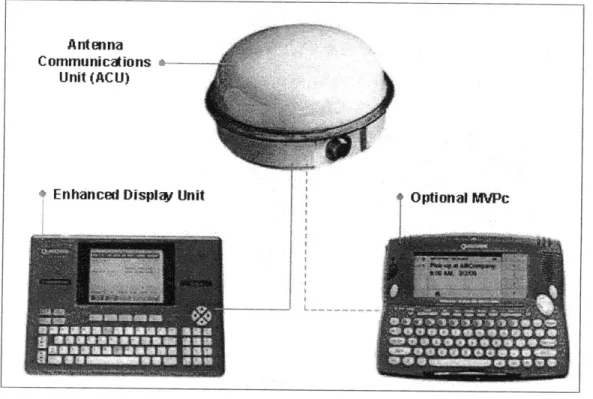
The OmniTRACS product consists of two separate units, as seen below in Figure 2. The Antenna Communications Unit (ACU) sits atop the truck cab and communicates with the satellite. The display unit (DU), or enhanced display unit (EDU), sits inside the cab and allows the driver to send and view messages.
Figure 2 OmniTRACS Product Overview
QWBS assembles ACU's in its manufacturing facility in San Diego. DU's and EDU's are sourced from an external vendor.
3.3 Manufacturing Flow and Test Description
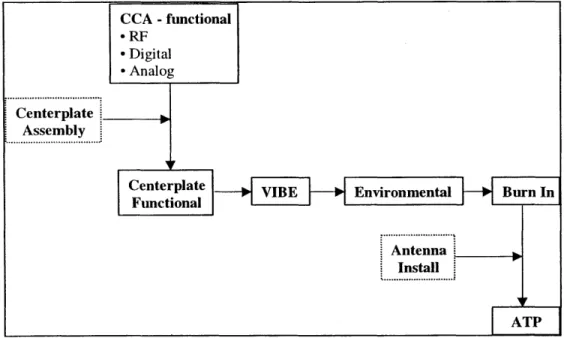
The ACU manufacturing process consists of about 20 minutes of assembly and 20 hours of testing. Figure 3 shows the flow of the assembly and test operations. Three different types of circuit cards - analog, digital, and RF - each go through a functional test before
Antenna
Communicaions
k--Unit (ACU)
?Enhanced Display Unit Optional MVPc
4-sw--assembly into the "dog bowl," or the metal housing of the ACU that then becomes the centerplate. Once the three cards and a power supply are installed, the unit goes through a functional test called Centerplate Functional. The centerplate is then tested on a vibration table at the Vibe station. Next, the centerplate is tested at +700C and -30 0C at the Environmental test. The unit is then subjected to an eight-hour burn-in process, during which it is tested multiple times. After burn-in, an antenna is installed and then the unit is tested over the air at the final test step, Acceptance Test Procedure (ATP).
CCA -functional -RF - Digital " Analog Centerplate Assembly
Centerplate VIBE Enironmenta Burn In
Functional
Antenna Install
ATP
Figure 3 OmniTRACS Test Process Flow
Following is a more detailed description of each test step.
3.3.1 Centerplate Functional
The centerplate functional test performs a series of electrical tests to verify parametric performance of several attributes across the relevant frequency band. Gain and noise figure are measured at each frequency to ensure they fall within an acceptable range. Transmit power, phase noise, and spurious emissions are measured and checked against allowable limits. Signals are sent and received through a direct electrical connection between the unit and the tester. The test has a batch size of one and it takes approximately 5 minutes to perform.
Failure rates at centerplate functional are fairly low (First-pass Yield = 93%), and the failures that are found are typically repeatable and real. The highest rate of CND failures for any single test attribute was only 0.14%.
3.3.2 Vibe
The vibe test is designed to simulate the vibrational conditions the unit may experience in the field while attached to a moving truck. During the test, the unit sends and receives messages directly through an electrical connection to the test station while undergoing acceleration on a vibration table. Signal-to-noise ratios (forward link, return link, and ranger, or positioning link) are measured and checked against the specification limits. A host of additional metrics are evaluated, as well. The test has a batch size of I and it takes approximately 8 minutes to perform.
Failure rates at Vibe are relatively low (FPY = 92%), but the rate of CND's is high. Nearly 94.5% of the failures recorded for the top five failure modes were not repeatable.
3.3.3 Environmental
The environmental test performs the same electrical tests that are performed at centerplate functional, except the tests are performed at temperature extremes. The test has a batch size of 40 and it takes 6 hours to complete (so the processing time per unit is about 15 minutes).
Failure rates at environmental are high (FPY=82%), but for the most part the test is catching real failures. Of the four failure modes with the highest CND rates, only 35% of the total failures are CND's.
3.3.4 Burn-in
The burn-in test (generally called Ransco, after the manufacturer of the test chamber) performs messaging tests while cycling the units through a series of temperature swings. While the message test itself is the same as the one performed at vibe, there are some
technical differences in how the unit communicates with the test station that make the test more complex. The batch size of a Ransco chamber is 250 units and the test takes 12 hours to complete. Note that the test time is not reduced if fewer units are run. Each unit is just tested more frequently over the 12-hour bum-in cycle.
There is some debate within the organization over the purpose of the Ransco test. The original intent of the test was three-fold:
1. Screen for infant mortality 2. Screen for intermittent failures
3. Perform some tests that aren't performed anywhere else in the test process
The quality group believed that Ransco did not effectively perform any of the above functions and it wanted to eliminate the test entirely. Unfortunately, no tests had been designed to measure Ransco's effectiveness at meeting the three aforementioned objectives.
The available data - failure data - showed that Ransco had a reasonably low failure rate (FPY = 92%), but that the CND rate was high. Of the four failure modes with the highest CND rates, 77% of the failures were not repeatable.
3.3.5 Acceptance Test Procedure
The Acceptance Test Procedure (ATP) performs the same basic messaging test that is performed at vibe and Ransco, except the test is performed over the air. Just before ATP, the antenna is installed, so the ATP test checks to see if the unit can acquire a signal and send and receive messages from a simulated satellite within the factory. Signal-to-noise ratios are again the primary metrics of interest. The batch size of the ATP test is 1 and the test takes approximately 8 minutes.
Failure rates at ATP are high (FPY = 88%), and nearly 100% of the units that fail ultimately pass without rework.
4.0 Improving How Existing Tests Are Performed 4.1 Yield Improvement Team
Before the internship began a yield improvement team with four goals was created: " Improve yields (95% First-pass Yield at each test step)
" Lowe product cycle time * Improve quality
" Understand CND failures
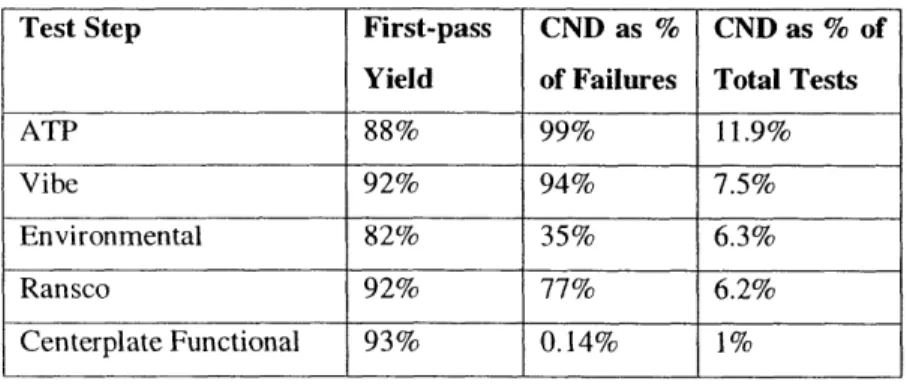
The team had collected yield information for each test step in the process and determined that improving the ATP step would provide the most benefit for the effort. While first-pass yields at ATP were not the lowest of all of the tests, the rate of CND failures was extremely high. Eliminating most of the CND's would reduce the wasted effort that went into multiple retests of product that ultimately was shipped without any rework. Table I summarizes the first-pass yield and CND rates for each test step.
Test Step First-pass CND as % CND as % of
Yield of Failures Total Tests
ATP 88% 99% 11.9%
Vibe 92% 94% 7.5%
Environmental 82% 35% 6.3%
Ransco 92% 77% 6.2%
Centerplate Functional 93% 0.14% 1%
Table 1 CND Rate by Test Step
The data in Table I actually underestimate the true impact of CND's on process efficiency. Units that fail at Centerplate Functional, Vibe, and ATP are immediately retested. Units that fail upon retest are sent to a debug station where a technician evaluates them. If the failure can not be duplicated by the technician, then the unit is sent back to the test station. Some units are tested and retested up to eight times before ultimately passing (a unit passes a test if it successfully completes one test cycle without failure, irrespective of the number of prior failures). These retests are not completely
captured in the above table. Over one two-month time frame, the CND rate as a function of total tests equaled 21%.
Sorting the data by cost of each CND or by greatest pain to the organization would have been useful in assessing the areas of greatest impact, but we were unable to collect the data necessary to perform these rankings.
During my internship I became the primary resource dedicated to collecting and analyzing data for presentation to the yield improvement team. Building on the work done by the team, I chose to focus first on the ATP process.
4.2 Characterizing the Current State of the Process
The first step in improving a process is to determine the current state, or the baseline. Many different types of analyses are useful in characterizing process performance. Perhaps the most common analysis, and the one predominantly used within QWBS, is the pareto chart.
While pareto charts are useful in focusing attention on the most frequently occurring or most costly failure modes, they don't provide any insight into why failures might be occurring. They contain no information on the statistical distributions of the test results. Two additional tools that are helpful in understanding process performance are control charts and Gage R&R studies. Control charts capture the dynamic nature of the process, and they include a measure of variability. Gage R&R studies provide insight into the sources of variability.
Following is a discussion of how we used each tool to better understand the performance of the OmniTRACS test systems.
4.2.1 Pareto Diagrams of Failure Modes
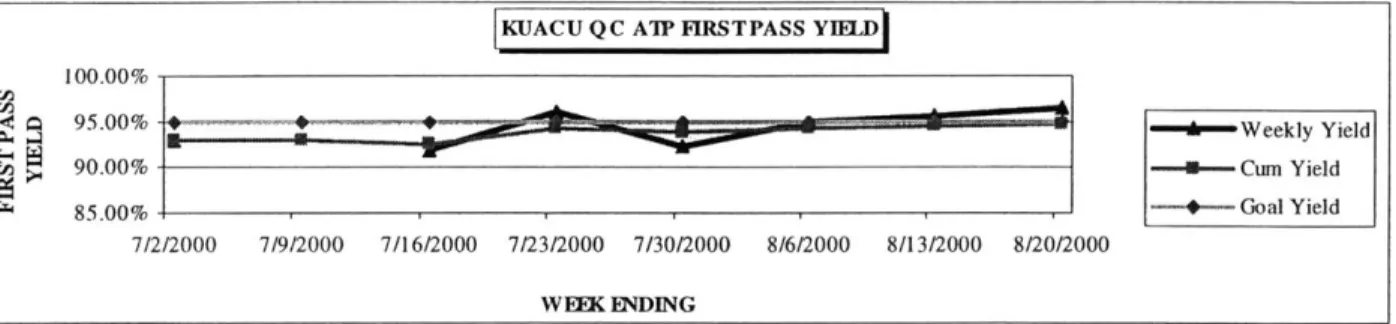
The quality group generated yield and failure reports on a weekly basis that were reviewed at a staff meeting. Figure 4 shows an example of a run chart of weekly yields for the ATP test step.
KUACU QC A'P FIRSTPASS YIELD 100.00% 95.00% - ~Weekly Yield 90.00% - Cum Yield 85.00% ---- Goal Yield 7/2/2000 7/9/2000 7/16/2000 7/23/2000 7/30/2000 8/6/2000 8/13/2000 8/20/2000 WEx ENDING
Figure 4 Weekly Yield Summary Report
By drilling down into the report, the distribution of failures across failure modes was available. Figure 5 shows an example of the detailed failure data table.
Cum Operation Qualifier 7/2 7/9 7/16 7/23 7/30 8/6 8/13 8/20 Total
ATPTEST QSSEO 14 0 7 4 4 19 11 4 63 QSRD1 8 0 3 4 4 8 2 3 32 RMRE1 1 0 3 2 7 3 6 0 22 RMTOO 1 0 1 4 8 5 0 2 21 RMT02 3 01 2 7 3 11 2 3 21 QSRDO 5 0 2 0 1 2 0 01 10 FMM01 0 0 0 2 1 2 2 0 7 GPERR 0 0 1 2 1 2 0 1 7 _______SWWK1 1 0 0 3 1 0 1 0 6 _______OVOT2 0 0 0 1 0 2 1 1 5 Qualifier Totals 33 0 19 29 30 44 25 14 194
Figure 5 ATP Failure Mode Pareto
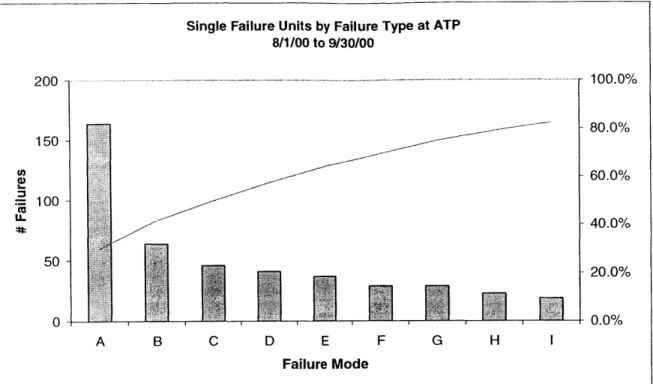
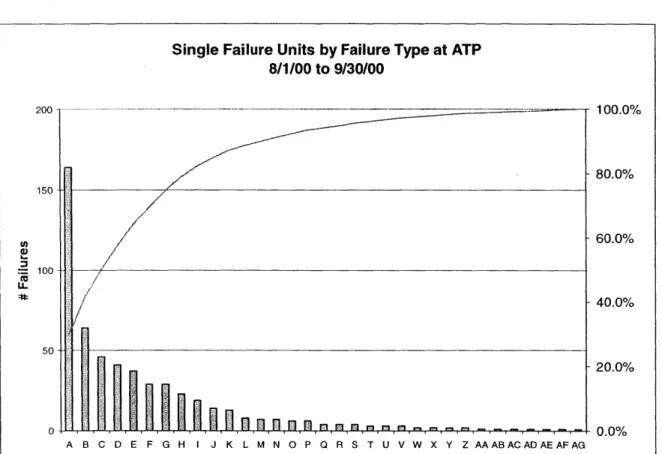
The data in Figure 5 include both real failures and CND's. Since the goal of the internship was to reduce/eliminate CND's, I generated a pareto of CND failures by failure mode. The results, shown in Figure 6, reveal that the top nine failure modes (out of a total of 33) account for 80% of the CND failures.
L ft:
200-150
100-Single Failure Units by Failure Type at ATP
8/1/00 to 9/30/00 100.0% 80.0% 60.0% 40.0% 20.0% 0.0% 0 F G H I A B C D E Failure Mode 50
-Figure 6 ATP CND Failure Pareto
With the CND problem distilled down to a manageable set of test attributes, the focus was then to identify the source of those failures.
4.2.2 Understanding Process Capability atATP
The goal of statistical quality control is to understand the sources of variation in a process. Variation can come from one of two sources: assignable causes; and natural variation. If a process is operating without the presence of assignable causes, then it is in a state of statistical control.
However, whether a process is in control or not does not determine how many failed units the process might generate. The relationship between the process mean and variability, and the product or test specification limits determines the expected rate of failures. This relationship is usually expressed as a process capability index, or Cpk.
[j-i I
H' n
- , ... -.- ... ..... ... Ii
Fl FIA 1-1
Cpk= minUSL-P p-LSL)
where USL = Upper Specification Limit and LSL = Lower Specification Limit
As the capability ratio decreases, the number of failures you expect to see in the absence of assignable causes increases. This reveals several areas of inquiry necessary to determine why units might be failing a process.
1. Is the process centered? If the process mean is close to either the lower or upper specification limit, the capability ratio may become unacceptably small, even if the process is in a state of statistical control.
2. Is the process variability large?
3. Is their significant variability in the measurement process?
To answer the question of why seemingly good units were failing at ATP, we wanted to answer the three questions above. We also needed to determine whether the process was operating in a state of statistical control (without assignable causes).
Data collection was not an issue. All test results are automatically logged into a database to which I had access. In fact, the volume of available data presented more of a challenge than anything else. More than 50 attributes were tested on each product at ATP, and five different product variations were consistently produced. To make the analysis feasible, we chose to focus first on the highest volume part number. We also leveraged our findings from the pareto analysis of CND defect rates by attribute to limit our study to the top five test attributes of concern.
In order to get meaningful results, we also had to segment the data further. ATP tests were performed on four different tools, each with potentially different performance characteristics. Thus we had to perform the analysis on each tool separately. Also, the selected part number could contain one of two centerplates, one produced by QWBS or one purchased from an outside vendor. We broke the data into these two sub populations so we could see any performance differences between the two.
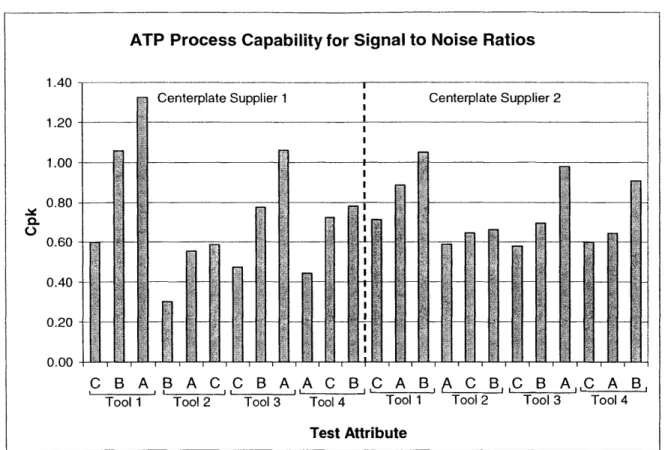
Figure 7 summarizes the process capability of each ATP test station for the three signal-to-noise ratios evaluated during the test.
Centerplate Supplier 1 Centerplate Supplier 2
~Hi'
ATP Process Capability for Signal to Noise Ratios 1.40 -1.20 1.00 0.80
-H
0.60 0.40-0.20-4k
U.UU -C B A B A -C -C B A A -C B -C A B ,k C B C B A C A BTool 1 Tool 2 Tool 3 Tool 4 Tool 1 Tool 2 Tool 3 Tool 4 Test Attribute
M,
1--I
Figure 7 ATP Process Capability for Signal-to-Noise Ratios
The process capability ratio (Cpk) can be used to estimate expected fallout from the process in the absence of assignable causes. We can use this fact to determine whether the process capability ratios exhibited in Figure 7 explain the high rate of CND's at ATP. To do so, I used the Cpk of each attribute-tool-centerplate combination to look up an expected fallout rate and then weighted each fallout rate by the ratio of the number of attribute-tool-centerplate tests to the total number of tests. Performing this calculation for the three signal-to-noise ratios leads to an expected fallout rate of 2.3% (see appendix for
a detailed summary of this calculation).
.
The process capability analysis reveals that the ATP process will have relatively high fallout rates, even when the incoming product may have nothing wrong with it. There are then four levers that can be used to improve process capability and reduce the fallout rate:
1. Center the process mean. 2. Reduce process variability. 3. Increase the specification limits.
4. Reduce the variability in the measurement process.
If the mean were exactly centered between the existing specification limits without changing the variability, expected fallout for the three signal-to-noise ratios would fall from approximately 2.3% to 1.5%. Changing the specification limits from +3dB and -2dB to +5dB and -5dB leads to an expected fallout of only 0.6%. Reducing variability would have a similar affect, depending on the magnitude of the change.
4.2.3 Gage Repeatability and Reliability Study on ATP
Gage R&R studies are designed experiments that measure the variability of a measurement process, including both operator variability and gage (or test equipment) variability. Characterizing how much of the total variation in the ATP test measurements was due to the test process itself (as opposed to the product) was essential to the improvement process.
The standard Gage R&R study involves the measurement of a group of parts (typically around 10) multiple times (two or three) by multiple operators. Measuring 10 different parts allows you to calculate variation across parts. Measuring the same part multiple times allows you to calculate variation in the measurement. Measuring the same part by different operators allows you to calculate the variation introduced by the test operators.
The experiment we performed at ATP included eight parts, two operators, and three trials per part per operator. The resulting data collection form is displayed in Figure 8 (on the next page).
L-4) Lm 1 Part 2 3 4 5 61718 A 1 2 3 B 1 2 3
Figure 8 Gage R&R Data Collection Sheet
Because the test process is automated, it was not expected that the operator variability would be significant. The experiment was not too costly to run, though, so we included the second operator to test the hypothesis.
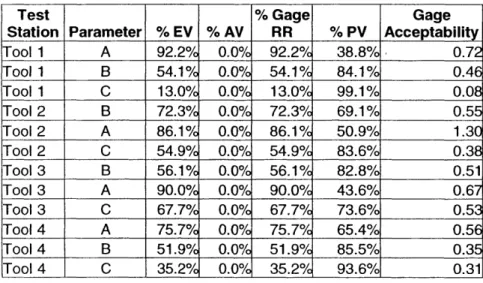
The experiment was run on each ATP test station. We did not run the test separately for each centerplate supplier, but the only difference should be in the part variation, which was not the focus of the experiment. The results of the experiment are listed in Table 2 below.
Test % Gage Gage
Station Parameter % EV % AV RR % PV Acceptability
Tool 1 A 92.2% 0.0% 92.2% 38.8%, 0.72 Tool 1 B 54.10/ 0.0% 54.1% 84.1% 0.46 Tool 1 C 13.0% 0.0% 13.0% 99.1% 0.08 Tool 2 B 72.3% 0.0% 72.3% 69.1% 0.55 Tool 2 A 86.1% 0.0% 86.1% 50.9% 1.30 Tool 2 C 54.90 0.0% 54.9% 83.6% 0.38 Tool 3 B 56.10/ 0.0% 56.1% 82.8% 0.51 Tool 3 A 90.0% 0.0% 90.0% 43.6% 0.6 Tool 3 C 67.7% 0.0% 67.7% 73.6% 0.53 Tool 4 A 75.7% 0.0% 75.7% 65.4% 0.56 Tool 4 B 51.90 0.00/ 51.90/ 85.5% 0.3 Tool 4 C 35.20/ 0.00/ 35.20/ 93.6% 0.31
Percent EV (equipment variation), % AV (appraiser variation), % Gage R&R, and % PV (part variation) are calculated by dividing the variation attributable to the category by the total observed variation. Gage acceptability is the ratio of the total gage variation to the specification range. Ten percent is generally accepted as the upper limit for measurement error. Note that only parameter C on Tool I has a gage acceptability of less than 10%. The other attributes are much higher, many above 50%.
The Gage R&R study at ATP showed that the test as designed was not precise enough to measure the signal-to-noise ratios effectively given the required specification range.
4.3 Changes Implemented
Based on the data presented above, the yield improvement team agreed to make several immediate changes to the ATP test. First, three test attributes that generated some of the highest CND rates were eliminated altogether. No hard failures had ever been attributed to the three test attributes, and the cost to make the changes was negligible (the tests weren't actually eliminated from the code; rather, the limits were increased to near infinity). Second, the limits on the signal-to-noise ratio tests were doubled.
Two justifications were discussed for the changes, one theoretical and one practical.
Theoretically, the team came to believe that the primary purpose of the ATP test was really to prove that the system could acquire a signal through the antenna and transmit a return signal successfully. The quality of the signal was not as important, as the test environment was significantly different than the field environment (where signal quality is meaningful). The signal-to-noise ratios measure signal quality, so the limits could be expanded without compromising the integrity of the test.
Practically, the limit increases wouldn't change the effectiveness of the test. Figure 9 (page 33) shows a normal curve with mean and variation equal to that of attribute B on tool 2 at ATP. Before the limit changes, a "good" unit with the same mean and variation as other units could fail at ATP by falling into region 1I. As shown through the Gage
R&R study, a large portion of the variation is due to measurement error. On a subsequent retest, the measured value will vary significantly without any change to the unit's performance, likely falling into region I (and passing). Region II thus represents CND failures.
After the limit changes, the units that fall into region II will pass on the first test, rather than on subsequent retest. The net effect is that the same units will pass with the new test limits as with the old test limits, but fewer tests will be required.
Units that failed for identifiable reason, or non-CND failures, typically fell well outside of the specification limits. They will fail, even with the new test limits.
Limit Changes at ATP - Attribute B on Tool 2
New LSL
(0 ;1 10o
4 C6 '~
C\j (D 0 (0
6 05 c' 1c: C C16 4 o
Figure 9 CND Reduction Due to Expanded ATP Limits
4.4 Monitoring Process Performance Over Time - Run Charts and Control Charts
Prior to implementing the ATP test changes, the yield improvement team wanted to be sure that the process would be monitored closely over time to detect sustained shifts in
Old LSL * Old USL NewUSL~
I I I I * I I I I * * I * I I I I I II I
performance. Historically, process monitoring consisted of failure reports. The team did not feel comfortable relying on yield data alone to monitor the changed process, because it would take a significant shift in the process mean or a dramatic increase in process variability in order for significant numbers of failures to occur.
The ideal solution would have been to develop control charts to monitor the process. I had already calculated process means and variation, so all I needed to do was plot subgroup data on a run chart with control limits at ±3c-.
Unfortunately, and perhaps predictably, it did not turn out to be so simple. The control limits rely on the assumption of normality. I checked the assumption using normal probability plots and found that it did not hold for many of the attributes. The primary reason was that the signal-to-noise ratios were constrained to be integer values by the limited bandwidth of the over-the-air transmission. Creating subgroups of five consecutive tests solved the problem satisfactorily.
Autocorrelation in the data was not so easily solved. Every unit manufactured is tested, so inertial elements in the process lead to correlated data. Traditional Shewhart control charts are very sensitive to the assumption of independence in the underlying dataset. Correlation amongst the data can lead to false alarms. Figure 10 (page 35) shows an autocorrelation diagram for one of the test attributes on test station 2.
Estimated Autocorrelations for MeasuredValue p~0.6 0.2 -0.2 -~~ ~--0.6 i mm .. -4-, -0 .- . . . . 0 5 10 15 20 25 lag
Figure 10 Autocorrelation Chart
Literature suggests several ways to deal with correlated data. One is to model the correlative structure explicitly with a time series model, use that model to remove the autocorrelation, and then apply control charts to the residuals. Montgomery, Johnson, and Gardiner (1990) and Box, Jenkins ,and Reinsel (1994) propose a set of models called autoregressive integrated moving average models that can be used to develop control charts for correlated data.
The processes described in literature to deal with correlated data require a significant level of statistical knowledge to prove useful. Run charts of test measurements are intuitive. Operators and engineers alike can relate to the data, because it is in a form they see every day. Run charts of residuals of a time series model or exponentially weighted moving averages are more abstract. They require some understanding of the statistical models used to derive the chart data from the original test results in order to interpret signals in the chart.
Montgomery suggests coupling an Arima chart with a standard run chart of test results. This allows users to visually translate changes in test performance they are familiar with into changes in performance on the statistical control chart. This is a good solution to the
problem, but it still assumes a basic comfort with the method of charting process data and interpreting the results.
Yet QWBS had no experience with the use of run charts to analyze process performance. Presenting the group with a complex set of statistical charts before they were comfortable with the concept in general would have been counterproductive. If the charts weren't easy to interpret, and somehow grounded in the reality they understood, then they wouldn't be used.
So the tool we chose to develop used the old specification limits as "alarm" limits on a run chart of test measurements. Subgroups were used to make the data more normal. The charts allowed the engineers to begin understanding the dynamic nature of the process. It also enabled the team to be warned of potential failures before they began to occur. We created a software routine that checked for subgroup measurements that exceeded the alarm limits (the old specification limits). This gave the group visibility to changes in process performance before yields were impacted.
As the engineers in QWBS begin to feel more comfortable with the use of run charts to monitor process performance, they may find it useful to increase the complexity of the charts by adding the appropriate statistical control limits. This will become especially important if they choose to try to reduce the variability of the ATP test. Until then, the run charts will continue to provide a bridge between the new process data and the knowledge they had developed prior to the change in the specification limits.
4.5 Test Alarm Response Team
The run charts described in the previous section were generated using an Access database application I developed called the Omni SPC Analysis Database. The database, which will be discussed in greater detail in chapter 5, included a set of reports that highlight units that exceeded the alarm limits. The yield improvement team wanted a group of
engineers to respond immediately to these alarm conditions to understand the source of the failures.
The Test Alarm Response team was created to perform this function. The team consisted of the test engineer responsible for the ATP testers, the quality engineer responsible for the Omni test process, the supervisor of the test equipment maintenance and repair group, and myself. My role was to run the database function to check for alarms on a daily basis and to call the team together whenever any alarms occurred. I typically would perform some different analysis before calling the team together to see if I first could determine a potential cause for the alarms.
The team met on two or three different occasions to review alarm conditions. The primary source of alarms came from a group of products that was known to perform right on the edge of the old specification limits due to design issues. The group agreed to ignore alarms for these products unless they deviated significantly from the historical average (as determined by a visual assessment of the run chart).
The team did gain some valuable insight into the process when a set of measurements dropped dramatically on one day. The test measurements for each unit are evaluated in comparison to a reference unit run at the beginning of each shift. The dramatic drop in test measurements was due not to a drop in unit performance, but on one occasion to an increase in the signal-to-noise ratio of the reference unit. This forced the team to reevaluate the purpose and effectiveness of the reference units. Without the alarm response team, that discussion would not have occurred, and the process would not have been as well understood.
The test alarm response team was considered a success because it provided a cross-functional forum for the analysis of operational test data. The Test Engineering and quality groups did not typically work together on anything more than an ad-hoc basis to improve the test process, so the synergy was beneficial.
4.6 Results
The effects of the changes to the ATP test were immediate. First-pass yield improved from 88% to 97%, leading to a projected annual savings of over $45,000. Figure 11 shows the pareto of failures at ATP in the two months before the test changes. Figure 12 (on the following page) shows the same pareto for the two months following the limit changes.
Single Failure Units by Failure Type at ATP 8/1/00 to 9/30/00 200 -- ---- ---- -- - 100.0% 80.0% 150 60.0% 100 LL 40.0% 50 20.0% A B C D E F G H I J K L M N 0 P 0 R S T U V W X Y Z AA AB AC AD AE AF AG Figure 11 Pre-Change ATP Failure Pareto
200 150 100 LL 50 0
Single Failure Units by Failure Type at ATP 10/1/00 to 11/30/00 100.0% 80.0% 60.0% 40.0% 20.0% 0.0% J D K M N I B C S X 0 Q F E T K
Figure 12 Post-Change ATP Failure Pareto
The total number of failures over a two-month period fell dramatically after the change, from 549 to 72. The number of failure modes also decreased from 33 to 16. By all accounts, the change was a success.
---5.0 Software Tools to Support Continuous Process Monitoring 5.1 Initial State of IT Tools
One of the three goals of the internship was to develop an on-line statistical process control tool. The tool would need to fit into the existing IT infrastructure in order to be supported after the completion of the internship. Figure 13 shows a diagram of the software tools supporting the OmniTRACS process. Following is a discussion of each component of the existing system.
Tester A Tester B A es Tester C !estor D] QualityLink Access Database Shop Floor Control
SC---I
OmniSPCAnalysis Access DatabaseSome user interaction, but mostly canned Ireports.
-- -
-Figure 13 IT Environment Supporting the OmniTRACS Process
5.1.1 Shop Floor Control
Shop Floor Control (SFC) is used to control the flow of materials through the manufacturing line. It was developed in-house, and it utilizes an Oracle database with a Powerbuilder front-end. SFC contains the official as-build configuration that identifies the part number and supplier of each component in a product. It also has a set of quality reports, including yield reports, which are used by the Quality group to monitor test system performance.
As stated in Chapter 2, SFC has no interface to the testers or the QualityLink database. This poses two problems. First, test results must be entered manually into the SFC database by operators on the floor. Parametric test results are not input, only pass/fail attributes with the associated failure code. Dropdown menus of failure codes are available, but users are allowed to enter data not included in the dropdown list. This leads to the potential for discrepancies between the data in QualityLink and SFC. Second, operators must enter the product identifier at each successive test station. Again, no safeguards exist to ensure that the correct part number is input at each test station. This led to cases where a product was identified in QualityLink as coming from supplier A at centerplate functional, but then from supplier B at Vibe.
Ideally, an interface would be developed between QualityLink and SFC. However, the Oracle database on which SFC is based is no longer supported by Oracle. The IT department was evaluating options for upgrading the system, so all development of new functionality was put on hold.
5.1.2 QualityLink
QualityLink is a Microsoft Access database developed by the Test Engineering group to store parametric test results from the OmniTRACS process. Data is transferred to the database from the test equipment at the end of each test (nearly real-time). The front-end of the application provides only a simple query tool that allows data to be extracted from the database and exported to Excel. Consequently, the data in QualityLink is used only on an ad-hoc basis by a limited group of engineers in the Quality group who are familiar with the application.
The design of the database underlying the QualityLink application mirrors the physical test process. A master table identifies all tests performed (date, tool, product tested), and test results are distributed across multiple tables. Some data for like tests are stored together (Vibe and ATP, for example) but each test step basically has one or more tables to store its results. Generic queries to extract test results are difficult to create due to this database design.
5.1.3 Common Test Software (CTS)
The Test Engineering group recognized the limitations of the software controlling the OmniTRACS testers. The code is a mixture of C and C++. The testers are DOS-based and have no room for additional drivers. Maintaining and upgrading the software and hardware is time-consuming and expensive.
CTS was developed to support the next generation product line under development within QWBS. It utilizes a more consistent object-oriented design and it is built on the Windows NT platform. Each tester is controlled by a workstation that could feasibly support additional functionality, such as a web server and/or a local statistical process control application.
Data storage and retrieval were also factored into the CTS design. Data from each tester is stored locally, and then dumped into a data warehouse on a periodic basis. The table structure within the data warehouse is generic, meaning test results from any tester will reside in one of two tables, depending on the type of data. Generic queries and reports could be created easily off of the data warehouse.
5.2 Omni SPC Analysis Database
The Omni SPC Analysis database was developed to support continuous monitoring and improvement of the OmniTRACS product line. The choices of software and system design were constrained by the existing IT infrastructure, the skills of the individuals available to support the system, and the limited development time. Following is a discussion of the design alternatives that were evaluated and a description of the
5.2.1 Selecting a Development Environment
The goal of the SPC Analysis database was to provide a set of on-line tools to help evaluate the performance of the OmniTRACS manufacturing process. Ultimately, the
system would offer the capability to perform real-time statistical process control.
The CTS environment was clearly the ideal place to integrate statistical process control tools. It was the future of test software in QWBS, and it had a robust infrastructure that could support different application design alternatives. Unfortunately, the manufacturing and Test Engineering organizations were not sure if and when CTS would be implemented for the OmniTRACS process. The cost of rewriting the code was significant and the benefit difficult to quantify. Also, virtually no product was being manufactured on the lines supported by CTS (the products were in their infancy and had not gained market acceptance). Thus development efforts in the CTS environment would not provide any short-term benefit to QWBS.
QWBS had multiple data warehousing efforts underway, so another possible alternative was to dump QualityLink data into the data warehouse, and then use a standard OLAP tool like Cognos Impromptu to develop reports and data analysis tools. The engineer within the quality group who was going to support the tool over time had experience developing in the Cognos environment, so this alternative could be supported. But the data warehousing group was over-committed already, and the benefits of adding quality data to the data warehouse were not deemed significant enough to displace an existing project.
The tool would then have to interface with the existing QualityLink database on the back end. Two alternative front-end tools were considered: a Java applet and a Microsoft Access application.
The Java applet would allow access to the application through a web browser on any PC and it would eliminate the need for users to install a program. But the tool would not be supportable initially, as no one in the organization had any experience programming in