Publisher’s version / Version de l'éditeur:
Vous avez des questions? Nous pouvons vous aider. Pour communiquer directement avec un auteur, consultez la première page de la revue dans laquelle son article a été publié afin de trouver ses coordonnées. Si vous n’arrivez pas à les repérer, communiquez avec nous à [email protected].
Questions? Contact the NRC Publications Archive team at
[email protected]. If you wish to email the authors directly, please see the first page of the publication for their contact information.
https://publications-cnrc.canada.ca/fra/droits
L’accès à ce site Web et l’utilisation de son contenu sont assujettis aux conditions présentées dans le site
LISEZ CES CONDITIONS ATTENTIVEMENT AVANT D’UTILISER CE SITE WEB.
Proceedings of the 25th International Conference on Port and Ocean Engineering under Arctic Conditions, June 9-13, 2019, Delft, The Netherlands, 2019-06
READ THESE TERMS AND CONDITIONS CAREFULLY BEFORE USING THIS WEBSITE.
https://nrc-publications.canada.ca/eng/copyright
NRC Publications Archive Record / Notice des Archives des publications du CNRC :
https://nrc-publications.canada.ca/eng/view/object/?id=3241dfde-9a59-4015-8a02-bc6da689692c https://publications-cnrc.canada.ca/fra/voir/objet/?id=3241dfde-9a59-4015-8a02-bc6da689692c
NRC Publications Archive
Archives des publications du CNRC
This publication could be one of several versions: author’s original, accepted manuscript or the publisher’s version. / La version de cette publication peut être l’une des suivantes : la version prépublication de l’auteur, la version acceptée du manuscrit ou la version de l’éditeur.
Access and use of this website and the material on it are subject to the Terms and Conditions set forth at Environmental monitoring and ice forces on the Nanisivik Wharf
Proceedings of the 25th International Conference on
Port and Ocean Engineering under Arctic Conditions
June 9-13, 2019, Delft, The Netherlands
Environmental Monitoring and Ice Forces on the Nanisivik
Wharf
Louis Poirier1, Jeff Brown2, Robert Frederking1 1 National Research Council Canada, Ottawa, Canada
2 National Research Council Canada, St. John’s, Canada
ABSTRACT
Climate change and its potential impacts upon northern coastal infrastructure are pressing concerns. Changing patterns of sea ice formation, movement and break-up may impact design criteria for such infrastructure. The National Research Council (NRC) with the help of the Department of National Defence, Defence Construction Canada and their contractors, installed an ice load monitoring system with two ice load panels at the Nanisivik Naval Facility in September 2017. The main objectives of this work are to correlate ice forces measured on the Nanisivik Naval facility to the environmental conditions in Strathcona Sound. The system comprises a camera to capture the ice conditions in Strathcona Sound, two ice load panels each 27 cm wide (one 2 m and the other 3 m in height), thermistors to monitor the temperatures of the air and both load panels, a pressure transducer to determine the tide level and a data acquisition system. The extreme range of the tide was 3 m and the bottom of the 3 m panel was about 1.5 m below the Lowest Astronomical Tide.
Freeze up occurred in Strathcona Sound in mid-October, however no measureable loads were measured by the system until January. During the entire measurement period loads were only indicated on the panels for about 5% of the time. Each panel is divided into 50 cm zones along its height. The three lowest zones of the 3 m panel, which are below the lowest tide range, did not experience any large loading events. The top of the 2 m panel was positioned 1 m above the top of the 3 m panel.
The greatest ice pressure observed on a single 27 cm x 50 cm zone occurred on the top zone of the 3 m panel on February 1st, 2018 and it was 1230 kPa. This paper will review the effects of tides and temperature on the measured loading at the wharf.
KEY WORDS
Ice; Loads; Bustle, Arctic; Port.
INTRODUCTION
Ice loads along the Northwest Passage are of interest to those seeking to build offshore or coastal infrastructure in the area. With increased activity in the Northwest Passage combined with a changing climate there is more interest than ever in understanding the ice loading
conditions in areas such as Nanisivik. While considerable work has been done in the past, those data sets are more than 30 years old and both the local climate and measuring equipment have changed. To capture the ice loading on the wharf, the National Research Council Canada has installed ice load panels on the Nanisivik wharf, over a height range of 4 m. The results will be of interest not only for the long term maintenance of the Nanisivik Naval Facility but also for new coastal infrastructure such as the small craft harbours proposed for Pond Inlet and Clyde River, the new facility in Iqaluit, mining developments, and ships navigating the Northwest Passage. For these reasons the Department of National Defence and the National Research Council installed an ice load monitoring system at the Nanisivik Naval Facility to better understand the ice forces experienced by the wharf.
Location
The Nanisivik Naval Facility is located near the Eastern edge of the Northwest Passage at 73.07˚ N, 84.55˚ W. The facility is located on the southern shore of Strathcona Sound (Figure 1), 36 km from the community of Arctic Bay and 30 km from the Arctic Bay Airport along the Arctic Bay to Nanisivik Highway.
The original wharf at Nanisivik was completed by the Government of Canada in 1977 to support a lead and zinc mine (Girgrah and Shah, 1977). It is Canada’s only deep water port facility along the Northwest Passage. The port will serve as a refueling and supply facility for Royal Canadian Navy’s Arctic Offshore Patrol Ships operating in the Canadian Arctic (Lackenbauer and Lajeunesse, 2016; Seavey et al. 2013). The wharf comprises three cells which form a vertical face along which ships can be moored.
EQUIPMENT
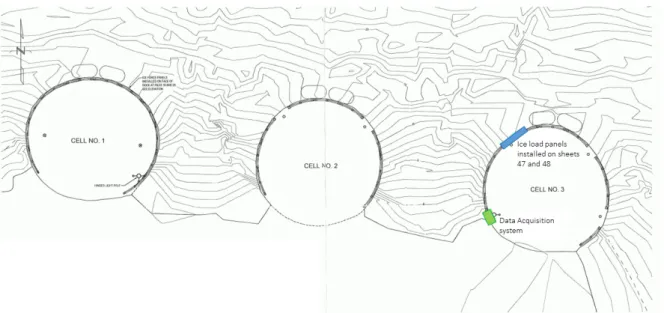
The NRC has installed research equipment at two locations of the Nanisivik Naval Facility, shown in Figure 1. Each location is a self-sustaining system with its own power source and data storage system. Each system is powered by a battery that is recharged by solar panels and the data are stored locally. A camera system is installed at the permanent site office to observe general ice conditions in the sound. The ice load monitoring system is installed on Cell #3 of the wharf.
The ice load monitoring system includes the two ice load panels, a solar panel, a battery and a data acquisition system. The data acquisition system comprises a multiplexer and a data logger. The locations of the data acquisition system and the load panels are shown in Figure 2. The data logging system records the temperature within the logger enclosure, battery voltage powering the logger, the thermistor data from each panel, and the tide level from the pressure transducer on the 3 m panel, excitation voltages and loads from each of the panel zones. At current acquisition rates the logger, with the additional memory included with the system, is capable of multiple seasons of uninterrupted data recording.
Because there is no daylight for a period of approximately 80 days, the system was designed to run off the battery and allows for the solar panels to recharge the battery once the sun returns. The excitation voltages supplied to each load panel zone varied less than 0.1% over the range of temperature and battery voltages experienced over the winter. The solar assist to the battery power resulted in a very reliable data logging system.
Two IDEAL Ice Load Panels were installed on Cell 3 of the Nanisivik Naval Facility. The panels were designed to fit flat on a single sheet pile of the cell. Each panel has an active area that is 27 cm wide and the upper panel has an active height of 2 m while the lower panel has an active height of 3 m. The panels have been bolted and epoxied onto backing plates which were welded onto each sheet pile, see Figure 3. The piles are 0.5 m wide, but a width of only 27 cm was available as an active measurement surface due to space required to connect the
piles together and to connect the panels to their backing plates.
Figure 1. Nanisivik and Strathcona Sound. The location of the Nanisivik Naval Facility is identified by the red box and expanded in the lower image. The upper image was created
using ArcGIS, the lower base map was obtained from Google Maps.
Figure 2. Location of the NRC equipment (not to scale). This image is from the Nanisivik Naval Facility ice force panel installation plan (23 Oct 2015). The image was modified by the
authors to indicate the location of the equipment.
Each panel has a thermistor at the top of the load panel. The 3 m panel also has a pressure transducer at the bottom of the panel as shown in Figure 3. The two panels are both divided in 50 cm zones along the height. The inner and outer faces of the panel are separated by a number of rings, approximately 40 for each zone. For each zone four rings, as shown in Figure 3, are strain gauged and provide an output which is assumed to be proportional to the average ice pressure on the zone. There are a total of 10 zones on the two panels. The zones have been designated 2-1 to 2-4 for the 2 m panel and 3-1 to 3-6 for the 3 m panel. The two panels have been installed such that the bottom of the 2 m panel is located 0.5 m above the Lowest Astronomical Tide (LAT) and the bottom of the 3 m panel is located at 1.5 m below the LAT as shown in Figure 3. As a result of the installation the bottom two sections of the 2 m panel are at the same elevation as the top two sections of the 3 m panel as shown in Figure 3. Zones 2-3 and 3-1 as well as Zones 2-4 and 3-2 are at the same elevation and should experience similar loading. For reference, the High Astronomical Tide (HAT) is located at an elevation of 2.98 m or 48 cm above the top of the 2 m panel.
Figure 3. IDEAL Ice Load Panels
RECORDED ICE PRESSURES
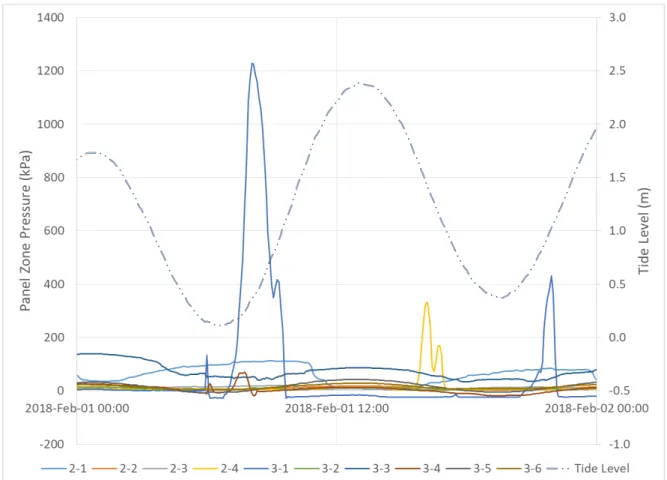
A time series record of the panel zone ice pressures and the tide level for the whole measurement season (September 2017 - June 2018) is presented in Figure 4. It is not until January that any loading events occur. As discussed in Brown et al. (2019), an ice bustle and the relatively thin ice cover ensure that no appreciable ice pressure had been generated up until this time. The most active loading period is from mid-January to the end of March. The baseline
signal was zeroed at the beginning of the season. This baseline drifted somewhat during the season however, examining Figure 4 we can see that the signal drift over the course of the season was very minimal, especially given the long period of time and the harsh conditions in which the system was left unattended.
Figure 4. Record of panel zone ice pressures and tide level at Nanisivik for 2017-18. Ice loading is responsible for all large loading events observed on the panels. The tide level is included because, as discussed in Frederking and Sinha (1978) and Brown et al. (2019), the tides are the primary driving force that pushes the ice bustle against the wharf.
The probability distributions of all panel zones for the whole winter season were examined. Plots of the probability distributions of the most actively loaded panels are presented in Figure
5. For each panel zone active ice loading occurs for less than 5% of the recording period. Zones
2-1, 2-3, 2-4 and 3-2 have normal tails on their distributions. Zone 2-2, 3-1 and 3-3 are all loaded less than 0.2% of the season. There were some low level ice loads on Zone 3-4 and 3-5, but almost none on 3-6. On these three panel zones, the observed pressures decreased from top to bottom. The recorded ice pressure distribution on the panel zones suggests that below the lowest tides, the ice is too weak to make an appreciable contribution to the ice load on the wharf.
The events in the tails of the distributions were examined to determine whether they represented loading events lasting several tens of minutes or were random spikes. Zone 3-1 experienced substantial ice pressures, but has a weak tail; there are only about 30 measurements or 2.5 hours with zone pressures greater than 200 kPa or 4.2 hours for pressures greater than 100 kPa. Zone 3-3 also experienced substantial pressure, but the tail is weak, 2.5 hours of measurements for pressures greater than 200 kPa. In Figure 6 we can see that those 2.5 hours of pressures greater than 200 kPa measured on panel Zone 3-1 all occur in two events, both on February 1, 2018. Thus the tail of the distribution of Zone 3-1 is a one-time event.
Figure 5. Probability distributions for the seven most actively load zones, Nanisivik 2017-18.
Figure 6. The largest ice loading event recorded on a single zone (3-1) during the 2017-18 winter season.
The Zone 3-1 maximum ice pressure of 1230 kPa stands out from the other maximum pressures recorded during the 2017-18 winter season. This event will be reviewed further. Results from two earlier measurement programs at Nanisivik are available to put the measurements from this study into context. A maximum ice pressure of 425 kPa was reported by Frederking and Sayed (1988) who measured ice pressure in the level ice about 50 m from the cell face using a 1 m x 1 m panel. The maximum value was recorded in mid-winter, on February 18th, 1986. By comparing the freezing degree days Poirier et al. (2018) found that the winter of 1986 would have been similar in severity to 2017-18. An earlier study by Frederking and Sinha (1978) estimated maximum pressures of 500 kPa or greater from permanent deformation of their measurement panel in 1976. The direct ice measurements in 2018 and 1986 are relatively comparable, taking into account the respective measurement areas of 0.135 m2 and 1 m2. The scale effect of increasing local ice pressure with decreasing area (Masterson and Frederking, 1993) infers that decreasing the local measurement area by an order of magnitude resulted in about a 3 fold increase in local ice pressure, similar to the 1986 – 2018 comparison.
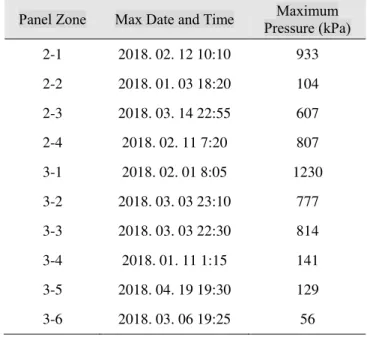
The maximum ice loading events for each of the 10 load panel zones are shown in Table 1. Zones 2-2, 3-4, 3-5, and 3-6 have relatively low maximum ice pressures. Pressures on the lower half of the 3 m panel, below the lowest tides, decrease with depth. Table 2 examines the ten largest ice loading events recorded on individual zones during the 2017-18 winter season. The maximum pressures on a single zone are noted along with the other zones affected during the ice loading event. For a zone to be considered loaded during an event in the final (right-hand) column of Table 2, the zone in question must have a peak corresponding to the event with a magnitude of at least 10% of the magnitude of the zone with the highest recorded load during the event. A bold font and underline for the panel zone indicates that the event is the largest loading event for that panel zone for the entire season. Thus for event 03, both zones 3-3 and 3-2 had their highest recorded loads for the season.
Table 1. Peak loading recorded for each zone of the two ice load panels installed at the Nanisivik Naval Facility
Panel Zone Max Date and Time Pressure (kPa) Maximum 2-1 2018. 02. 12 10:10 933 2-2 2018. 01. 03 18:20 104 2-3 2018. 03. 14 22:55 607 2-4 2018. 02. 11 7:20 807 3-1 2018. 02. 01 8:05 1230 3-2 2018. 03. 03 23:10 777 3-3 2018. 03. 03 22:30 814 3-4 2018. 01. 11 1:15 141 3-5 2018. 04. 19 19:30 129 3-6 2018. 03. 06 19:25 56
The first loading event from Table 2 was shown in Figure 6, where the loading was observed almost exclusively on zone 3-1. In Figure 7 we look at the time series for the second and fourth largest loading events on a single zone. The two loading events are also the highest recorded loads on each of the two panel zones, 2-1 and 2-4. Zone 3-2 is also very active during the two events. It is a pair of interesting events because zones 2-4 and 3-2 are at the same elevation so
we would expect them to record similar values and be synchronized. However, they are not and this type of behaviour is normal for the data that we have examined. The most obvious explanation for this is that the contact geometry between the panels and the ice bustle is inconsistent. It suggests that the ice can apply force in a non-uniform manner around the cell’s circumference. In the first event zone 3-2 was loaded first while in the second it was 2-4 first. In both cases the delay was from 30 to 60 minutes. For other events, such as third event from Table 2, the two load panel zones 2-4 and 3-2 were loaded simultaneously.
Table 2. Ten highest loading ice events recorded at the Nanisivik Naval Facility during the 2017-18 winter season. A bold font and underline indicates that the event is the highest for
that panel zone for the entire season. Ice Event Date and Time of Peak Pressure on a Maximum
Single Zone (kPa)
Primary Zone
Loaded Other Zones Loaded
01 2018. 02. 01 8:05 1230 3-1 - 02 2018. 02. 12 10:10 933 2-1 3-2, 2-4, 2-3 03 2018. 03. 03 22:30 814 3-3 3-2, 2-4, 3-1 04 2018. 02. 11 7:20 807 2-4 2-1, 3-2, 2-3 05 2018. 03. 10 17:40 696 2-4 3-2 06 2018. 02. 10 5:20 686 2-4 2-1, 2-3 07 2018. 02. 09 17:25 659 2-4 - 08 2018. 03. 14 22:55 607 2-3 - 09 2018. 03. 15 8:30 607 3-2 2-4 10 2018. 03. 10 3:30 595 2-4 2-3, 3-2
Figure 7. The second and fourth largest ice loading events on a single zone during the 2017-18 winter season. The three dominant zones are 2-1 (solid), 2-3 (dashed) and 2-4 (dotted).
ENVIRONMENTAL FACTORS
The ice loads measured in this study varied along with the environmental conditions. The tide has a significant impact on the loads measured at the site. As each panel is set to a different elevation we expect that the tide will impact each panel zone differently. To determine the tide level that creates the greatest pressures on each panel zone we have used an analysis similar to a centre of mass to calculate a centre of pressure (CoPn) for each panel zone (n). Where ti are
the individual tide measurements from the pressure transducer on the bottom of the 3 m panel and Pni are the individual panel pressure measurements for zone n.
���� = ∑ �∑ ��∗���
�� (1)
Because over 95% of the data record is baseline data, that baseline data was removed from each load panel zone record prior to this analysis. The threshold for inclusion, top % of data and the pressure threshold, are included in Table 3 with the elevation of the geometric centres and the calculated centres of pressure for each zone. The data from zone 3-6 is for a single event, as such the data was selected by time not using a pressure threshold for inclusion. The information from Table 3 is also shown in Figure 8.
Table 3. The centre of pressure is the tide level corresponding to the application of pressure for each zone of the panel.
)o e Ce tre of zo e pressure Ce tre of Threshold Threshold kPa
- . . . % - . . . % - . . . % - . . . % - . . . % - . . . % - . . . % - - . . . % - - . . . % - - . . . % N/A
In Figure 8 we can note that the tide associated with loading on each panel zone generally increases with the elevation of that zone. It is however more difficult to make more global statements. Zones 2-2, 3-5 and 3-6 have very little data as they are loaded for less than 0.05% of the season and therefore we can have little confidence in their result. Zones 3-1, 3-3 and 3-4 also have limited data records (0.5% or less). Further because most of the tidal action occurs in the range of 0.5 to 2.0 m as shown in Figure 4 panel zones outside of that range (2-1 and 3-3 to 3-6) may be moderated by that effect. As a result the most telling data from Figure 8 is that zone 2-3 at an elevation of 1.25 m experiences the greatest loading for a tide of 1.65 m and that zones 2-4 and 3-2 at an elevation of 0.75 m experience the greatest loading at tide levels of 1.33 m and 1.15 m respectively. The geometric centre of the zone is 0.4 to 0.6 m below the waterline during these loads.
Figure 8. The centre of pressure defines the tide level where most of the loading occurs for each of the 10 load panel zones. The zones were grouped based on the percentage of time that
loads were recorded.
The remaining analysis examines the data included in Table 3 and Figure 8 without differentiating between load panel zones. The data from all of the zones are treated equally. A total of 9028 measurements or 1.2% of the data record are considered. The effect of tide was examined in Figure 9, specifically the effect of tide phase on the ice pressures recorded in the study. The tide phase was obtained by using the maximum (0 degrees) and minimum (180 degrees) tides from Fisheries and Oceans Canada (2018) and interpolating the phase to the times of our measurements in between those values. The results suggest that greater pressures are observed for higher tides with a minimum around low tide (180 degrees). Further, there is twice as much loading time during the waxing, or increasing tide (> 180 degrees) than the waning tide (< 180 degrees).
The impact of air temperature on the ice pressure measurements from this study is examined in Figure 10. The temperature readings are taken from the data logger. Those results were compared to the nearest weather station in Arctic Bay by Poirier et al. (2018) and found to be similar. The recorded ice pressures increase with colder temperatures as does the magnitude of the highest pressure events. The coldest temperature recorded during the season was -44.0 ̊C and the maximum load was recorded at a temperature of -40.3 ̊C. Winds normal to the load panels were also examined using weather station data from Arctic Bay however any potential effect was unclear.
Figure 9. Ice pressures measured for different tidal phases in Strathcona Sound, Orange for increasing and Blue for decreasing tides. (high tide = 0 degrees & low tide = 180 degrees).
CONCLUSIONS
An ice load monitoring system has been installed at the Nanisivik Naval Facility. The system provides video data of the ice conditions in Strathcona Sound, tide information, air temperatures, temperatures from each of the two load panels and ice pressures against the structure from 2 load panels separated in a total of 10 zones. The system has proven very reliable during its first season of recording from September 2017 to June 2018. No ice loads were recorded until the beginning of January and the most active period was from mid-January to the end of March.
The highest pressure recorded on a load panel zone was from a panel installed from 1.0 to 1.5 m above the Lowest Astronomical Tide (LAT) and the pressure was 1230 kPa at a temperature of -40.3 ̊C. Colder temperatures result in an increase in ice pressures measured at the site and increasing maximum pressures observed. For the load panels installed in the middle of the tidal range, from 0.5 to 1.5 m above the LAT, the maximum pressure appears to be applied when the tide is 0.4 to 0.6 m above the centre of the 0.5 m high load panel zone, or 15 to 35 cm above the top of the zone. The maximum ice pressures are concentrated towards higher tides and the panels are loaded twice as often for the waxing (increasing) than for the waning (decreasing) tides.
The system continues to acquire data on the ice loading at the Nanisivik Naval Facility. The NRC plans to continue to study those loads so long as the system continues to provide data. These efforts aim to inform the maintenance of the facility and the design of future projects in the region.
ACKNOWLEDGEMENTS
The authors would like to acknowledge the support from the Department of National Defence, Defence Construction Canada, Advisian, Almiq Contracting Ltd., Pagui Inc., The Nunavut Research Institute, and NRC colleagues Dave Hnatiw, Yvan Brunet and Malick Kouamé.
REFERENCES
Brown, J., Poirier, L., & Frederking, R., 2019. Formation and Dynamics of an Ice Bustle at the Nanisivik Wharf, Proceedings of the 25th International Conference on Port and Ocean Engineering under Arctic Conditions, Delft, The Netherlands, June 9-13, 2019.
Fisheries and Oceans Canada, 2018. 7 Days Tidal Predictions, Reference: Chart Datum,
Strathcona Sound (#5860) [Online] Available at: https://www.waterlevels.gc.ca/eng/station?
sid=5860 [Accessed 5 March 2019].
Frederking, R., & Sayed, M., 1988, Ice Forces on the Nanisivik Wharf, IAHR Symposium 1988, Sapporo, Japan, August 23 – 27, 1988.
Frederking, R., & Sinha, N.K., 1978. Ice Action on Wharf at Strathcona Sound, Proceedings
of the 4th International Conference on Port and Ocean Engineering under Arctic Conditions,
St. John’s, NF, Canada, September 26-30, 1977.
Girgrah, M., & Shah, V.K., 1977. Construction of a Deep-Sea Dock in the Arctic, Proceedings
of the 4th International Conference on Port and Ocean Engineering under Arctic Conditions,
St. John’s, NF, Canada, September 26-30, 1977.
Lackenbauer, P.W., & Lajeunesse, A., 2016. The Canadian Armed Forces in the Arctic: Building Appropriate Capabilities, J. Milit, Strateg. Stud. Vol. 16(4), pp.7-66.
Surface Summary of the Day – GSOD, National Centers of Environmental Information &
National Climatic Data Center, NESDIS, NOAA, U.S. Department of Commerce, Last Modified:
November 1, 2018.
Masterson, D.M. & Frederking, R.M.W., 1993. Local contact pressures in ship/ice and structure/ice interactions, Cold Regions Science and Technology, Vol. 21, pp.169-185.
Poirier, L., Brown, J., & Frederking, R., 2018. Environmental Monitoring and Ice Forces on the Nanisivik Naval Facility, National Research Council Canada – Technical Report, Ottawa, ON, OCRE-TR-2018-028.
Seavey, D., Kullmann, H., Taylor, B., McQuinn, D., & Waltson, R., 2013. Stability Challenge for a Wharf in the High Arctic, Proceedings of the 10th International Symposium on Cold Regions Development, Anchorage, AK, USA, June 2-5, 2013.