Publisher’s version / Version de l'éditeur:
Vous avez des questions? Nous pouvons vous aider. Pour communiquer directement avec un auteur, consultez la première page de la revue dans laquelle son article a été publié afin de trouver ses coordonnées. Si vous n’arrivez pas à les repérer, communiquez avec nous à PublicationsArchive-ArchivesPublications@nrc-cnrc.gc.ca. Questions? Contact the NRC Publications Archive team at
PublicationsArchive-ArchivesPublications@nrc-cnrc.gc.ca. If you wish to email the authors directly, please see the first page of the publication for their contact information.
https://publications-cnrc.canada.ca/fra/droits
L’accès à ce site Web et l’utilisation de son contenu sont assujettis aux conditions présentées dans le site LISEZ CES CONDITIONS ATTENTIVEMENT AVANT D’UTILISER CE SITE WEB.
IEEE Instrumentation and Measurement Technology Conference(IMTC2005)
[Proceedings], 2005
READ THESE TERMS AND CONDITIONS CAREFULLY BEFORE USING THIS WEBSITE. https://nrc-publications.canada.ca/eng/copyright
NRC Publications Archive Record / Notice des Archives des publications du CNRC :
https://nrc-publications.canada.ca/eng/view/object/?id=24405451-c6de-4c51-baac-c1776377ff50
https://publications-cnrc.canada.ca/fra/voir/objet/?id=24405451-c6de-4c51-baac-c1776377ff50
NRC Publications Archive
Archives des publications du CNRC
This publication could be one of several versions: author’s original, accepted manuscript or the publisher’s version. / La version de cette publication peut être l’une des suivantes : la version prépublication de l’auteur, la version acceptée du manuscrit ou la version de l’éditeur.
Access and use of this website and the material on it are subject to the Terms and Conditions set forth at
Anthropometric Calibration of Virtual Mannequins through Cluster
Analysis and Content-based Retrieval of 3-D Body Scans
National Research Council Canada Institute for Information Technology Conseil national de recherches Canada Institut de technologie de l'information
Anthropometric Calibration of Virtual Mannequins
Through Cluster Analysis and Content-based
Retrieval of 3-D Body Scans *
Viktor, H.L., Paquet, E.
May 2005
* published in IEEE Instrumentation and Measurement Technology Conference (IMTC2005). Ottawa, Ontario, Canada. May 17-19, 2005. NRC 47439.
Copyright 2005 by
National Research Council of Canada
Permission is granted to quote short excerpts and to reproduce figures and tables from this report, provided that the source of such material is fully acknowledged.
IMTC 2005 – Instrumentation and Measurement Technology Conference
Ottawa, Canada, 17-19 May 2005
Anthropometric Calibration of Virtual Mannequins through Cluster Analysis and
Content-based Retrieval of 3-D Body Scans
Eric Paquet
1, Herna L Viktor
2 1Visual Information Technology, National Research Council, M50 Montreal Road, Ottawa, K1A 0R6, Canada
Phone: +1 (613) 991-5035, Fax: +1 (613) 952-0215, Email: eric.paquet@nrc-cnrc.ca.ca 2
School of IT and Engineering, University of Ottawa 800 King Edward Ave., Ottawa, K1N 6N5, Ontario, Canada
Phone: +1 (613) 562-2800-2341, Fax: +1 (613) 562-5664, Email: hlviktor@site.uotawa.ca
Abstract – Computer generated models of the human body generally do not adequately model the complex human morphology. These models therefore do not reflect the anthropometric realities and are not specific enough for commercial use. This paper presents an approach to calibrate virtual models through the use of body measurements as obtained from an anthropometric data set. In this approach, the measurements are used to group three-dimensional body scans into clusters. The virtual mannequins are then calibrated by using the measurements of nearest cluster member. In this way, highly realistic, accurate virtual mannequins are created.
I. INTRODUCTION
The calibration of virtual models to fit real world measurements provides an important challenge to the research community. In particular, computer generated models of the human body usually do not adequately model the complex human morphology. The modelling of a large number of detailed and interrelated characteristics, such as knee height, head circumference, hip breadth and foot length, to name but a few, are difficult. This may lead to virtual models which do not reflect anthropometric realities and are therefore not specific enough for commercial use.
The concept of a virtual mannequin has many applications in e.g. commerce and design. For example, consider an e-commerce website used to sell clothes to consumers. To aid the consumer to purchase clothes with an accurate fit, a virtual mannequin is generated, based on the parameters as entered by the consumer. It is important that the resultant model is not only aesthetically pleasing, but fits the clothes properly. That is, it should be ensured that the virtual mannequins are anthropometrically correct. Otherwise, the consumer may either take his business elsewhere, or the number of goods being returned may be unacceptability high. The use of cluster analysis to calibrate the virtual mannequin through the use of an existing database of accurately scanned and measured human bodies, provides a novel approach to address this problem.
Cluster analysis is a data mining technique that deals with the extraction of the implicit knowledge, data relationships or other patterns not explicitly stored in databases, by grouping related records together [1, 2]. A cluster is a collection of
objects that are similar to one another and are dissimilar to the objects in other clusters. The goal of clustering is to find inter-cluster similarity and intra-cluster dissimilarity, through the discovery of a hidden pattern that gives meaningful groups (clusters) of objects. A number of clustering techniques exist, varying in the amount of a-priori knowledge required, the scalability, the number of clusters which can be found and the data types supported [1-6].
This paper describes an approach to calibrate virtual models through the use of cluster analysis against a highly accurate database containing body measurements as well as 3-D scans of human subjects. This a priori knowledge about the measurements of typical human bodies is used to produce highly accurate, realistic virtual mannequins. Section 2 provides an overview of the CAESAR™ database used in this research and discusses the global indexing approach used to describe the 3-D body scans. In Section 3, the method used to calibrate the virtual mannequins is discussed. Section4 concludes the paper.
II. CAESAR™ DATABASE
The CAESAR™ Project is an international anthropometric survey that was carried on in the United States, Italy, Netherlands and Canada. This survey involved thousands of individuals in each country. For each individual, a series of highly accurate anthropometric measurements was performed and questions of demographic nature were recorded such as family income, car brand, perception of height, etc. What makes the originality of this survey is that each person was scanned in three dimensions using a full body scanner. Different types of technologies were used but they are all built around the same principles: a few laser scanners move along a rigid frame and capture a full body scan in a few seconds. Each subject was scanned in three different postures [7, 8]. The CAESAR™ Project is sponsored by the US Air Force and involves about 40 contributing multinational companies mainly from the transportation and the apparel industry. The main aim of this project is to provide better fitting commercial products, including cars and clothing.
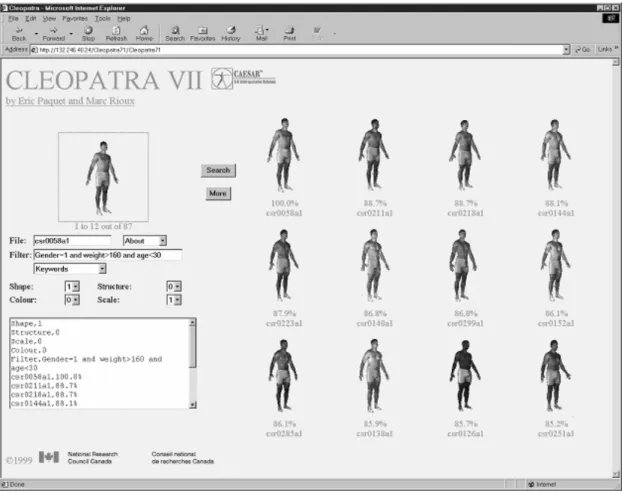
Fig. 1. An example of 3-D human body scans as contained in the CAESAR™ database.
Anthropometry is the study of human body measurements (height, weight, size, proportions, etc.) and its biomechanical characteristics. Anthropometric data refer to a collection of physical dimensions of a human body. The aim of anthropometry is therefore to characterize the human body by a set of measurements. In particular, for each of the individuals scanned, the CAESAR™ anthropometric database contains forty-nine body measurements, including details such as the arm length (spine to wrist, shoulder to wrist and elbow to wrist), the shoulder breadth, the acromial height (sitting), the triceps skinfold, the waist circumference, the ankle circumference and the eye height. This database thus represents a detailed and accurately measured subset of the typical human morphology, together with a 3-D body scan which maps these measurements.
Figure 1 shows some of the body scans as retrieved via the Cleopatra interface, which is used to query and retrieve data from the CAESAR™ database.
The 3-D body scans are described using a global shape-based descriptor, which is an abstract and compact representation of the three-dimensional shape of the corresponding body [9, 10]. The descriptor is computed as follow. Firstly, a scale, translation, rotation and reflection invariant reference frame is calculated from the principal axis
of the tensor of inertia of the human body. The principal axes correspond to the Eigen vectors of the tensor of inertia. It can be shown that the normalized principal axes are translation, scale and rotation invariant. By applying a suitable transformation, reflection invariance can be obtained. The axes of the reference frame are identified or labelled by their corresponding Eigen values.
The three-dimensional shape descriptor is based on the concept of a cord. A cord is defined as a vector that goes from the centre of mass of the human body to the centre of mass of a given triangle modelling its surface. It is thus assumed that a triangular mesh represents the surface of the human body. The distribution of the cords is represented by three histograms. The first histogram represents the angular distribution between the cords and the Eigen vector with the highest Eigen value. The second histogram represents the angular distribution between the cords and the Eigen vector with the second highest value. The distribution of the radii is represented by a third histogram. This histogram is scale-dependent, but it can be made scale-independent by normalizing the scale based either on the maximum radius or on the average radius. Note that all descriptors must have an identical normalization in order to be comparable.
III. CALIBRATING VIRTUAL MANNEQUINS This section describes the system used to calibrate the virtual mannequins, from an anthropometric point of view, through the use of cluster analysis against the CAESAR™ body measurement data.
The aim of this research was to calibrate virtual mannequins to be used by the consumers of an e-commerce website. Here, the virtual mannequins may be used by the consumer in order to see the fit thereof against his/her body. It is therefore important that the mannequin is morphologically accurate, in order to ensure that the consumer has a realistic view of how the clothes will fit his/her body type. Otherwise, the number of dissatisfied consumers (and clothing returns) may be unacceptably high.
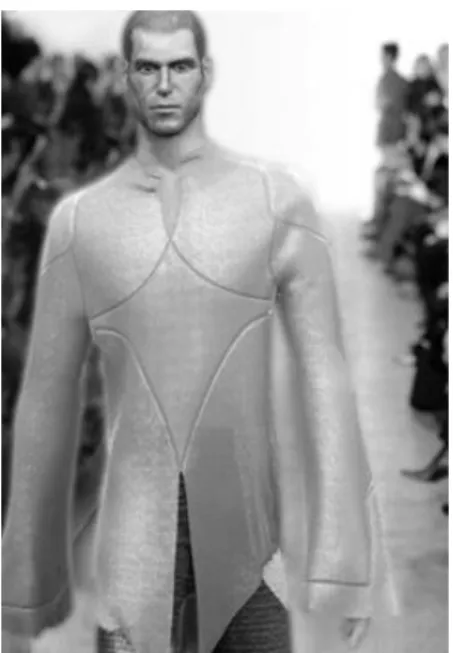
Fig. 2. An example of a virtual mannequin [11]
We completed this research using the National Research Council of Canada (NRC) Cleopatra multimedia data mining system to access the 3-D body scans and to verify the quality of the end results. The WEKA data mining system, a Java-based knowledge learning and analysis environment developed at the University of Waikato in New Zealand, was used to cluster the data [12]. We present the results of our experimentation when calibrating male virtual mannequins here.
Consider a collection of aesthetically pleasing computer-generated virtual mannequins, similar to the one depicted in Figure 2. These virtual mannequins are based on a limited number of user-specific criteria, such as waist circumference, chest and weight [13]. Table I shows the ‘ideal” male body measurements and clothing sizes used to produce clothing to fit the male population. However, inspection of the typical body measurements of the male population, as contained in the CAESAR™ database, shows that the population does not fit this ideal. Subsequently, the mannequin calibration system
proceeds to calibrate these virtual mannequins against the CAESAR™ database, as follows.
Table I. Ideal body measures for standard clothing sizes [13]. Small Medium Large X-Large XX-Large
34 36 38 40 42 44 46 48 50 52 Chest 87 92 97 102 107 112 117 122 127 132 Waist 71 76 81 87 92 97 107 112 117 122 Hip 89 94 99 104 109 114 119 124 130 135 Neck 35.5 37 38 39.5 40.5 42 43 44.5 46 47 Sleeve 81 81 84 84 87 87 89 89 91 91 Stature 178 178 178 178 178 178 178 1.78 1.78 1.78
Table II. A subset of the body measurements contained in the CAESAR™ database.
Measurement Measurement
Acromial Height Sitting Spine to Shoulder Length
Ankle Circumference Spine to Elbow Length
Arm Length: Spine to Wrist Arm Length: Shoulder to Wrist
Arm Length: Shoulder to Elbow Arm Circumference
Bust Chest Circumference Buttock Knee Length
Crotch Height Eye Height Sitting
Face Length Foot Length
Hand Length Shoulder Breadth
Sitting Height Vertical Trunk Circumference
Triceps Skinfold Head Circumference
Knee Height Sitting Thumb Tip Reach
Head Breadth Hand Circumference
Firstly, the 3-D body scans were grouped into a user-specified number of clusters, formed through the clustering of the anthropometric data. For this research, initially the number of available clothes sizes, i.e. five sizes, to denote small, medium, large, extra-large and extra-extra-large, was used as parameter.
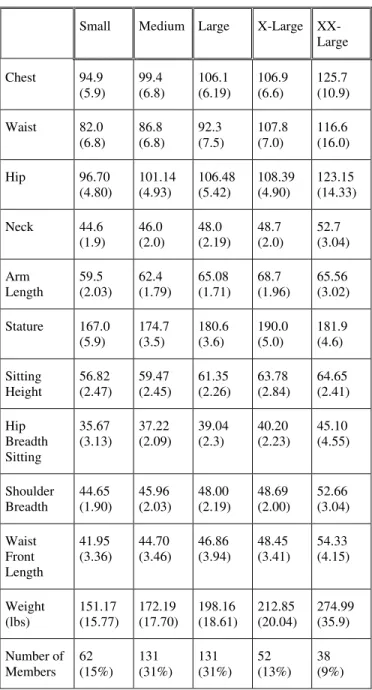
Table III. Body measurements of cluster Centriods as contained in the CAESAR™ database.
Small Medium Large X-Large XX-Large Chest 94.9 (5.9) 99.4 (6.8) 106.1 (6.19) 106.9 (6.6) 125.7 (10.9) Waist 82.0 (6.8) 86.8 (6.8) 92.3 (7.5) 107.8 (7.0) 116.6 (16.0) Hip 96.70 (4.80) 101.14 (4.93) 106.48 (5.42) 108.39 (4.90) 123.15 (14.33) Neck 44.6 (1.9) 46.0 (2.0) 48.0 (2.19) 48.7 (2.0) 52.7 (3.04) Arm Length 59.5 (2.03) 62.4 (1.79) 65.08 (1.71) 68.7 (1.96) 65.56 (3.02) Stature 167.0 (5.9) 174.7 (3.5) 180.6 (3.6) 190.0 (5.0) 181.9 (4.6) Sitting Height 56.82 (2.47) 59.47 (2.45) 61.35 (2.26) 63.78 (2.84) 64.65 (2.41) Hip Breadth Sitting 35.67 (3.13) 37.22 (2.09) 39.04 (2.3) 40.20 (2.23) 45.10 (4.55) Shoulder Breadth 44.65 (1.90) 45.96 (2.03) 48.00 (2.19) 48.69 (2.00) 52.66 (3.04) Waist Front Length 41.95 (3.36) 44.70 (3.46) 46.86 (3.94) 48.45 (3.41) 54.33 (4.15) Weight (lbs) 151.17 (15.77) 172.19 (17.70) 198.16 (18.61) 212.85 (20.04) 274.99 (35.9) Number of Members 62 (15%) 131 (31%) 131 (31%) 52 (13%) 38 (9%)
The data set consisted of the 3-D body scan of the male subject facing the scanner, together with 49 anthropometric measures. A total of 418 male subjects were used. Table II shows a subset of the body measurements which were recorded. The table shows that numerous details, such as the length of the face, the knee height sitting and the length between the buttocks and knees, were measures. Initially, a number of clustering algorithms was applied to the data. These included the EM algorithm, the CobWeb method and the farthest first approach [12]. Also, an algorithm using a variation of the density-based clustering algorithm with simple k-means component classifiers was employed. By inspection, however, the simple k-means classifier algorithm
was found to produce the best clusters, when evaluated in terms of cluster membership. In this approach, the number of initial clusters and the initial centroid of each cluster are randomly selected. Next, descriptors are assigned to their closest cluster centre and the new mean value is calculated. This iterative process continues until the data are assigned to each cluster in consecutive rounds. At this point, the cluster centres are thus stabilized and finalized.
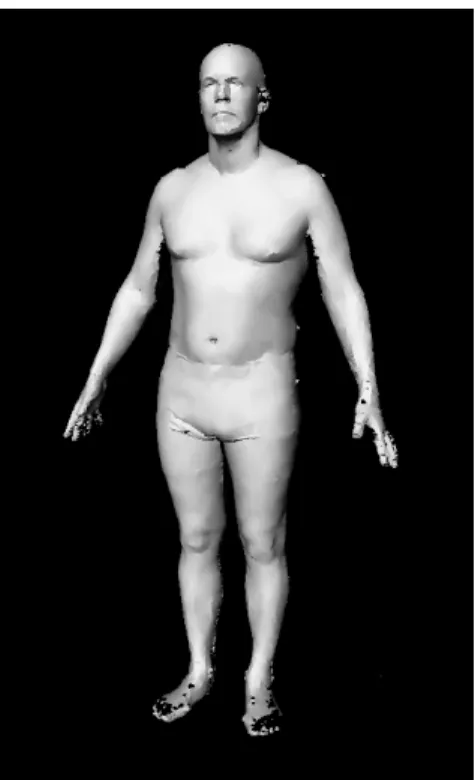
Fig. 3. The 3-D Body Scans of the Centroids of the five clusters, from size Small (top left) to Extra-extra-large (bottom right).
The clustering algorithm input the body measurements and the number of clusters five (5) to be formed. It proceeded to construct the clusters and outputs five groupings, based on these measurements. Table III shows a subset of the body measures of the Centriods of the five clusters of the male population. Shown are the means (in cm) and standard deviations of each of the clusters and the number of cluster members.
The bodies of the human subjects who correspond to these measurements are shown in Figure 3. It is interesting to note that, when e.g. distinguishing between large and extra-Large subjects within the male population, the chest and hip circumferences do not differ substantially. Rather, the waist circumference and stature is of importance here. This reality is not reflected in the “ideal” clothing sizes and is thus an important factor to consider when calibrating the virtual mannequins.
Next, the 3-D body scan clusters are used to calibrate the virtual mannequins. The virtual mannequins that fit within a cluster are retained, while outliers were discarded. The 3-D body scan of the human subject which is closest to the virtual mannequin is retrieved and was subsequently used to calibrate the virtual mannequin. For example, the breadth of the hips and the length of the legs of the virtual mannequin may be updated to more realistically reflect the typical human body.
Fig. 4. An example of a realistic virtual mannequin corresponding to the Large clothing size.
Figure 4 shows a resultant virtual mannequin for the large clothing size. The original mannequin, with measurements chest, waist, hip and stature of 112, 97, 114 and 178 (in cm), respectively, was calibrated by obtaining the nearest human body measurements. In this figure, the chest, waist, hip and stature measurements of the resultant mannequin are set to 112.4, 95.2, 114.0 and 185.4 (in cm), respectively. That is, the chest and waist measurements were slightly reduced, whilst the stature was increased. The number of virtual mannequins generated for each cluster is user-specified, but should be at least one.
The final set of virtual mannequins can now be placed in a database to be used when the e-commerce site is visited by consumers. When a consumer enters his data, the virtual mannequin that is closest to his measurements is selected and displayed. The consumer then proceeds to use this virtual mannequin to try on clothes to see the fit thereof against a realistic, aesthetically pleasing representation of his own body.
IV. CONCLUSION
This paper described a novel approach which used the detailed body measurements and 3-D body scans of human subjects to calibrate virtual, computer-generated models of the human body. Through the use of clustering and the matching of the initial virtual models with 3-D body scans, the virtual mannequins were calibrated to realistically represent the typical human body. In summary, the advantage of using a cluster analysis approach is that we can detect the natural groups, in the form of clusters, as based on accurate body measurements. Subsequently, we are able to use these grouping to produce computer-generated models that correspond to the 3-D scan of an existing human subject and are thus anthropometrically correct.
For many applications, such as marketing, it is important to note the interrelationship between demographic and anthropometric attributes when considering e.g. the level of family income. Current and future research includes the investigation of the demographic profiles of the members of the individual clusters in order to obtain new insights into the male population [14]. The results of this research has commercial application, e.g. to aid designer when designing a luxury car or clothing for low income males within a certain age range, amongst others. Another important issue that needs to be further investigated is ensuring the correct fit of the clothes against the resultant mannequins, as discussed in [15].
REFERENCES
[1] J. Han and M. Kamber, Data Mining: Concepts and Techniques. Morgan Kaufman Publishers, USA. 2001.
[2] P. Berkhin, Survey of Clustering Data Mining Techniques. Accrue Software Inc., San Jose, CA, USA. 2002.
[3] Y. Zhao and G. Karypis, Clustering in Life Sciences. In "Functional Genomics: Methods in Molecular Biology”. Humana Press, New Jersey, USA. 2003.
[4] E. Kolatch, Clustering Algorithms for Spatial Databases: A Survey. Department of Computer Science, University of Maryland, USA. 2001. [5] L. Kaufman and P. Roussoouw, Finding Groups in Data: An Introduction to Cluster Analysis. John Wiley Sons, New York, USA. 1990.
[6] O. Abdali, H.L. Viktor, E. Paquet and M. Rioux, Exploring anthropometric data through cluster analysis, the 2004 SAE Digital Human Modeling for Design and Engineering Symposium, Oakland University, Rochester, Michigan, June 15-17, 2004.
[7] E. Paquet and M. Rioux, Anthropometric Visual Data Mining: A Content-Based Approach, IEA 2003 - International Ergonomics Association XVth Triennial Congress, Seoul, South Korea. August 24-29, 2003.
[8] E. Paquet, K. Robinette and M. Rioux, Management of Three-dimensional and Anthropometric Databases: Alexandria and Cleopatra. Journal of Electronic Imaging, Volume 9(4). October 2000.
[9] E. Paquet and M. Rioux, Nefertiti: A query by content system for three-dimensional model and image databases management. Image and
Vision Computing, 17, pp. 157-166, 1999.
[10] V.D.V Verma et. al., Content-based search for 3-D-objects, Proceedings of the 4th International Conference on Computational Intelligence and Multimedia Applications, p.266-270, 2001.
[11] Virtual Fashion, http://www.virtual-fashion.com/en/
[12] I.H. Witten and E. Frank, Data mining: Practical machine learning tools and techniques with Java implementations, Morgan Kaufmann Press, 2000.
[13] J. M. Winks, Clothing sizes: International standardization. The Textile Institute. UK: Redwood Books, 1997.
[14] HL Viktor and E Paquet, A multi-strategy approach for mining multimedia repositories, to be presented at Data Mining 2005, Skiathos; Greece, May 2005.
[15] L. Chittaro and D. Corvaglia, 3D Virtual Clothing: from Garment Design to Web3D Visualization and Simulation, Proceedings of Web3D 2003: 8th International Conference on 3D Web Technology, ACM Press, New York, March 2003, pp.73-84.