Publisher’s version / Version de l'éditeur:
Questions? Contact the NRC Publications Archive team at
[email protected]. If you wish to email the authors directly, please see the first page of the publication for their contact information.
https://publications-cnrc.canada.ca/fra/droits
L’accès à ce site Web et l’utilisation de son contenu sont assujettis aux conditions présentées dans le site LISEZ CES CONDITIONS ATTENTIVEMENT AVANT D’UTILISER CE SITE WEB.
Research Report (National Research Council of Canada. Construction); no.
RR-335, 2020-01-08
READ THESE TERMS AND CONDITIONS CAREFULLY BEFORE USING THIS WEBSITE.
https://nrc-publications.canada.ca/eng/copyright
NRC Publications Archive Record / Notice des Archives des publications du CNRC : https://nrc-publications.canada.ca/eng/view/object/?id=e38fb723-6a4c-4a78-9e47-5a73c92c448f https://publications-cnrc.canada.ca/fra/voir/objet/?id=e38fb723-6a4c-4a78-9e47-5a73c92c448f
Archives des publications du CNRC
For the publisher’s version, please access the DOI link below./ Pour consulter la version de l’éditeur, utilisez le lien DOI ci-dessous.
https://doi.org/10.4224/40001816
Access and use of this website and the material on it are subject to the Terms and Conditions set forth at
Apparent sound insulation in mass timber buildings
RR-335
Apparent Sound Insulation
in Mass Timber Buildings
Jeffrey Mahn, David Quirt, Markus Mueller-Trapet,
Christoph Hoeller
January 2020
Construction
Scope
This Report presents the results from experimental studies of the airborne sound transmission of mass timber assemblies, together with an explanation of the calculation procedures to predict the apparent sound transmission class (ASTC) rating between adjacent spaces in a building constructed of mass timber assemblies.
The experimental data which is the foundation for this Report includes the laboratory measured sound transmission loss of wall and floor assemblies constructed of Cross Laminated Timber (CLT), Nail-Laminated Timber (NLT) and Dowel-Laminated Timber (DLT), and the laboratory measured vibration reduction index between assemblies of junctions between CLT assemblies. The presentation of the measured data is combined with the presentation of the appropriate calculation procedures to determine the ASTC rating in buildings comprised of such assemblies along with numerous worked examples.
Several types of CLT constructions are commercially available in Canada, but this study focused on CLT assemblies with an adhesive applied between the faces of the timber elements in adjacent layers, but no adhesive bonding between the adjacent timber elements within a given layer. These CLT
assemblies ould e alled Fa e-Laminated CLT Assemblies but are simply referred to as CLT
assemblies in this Report. Another form of CLT assemblies does have adhesive applied between the faces of the timber elements in adjacent layers as well as adhesive to bond the adjacent timber
elements within a given layer. These assemblies a e efe ed to as Full -Bonded CLT Assemblies i
this Report. Because fully-bonded CLT assemblies have different properties than face-laminated CLT assemblies, the sound transmission data and predictions in this Report do not apply to fully-bonded CLT assemblies.
Disclaimer
Although it is not repeated at every step of this Report, it should be understood that some variation in sound insulation is to be expected in practice due to changes in the specific design details,
workma ship, su stitutio of ge e i e ui ale ts , or simply rebuilding the construction. It would be
prudent to allow a margin of error of several ASTC points to ensure that a design will satisfy a specific requirement.
Despite this caveat, the authors believe that methods and results shown here do provide a good estimate of the apparent sound insulation for the types of constructions presented.
Changes from the First Edition (2017) of Research Report RR-335:
1. The most significant change from the first edition of RR-335 is the addition of test data for direct sound transmission through Nail-Laminated Timber (NLT) and Dowel-Laminated Timber (DLT) assemblies including data for linings. Although there are appreciable differences among the acoustic results for the three variants of mass timber assemblies, they have strong similarities in their behaviour.
2. For consistency with nomenclature for other types of materials which include the thickness of the assembly as the primary identifier, the descriptors for CLT assemblies have been changed. For example, the descriptor for the 5-ply CLT assembly has been changed from CLT05 to CLT175(5) to identify it by the thickness (in mm) and the number of layers.
3. Despite the addition of data for NLT and DLT assemblies, the ASTC calculations in Chapter 4 are restricted to examples for CLT construction because data for the vibration transmission at junctions of DLT or NLT assemblies is currently not available. As more data becomes available, more calculation details and examples for these assemblies will be included in future editions of this Report.
4. The explanatory material in Chapter 1 and at the beginning of Chapter 4 has been revised to maintain consistency with the fifth edition of The Guide RR-331 which addresses the calculation of the ASTC rating for many common types of constructions.
Acknowledgments
The research studies on which this Report is based were supported by a group of industry partners: Canadian Wood Council, Natural Resources Canada (NRCan), Building Regulations for Market Access Program at the National Research Council Canada, FPInnovations, Régime du bâtiment du Québec, HER MAJESTY THE QUEEN IN RIGHT OF ONTARIO as represented by the Minister of Municipal Affairs and Housing. The development of this Report was supported by the Canadian Wood Council. The financial support is gratefully acknowledged.
In addition, the contribution of several individuals who contributed to this report is acknowledged. Stefan Schoenwald, Berndt Zeitler and Ineke Van Zeeland contributed to the first edition of this Report. Jonathan Hamelin, Ivan Sabourin, Stefan Schoenwald, Julie McIntyre, Steven Kruithof, Ryan Moloughney, Vince Iacovitti, David Klein and Theresa Reif contributed to the collection of the measurement data included in this Report.
Contents
1 Sound Transmission via Many Paths ...1
1.1 Predicting Sound Transmission in a Building ... 3
1.2 Applying the Concepts of ISO Standards in an ASTM Environment ... 4
1.3 Combining Sound Transmitted via Many Paths ... 7
2 Sound Transmission through Laminated Timber Walls and Floors ... 11
2.1 Sound Transmission through CLT Wall and Floor Assemblies ... 13
2.2 Sound Transmission through NLT Wall and Floor Assemblies ... 41
2.3 Sound Transmission through DLT Wall and Floor Assemblies ... 62
3 Flanking Sound Transmission in CLT Constructions... 83
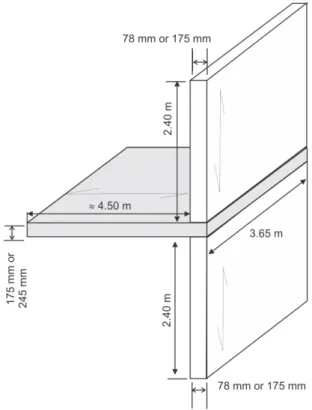
3.1 Junctions of CLT Floors with CLT Walls ... 87
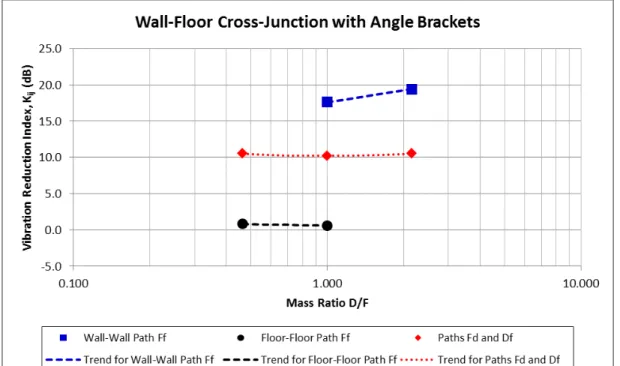
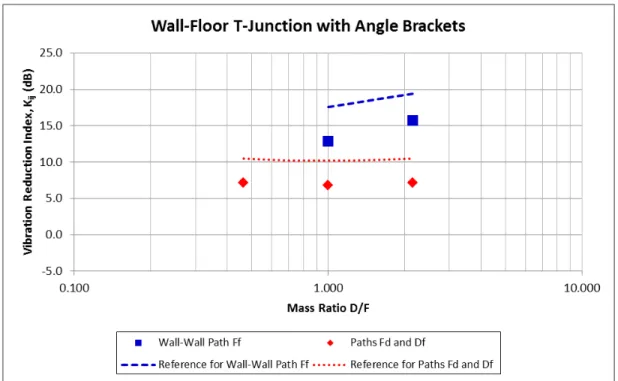
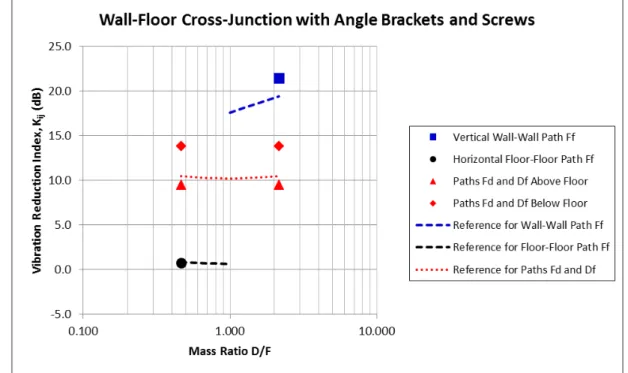
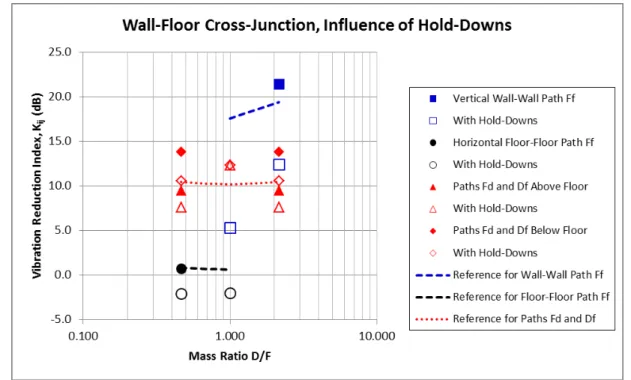
3.2 Trends in the Vibration Reduction Index for the Floor-Wall Junctions ... 95
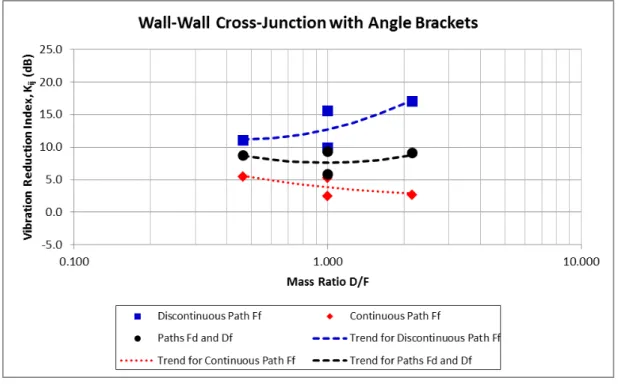
3.3 Trends in the Vibration Reduction Index for Wall-Wall Junctions ... 101
3.4 Trends in Junction Attenuation for Wall-Wall Junctions ... 106
3.5 Extensions to Include Junction Cases That Have Not Been Tested ... 109
4 Predicting Sound Transmission in Cross-laminated Timber Buildings ... 110
4.1 Simplified ASTC Calculation Procedure for CLT Walls and Floors ... 120
4.2 Detailed Calculation Procedure for Cross-laminated Timber Constructions ... 135
5 Appendices of Sound Transmission Data ... 149
Appendix A1.1: Sound Transmission Data for CLT Wall and Floor Assemblies ... 151
Appendix A1.2: Sound Transmission Data for NLT Wall and Floor Assemblies ... 159
Appendix A1.3: Sound Transmission Data for DLT Wall and Floor Assemblies ... 171
Appendix A2: Cal ulati g the Δ“TC Rati g fo Li i gs o La i ated-Timber Assemblies ... 178
1 Sound Transmission via Many Paths
The simplest approach to controlling sound transmission between adjacent rooms in buildings considers only the sound transmission through the separating wall or floor between the rooms. This approach has been entrenched in North American building codes which for many decades have only included requirements for the single number ratings for the common assembly between dwellings. The single number ratings used by this approach have been the sound transmission class (STC) rating for airborne sources and the impact insulation class (IIC) rating for footstep noise.
Implicit in this approach is the simplistic assumption that sound is only transmitted through the
separating assembly between rooms – the separating wall assembly when the rooms are side-by-side as
illustrated in Figure 1.1 or the floor/ceiling assembly when rooms are one-above-the-other. Under this approach, if there is a noise complaint, the problem is often incorrectly attributed to errors in either the design of the separating assembly or the workmanship of those who built it and remediation only focusses on that assembly.
Figure 1.1: A cross-section through two
side-by-side rooms of a building showing the historic perspective that sound from an airborne noise source (represented by the red loudspeaker in the drawings but could include anything from a home theatre to people talking loudly) is only transmitted directly through the separating assembly between the rooms (in this case the wall).
Figure 1.2: This figure shows that in reality, there
are many paths for sound transmission between
adjacent rooms including both direct
transmission through the separating assembly and indirect flanking paths, a few of which are shown in the figure. The flanking paths usually
significantly affect the overall sound
transmission. See Section 1.4 for more details about the different paths.
In reality, the technical issue is more complex, as illustrated in Figure 1.2. There is direct transmission of sound through the separating assembly, but that is only part of the story of how sound is transmitted between the adjacent rooms. As shown in the figure, the airborne sound source excites all the surfaces in the source room and all of these surfaces vibrate in response. Some of this vibrational energy is transmitted as structure-borne sound across the surfaces abutting the separating assembly, through the junctions where these surfaces join the separating assembly, and into the surfaces of the adjoining room. The surfaces in the adjoining room then radiate part of the vibrational energy as airborne sound.
Transmission through wall Airborne Sound Source Separating assembly Transmission through wall Airborne Sound Source Separating assembly Flanking Transmission via ceiling surfaces Transmission through wall Airborne Sound Source Flanking Transmission via floor surfaces Flanking Transmission
via ceiling surfaces Transmission through wall Airborne Sound Source Flanking Transmission via floor surfaces
The occupants of the adjacent room hear the combination of the radiated sound due to the direct transmission through the separating assembly plus the radiated sounds due to structure-borne flanking transmission involving all the other elements coupled to the separating assembly. There may also be the transmission of sound through leaks (openings) in the walls. Therefore, it follows that in reality, the sound insulation between adjacent rooms is always worse than just the sound insulation of the separating assembly. The importance of including all of the transmission paths has long been recognized
in principle and the fundamental science was largely explaineddecades ago by Cremer et al. [8].
Whereas the STC rating is used as the single number rating for sound transmitted only through a wall or floor, there is a single number rating called the apparent sound transmission class (ASTC) rating which includes the contribution of the sound transmitted directly through the separating assembly plus the sound transmitted by all of the flanking paths. Although the measurement of the ASTC rating in a building according to the standard, ASTM E336 is quite straightforward, predicting the ASTC rating of a building is more complex. The challenge has been to reduce the complicated calculation of the sound transmission by multiple paths into manageable engineering that yields trustworthy quantitative estimates and to standardize that process to facilitate its inclusion in a regulatory framework.
For design or regulation, there are standardized frameworks for estimating the overall sound transmission which have been developed and have been in use to support performance-based European building codes. For example, in 2005, the International Organization for Standardization (ISO) published
the standard, ISO 15712- , Buildi g a ousti s — Estimation of acoustic performance of buildings from
the performance of elements — Pa t : Ai o e sou d i sulatio et ee oo s [7]. This standard is
one part of four dealing with sound transmission in buildings. In 2017, the four parts of ISO 15712 were replaced by the corresponding parts of ISO 12354. However, this Report continues to reference ISO 15712, for the reasons which will be discussed in Section 1.1.
The standard, ISO 15712-1 outlines a procedure for estimating the weighted apparent sound reduction
i de R’w) of building assemblies. The weighted apparent sound reduction index has a corresponding
rating called the apparent sound transmission class (ASTC) rating as described in the standard, ASTM E336 [2]. It is the ASTC rating that is used in the 2015 edition of the National Building Code of Canada as explained in detail in the NRC Report RR-331 [15].
However, there were two significant impediments to applying the standard, ISO 15712-1 in a North American context. Although ISO 15712-1 provides reliable estimates for some types of building constructions such as buildings with concrete floors and concrete or masonry walls, the estimates are more difficult to make for the lightweight framed construction widely used for buildings in North America. Secondly, the ISO standards for building acoustics have many differences from the ASTM standards used by the construction industry in North America, both in terms of the terminology and in specific technical requirements for measurement procedures and ratings. The following sections of this chapter outline a strategy for dealing with these limitations, both explaining how to merge ASTM and ISO test data and procedures, and providing recommendations for adapting the calculation procedures
1.1 Predicting Sound Transmission in a Building
The standard, ISO 15712-1 provides reliable estimates for buildings with concrete floors and walls of solid concrete or masonry, but it is less accurate for other common types of construction, especially for constructions with a stiffness that has a directional dependence, such as wood-frame and steel-frame constructions.
ISO 15712-1 has other limitations as well. For example, especially for light frame construction, the Standard identifies situations where the detailed calculation is not appropriate, but the Standard does not provide specific guidance on how to deal with such limitations. Many of these limitations can be overcome by using measurement data for various combinations of construction types and junctions measured according the four parts of the ISO 10848 standard [6]. The 2015 edition of the National Building Code of Canada (NBCC) addresses these limitations of ISO 15712-1 by specifying the suitable procedures and test data to calculate the ASTC rating for different types of construction, with direct references to ISO 15712-1 and the ISO 10848 series.
The type of attached wall and floor assemblies dictates both the required input data and the steps of the standardized procedures required to calculate the ASTC rating. This Report is restricted to the calculation of the ASTC rating for buildings where the walls have a structure of mass timber, and these walls are attached to other walls of mass timber or to floors of mass timber. The common cases are explained in Chapters 2 to 4 of this Report. This Report indicates which equations from ISO 15712-1 apply in each context and provides key adaptations of the ISO expressions needed to apply the concepts in an ASTM context.
It is important to note that in 2017, the 4 parts of ISO 15712 were replaced by the corresponding parts of ISO 12354. The procedures in ISO 12354-1 are equivalent to those of ISO 15712-1 and resolve most of the concerns identified in the preceding paragraphs. At the time of preparing this Report, the NBCC had not been updated to replace the references to ISO 15712-1 with the corresponding links to the new ISO 12354-1. For consistency with the NBCC, this Report outlines the steps of the standardized calculation procedures with references to ISO 15712-1. Referencing ISO 12354-1 would have negligible impact on the contents of this Report other than the different number of the referenced standard.
1.2 Applying the Concepts of ISO Standards in an ASTM Environment
In Canada, the direct sound transmission loss of building elements is normally tested according to the standard, ASTM E90 [1]. The acoustic requirements in the National Building Code of Canada are given in terms of the apparent sound transmission class (ASTC) rating which is determined from the apparent sound transmission loss (ATL) which includes contributions from both the direct sound transmission and the flanking transmission for the set of frequency bands from 125 Hz to 4000 Hz, following the procedure outlined in the standard, ASTM E413 [3].
Although the building acoustics standards developed by ASTM are very similar in concept to the corresponding ISO standards, there are differences in the terminology and the technical requirements which presents numerous barriers to using a mix of standards from the two domains. Although the ASTM standard, E336 recognizes the contribution of flanking sound transmission to the apparent sound transmission, there is neither an ASTM standard for measuring the structure-borne flanking sound transmission that often dominates sound transmission between rooms, nor an ASTM counterpart of ISO 15712-1 for predicting the combination of direct and flanking sound transmission. In the absence of suitable ASTM standards, this Report uses the procedures of ISO 15712-1 and data from the complementary ISO 10848 series for some constructions, but connects this ISO calculation framework to the ASTM terms and test data widely used by the North American construction industry. This methodology combines identifying which data from ASTM laboratory tests can reasonably be used in place of their ISO counterparts, and presenting the results using ASTM terminology (or new terminology for flanking sound transmission that is consistent with existing ASTM terms) to facilitate their use and understanding by a North American audience. Some obvious counterparts in the terminology are presented in Table 1.1.
ISO Designation Description ASTM Counterpart
ISO 10140 Parts 1 and 2 [5] (formerly ISO 140-3)
Laboratory measurement of the airborne sound transmission through a wall or floor
ASTM E90
sound reduction index, R (ISO 10140-2)
Fraction of sound power transmitted (in dB) at each frequency, in laboratory test
sound transmission loss, TL (ASTM E90) weighted sound reduction
index, Rw (ISO 717-1 [4])
Single-number rating determined from R or TL values in standard frequency bands
sound transmission class, STC (ASTM E413) apparent sound reduction
i de , R’ I“O 16283-1)
Fraction of sound power transmitted (in dB) at each frequency, including all paths in a building
apparent sound transmission loss, ATL
(ASTM E336) weighted apparent sound
edu tio i de , R’w (ISO 717-1)
Single-number ati g dete i ed f o R’
or ATL values in standard frequency bands
apparent sound transmission class, ASTC
It is i po ta t to ote that the des iptio ou te pa t does ot i pl that the A“TM a d I“O
standards or terms are exactly equivalent. For example, neither the descriptors RWa d “TC o R’W and
ASTC are interchangeable due to systematic differences in the calculation procedures. However, the laboratory tests used to measure the airborne sound transmission through wall or floor assemblies (ASTM E90 and its counterpart ISO 10140-2) are based on essentially the same procedure with minor a ia ts i fa ilit e ui e e ts. The efo e, the easu ed ua tities sou d t a s issio loss f o the A“TM E test a d sou d edu tio i de f o the I“O sta da d a e suffi ie tl similar so that data from ASTM E90 tests can be used in place of data from ISO 10140-2 tests in the calculations of ISO 15712-1 to obtain a sensible answer. Similarly, the simplified calculation of ISO 15712-1 may be
performed using STC ratings to predict the A“TC ati g. The lose pa allel et ee sou d edu tio
i de a d sou d t a s issio loss also ea s that esults f o I“O -1 calculations (normally
e p essed as R’ alues a o fide tl e t eated as al ulated appa e t sou d t a s issio loss (ATL) values and then used in the procedure of ASTM E413 to calculate the ASTC rating, which is the objective for designers or regulators in the North American context. To merge the ASTM terms with the
ISO 15712- p o edu es i this Repo t, the te s di e t sou d t a s issio loss a d fla ki g sou d
t a s issio loss ha e ee i t odu ed to p o ide o siste ith A“TM te i olog hile at hi g
the function of the direct and flanking sound reduction indices defined in ISO 15712-1.
For purposes of this Report, a glossary of new terms with counterparts in ISO 15712-1 and ISO 10848 and using terminology consistent with the measures used in ASTM standards is presented in Table 1.2. In addition, there are other scientific terms that are used at various stages of the calculation in ISO 15712-1 which are used without change in this Report. These terms include: radiation efficiency, velocity level difference, internal loss factor, total loss factor, equivalent absorption length, and transmission factor. These terms are described in the glossary found in Annex A of ISO 15712-1.
Table 1.2: Key terms used in this Report to deal with concepts from ISO 15712-1 and ISO 10848 for
which current ASTM acoustics standards have no counterparts.
Terms used in this Report Description
Structural reverberation time (TS)
The structural reverberation time is a measure indicating the rate of decay of the vibration energy in an element and can apply either to a laboratory wall or floor assembly, or to a wall or floor assembly in-situ in a building.
Sound transmission loss in-situ (TLsitu)
The sound transmission loss in-situ is the counterpart of sound reduction index in-situ (Rsitu) described in ISO 15712-1 as "the sound reduction index of an element in the actual field situation".
Change in sound t a s issio loss ΔTL
The change in sound transmission loss is the difference in sound transmission loss due to the addition of a lining on one side of a wall or floor assembly when measured according to ASTM E90, compared with the sound transmission loss of the same assembly without a lining.
Change in sound t a s issio lass Δ“TC
The change in sound transmission class is the difference in the single number rating due to a lining applied on one side of a wall or floor assembly. The calculation procedure for the Δ“TC rating is described in Appendix A2 of this Report.
Vibration reduction index (Kij)
The vibration reduction index (Kij) is described in ISO 15712-1 as the "direction-averaged vibration level difference over a junction, normalised to the junction length and the equivalent sound absorption length to make it an invariant quantity". Depending on the type of building element, Kij values may be determined using the equations of Annex E of ISO 15712-1 or the measurement procedures of ISO 10848.
Velocity level difference (VLD)
The velocity level difference (VLD) is described in ISO 15712-1 as the ju tio elo it le el diffe e e i -situ between an excited element (wall or floor) and the receiving element (wall or floo . It is al ulated by correcting the Kij value to allow for edge loss conditions (identified through structural reverberation times) of the assemblies in-situ.
Flanking sound transmission loss
(Flanking TLij)
The flanking sound transmission loss is the counterpart of flanking sound reduction index (Rij) in ISO 15712-1. It is a measure of the sound transmission loss via the flanking path from element i in the source room to element j in the receiving room, normalised like the apparent sound transmission loss.
Flanking sound transmission class
The flanking STC rating is the single number rating calculated from the flanking sound transmission loss following the STC calculation procedure
1.3 Combining Sound Transmitted via Many Paths
The calculations of ISO 15712-1 combine the sound transmitted via the direct transmission path and via a set of flanking paths. To keep track of the sound transmission paths, it is useful to introduce the labeling convention for the paths used in ISO 15712-1 and as shown in Figure 1.3.
Figure 1.3: This figure shows the labelling
convention used for the transmission paths in ISO 15712-1. Consider the transmission of airborne sound from a source room (left)
to a receiving room (right). Each
transmission path involves one surface in the source room (denoted by a capital letter) and one in the receiving room (denoted by a lower case letter). Direct
transmission through the separating
assembly is path Dd. For each edge of the separating assembly there are three flanking paths: Ff from flanking surface F to flanking surface f, Df from direct surface D to flanking surface f, and Fd from flanking surface F to direct surface d.
Note that the lette F o f de otes fla ki g su fa e, a d D o d denotes the surface for direct transmission, i.e. the surface of the separating assembly. These surfaces may be either wall or floor/ceiling assemblies.
The apparent sound transmission loss (ATL) between two rooms (assuming the rectangular room geometry used for examples in Chapter 4, and neglecting sound that is by-passing the building structure, for example sound transmitted through leaks and ducts) is the resultant of the direct sound transmission
loss (TL ) through the separating wall or floor assembly and the set of flanking sound transmission loss
contributions of the three flanking paths (TL� ,TL� , and TL ) for each junction at the four edges of
the separating assembly as shown in Fig. 1.3. This concept is presented in Equation 1.1.
� = − ∙ log [ − . ∙ ���+ ∑ ( − . ∙ ���+ − . ∙ ��� + − . ∙ ���)
4 =
] Eq. 1.1
Note that this equation differs slightly from the calculation of the apparent sound transmission loss defined in Equation 14 of ISO 15712-1. Eq. 1.1 of this Report treats the set of paths at each edge of the separating assembly in turn to match the presentation for the examples in this Report. Eq. 1.1 is universally valid for all building systems, so the only remaining challenge is to find the right expressions to calculate the sound transmission via the different paths for the chosen building system and situation. Each of the flanking sound transmission loss values for a specific path is normalized like the apparent sound transmission loss (ATL), and can be considered as the apparent sound transmission loss that would be observed if only this single path were contributing to the sound transmitted into the receiving room. Normalization of the direct and the flanking sound transmission loss input data so that the receiving room absorption is numerically equal to the area of the separating assembly (i.e. using apparent sound transmission loss and the ASTC rating as the measure of system performance) requires suitable corrections to data calculated according to ISO 15712-1, or values of flanking sound transmission loss from laboratory testing according to ISO 10848, so that the set of path sound transmission loss values can be properly combined or compared. This normalization process is described in the calculation procedures in Chapter 4 of this Report.
The standard ISO 15712-1 describes two methods of calculating the apparent sound insulation in a building: the Detailed Method and the Simplified Method. This Report describes both methods to calculate the apparent sound insulation in a building consisting of mass timber wall assemblies and mass timber floor assemblies.
The Simplified Method uses the single number ratings (STC or Flanking STC for each transmission path, as appropriate) instead of the frequency-dependent sound transmission loss values, and yields the ASTC rating directly:
� = − ∙ log [ − . ⋅ ��+ ∑ ( − . ⋅ ��+ − . ⋅ ��+ − . ⋅ ��)
4 =
] Eq. 1.2
The Simplified Method has been widely used by designers in Europe for many years for calculations based on RW data. Its primary advantage over the Detailed Method is the simplicity of the procedure which makes it usable by non-specialists as illustrated by the worked examples in Section 4.1 and Section 4.3. Although it is less rigorous than the Detailed Method presented in Section 4.2, the differences between the results using the two methods are typically small, and the calculations for the Simplified Method use approximations that should ensure the results are slightly conservative, especially so if the effect of linings is included in the calculations.
This Report provides both the single number ratings needed to calculate the ASTC rating using the Simplified Method and the corresponding sets of one-third octave band data needed for the Detailed Method for mass timber constructions.
Cautions and limitations to examples presented in this Report:
This Report was developed to support the transition to ASTC ratings for sound control objectives in the National Building Code of Canada. Simplifications were made to meet the specific needs of that application, where sound insulation is addressed only in the context of multi-unit residential buildings. The simplifications include that:
Transmission around or through the separating assembly due to leaks at its perimeter or penetrations such as ventilation systems are assumed negligible
.
Indirect airborne sound transmission (for example airborne flanking via an unblocked attic or crawl space) is assumed to be suppressed by normal fire blocking requirements.
For adjacent units in a multi-family residential building, these two issues should be dealt with by using normal good practice for fire and sound control between adjoining dwellings.
If this Report is applied to situations other than the separation between adjacent units in multi-family residential buildings, some of these issues may have to be explicitly addressed in the calculation process. For example, for adjoining rooms within a single office or home, flanking paths such as ventilation ducts or open shared plenum spaces may be an issue. The flanking sound transmission loss associated with these additional paths should be determined and included in the calculated ASTC rating. ISO 15712-1 includes specific guidance for such issues and the examples in this Report allow for such a correction.
2 Sound Transmission through Laminated Timber Walls and Floors
The direct sound transmission loss tests of wall and floor assemblies were conducted i the NRC’s Wall
and Floor Sound Transmission Facilities according to the standard, ASTM E90. Concept drawings of the sound transmission facilities are presented in Figure 2.1.
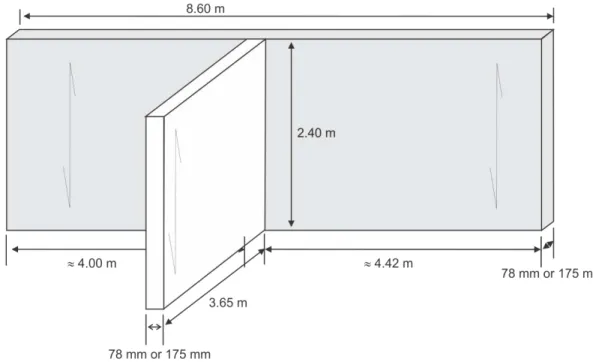
Figure 2.1: A concept drawing of the Wall
Sound Transmission Facility at the NRC is presented in the upper drawing. The NRC Floor Sound Transmission Facility, shown in the lower drawing, is similar except that one room is above the other.
In both cases, full scale test assemblies are mounted in the massive, concrete, movable test frames between two reverberation rooms. The test openings are 3.66 m by 2.44 m for walls and 4.70 m by 3.78 m for floors.
For the wall facility, the reverberation
rooms (designated la ge ha e and
s all ha e have approximate
volumes of 250 m3 and 140 m3
respectively. In the floor facility, both chambers have volumes of approximately 175 m3. All the facility rooms are hard-walled reverberation chambers that are vibration-isolated from each other and from the specimen frame. The rooms have fixed diffusor panels to increase the diffusivity of the sound fields.
The facilities, including instrumentation and the test procedures satisfy or exceed all requirements of ASTM E90.
The measurements of the direct airborne sound transmission loss (TL) were conducted in accordance
with the requirements of ASTM E90- , “ta da d Method fo La o ato Measu e e t of Ai o e
“ou d T a s issio Loss of Buildi g Pa titio s . The sound transmission loss tests were performed in
both transmission directions – from the large chamber to the small chamber and vice-versa for walls,
and from the upper chamber to the lower chamber and vice-versa for floors. The results presented in this Report are given as the averages of the two transmission directions to reduce measurement uncertainty due to factors such as calibration errors and local variations in the sound fields.
For every measurement, the direct sound transmission loss values were calculated from the average sound pressure levels in the source room and the receiving room and the average reverberation times of the receiving room. One-third octave band sound pressure levels were measured for 32 seconds at nine microphone positions in each room and then averaged to get the average sound pressure level in each room. Five sound decays were averaged to get the reverberation time at each microphone position in the receiving room and these times were averaged to determine the average reverberation times for each room.
The frequency-dependent direct sound transmission loss was measured in one-third octave bands in the frequency range from 50 Hz to 5000 Hz. However, only the frequency range between 125 Hz and 4000 Hz is considered in the calculation of the sound transmission class (STC) single-number rating in accordance with ASTM E413 [3].
The direct airborne sound transmission loss data is presented as follows in this Report:
The sets of one-third octave band direct sound transmission loss results from 50 Hz to 5000 Hz are presented in Appendix A1.
This chapter presents a more compact summary of results in terms of STC ratings.
In addition to the sound transmission loss measurements, the loss factors, the radiation efficiencies and the wave numbers of the assemblies were measured. The structural reverberation times and wave numbers are presented in Appendix A1. For the mass timber assemblies evaluated as part of this study, it was established that the loss factors are high enough to justify ignoring corrections for edge losses in the detailed calculations in accordance with Section 4.3 of ISO 15712-1, which greatly simplifies those calculations.
2.1 Sound Transmission through CLT Wall and Floor Assemblies
The calculation of the ASTC rating of a building where cross-laminated timber wall and floor assemblies are used requires the sound transmission loss data for the assemblies. For the Simplified Method of ISO 15712-1, the required sound transmission loss data is the STC rating for the floor and wall assemblies while the Detailed Method of ISO 15712-1 requires both the one-third octave sound transmission loss values and the corresponding values for the structural reverberation time of the tested floor and wall assemblies.
This section focuses on the transmission loss of Cross-Laminated Timber (CLT1) assemblies. Several types of CLT assemblies are commercially available in Canada, but this study included only CLT assemblies that use adhesive bonding between the faces of the timber elements in adjacent layers, but no adhesive bonding the adjacent timber elements within a given layer. There can be noticeable gaps between some of the timber elements comprising each layer of the CLT assembly. These CLT assemblies ould e alled Fa e-Laminated CLT Assemblies ut a e si pl efe ed to as CLT assemblies in this Report.
Another form of CLT assemblies has adhesive between the faces of the timber elements in adjacent layers as well as adhesive to bond the adjacent timber elements within a given layer. These are referred to as Full -Bonded CLT Assemblies i this Repo t. Because fully-bonded CLT assemblies have different properties than face-laminated CLT assemblies, the sound transmission loss data and predictions in this Report do not apply to fully-bonded CLT assemblies.
This study included tests on five CLT assemblies as shown in Table 2.1.1. The tests included assemblies tested in the wall or floor testing facilities and may be single panels or panels connected with a single surface spline. Although the table includes a 9-ply assembly, only a limited amount of data was available for the CLT292(9) assembly at the time this Report was published. None of the data for linings
presented in this Report is applicable to CLT292(9). Table 2.1.1: CLT assemblies included in this evaluation
Code Description Thickness
(mm)
Mass per unit area (kg/m2) CLT78(3) 3-ply single-leaf 78 42.4 CLT175(5) 5-ply single-leaf 175 91.4 CLT245(7) 7-ply single-leaf 245 130 CLT292(9) 9-ply single-leaf 292 158 CLT78(3)_GFB25_ CLT78(3)
Double-leaf 3-ply comprised of two leafs of CLT78(3) separated by a
While the transmission loss data provided in this Report is based on measurements conducted with CLT assemblies with the parameters listed above, the data may also be used as a conservative estimate for face-laminated CLT assemblies with the same number of plies but with greater thickness or higher mass. For example, a 5-ply single-leaf wall which is more than 175 mm thick or has a mass per area of more
than 91.4 kg/m2 can in general be expected to have an STC rating at least as high as the value reported
here for CLT175(5) . The data in this Report may not be used for fully-bonded CLT assemblies or for CLT
assemblies with lower thickness or mass per area than the CLT assemblies in this Report.
The remainder of Section 2.1 is arranged as follows:
Section 2.1.1 focuses on the sound transmission loss of CLT assemblies without linings. Section 2.1.2 discusses changes in the sound transmission loss due to adding various linings
on one side or both sides of the single-leaf CLT assemblies. Section 2.1.3 discusses linings added on two-leaf CLT assemblies
Section 2.1.4 presents results for structural loss factors of the CLT assemblies Section 2.1.5 presents the bending wavenumbers of the CLT assemblies
2.1.1 CLT Walls and Floors without Linings
Each of the CLT assemblies evaluated was tested both bare and with linings attached to one or both of the faces of the CLT assembly. Figure 2.1.1.1 compares the direct sound transmission loss of the bare CLT assemblies with no linings.
Figure 2.1.1.1
Comparison of sound
transmission loss for the bare CLT assemblies.
The figure shows that the double-leaf CLT78(3)_GFB25_CLT78(3) assembly exhibits a frequency dependence that is quite different from that for the single-leaf CLT assemblies. Further discussion of the double-leaf assembly is therefore postponed to Section 2.1.3.
The measured direct sound transmission loss curves for the bare single-leaf CLT assemblies differ appreciably from the behaviour expected for homogeneous walls or floors. The most obvious peculiarity is the difference between the results measured for three different CLT175(5) assemblies as shown in Figure 2.1.1.2. The assemblies were measured in either 2012 or 2018 and so some differences due to changes in manufacturing processes is to be expected. However, significant differences are evident between the sound transmission loss curves, especially the sharp dips at the low frequencies and around 3000 Hz. 10 20 30 40 50 60 70 80 90 63 125 250 500 1k 2k 4k Sound Tr an smi ss io n Los s ( dB )
1/3 Octave Band Center Frequency (Hz) Bare Assemblies Bare CLT78(3) - STC 33 Bare CLT175(5) - STC 41 Bare CLT245(7) - STC 44 Bare CLT292(9) - STC 45 Bare CLT78(3)_GFB25_CLT78(3) - STC 47
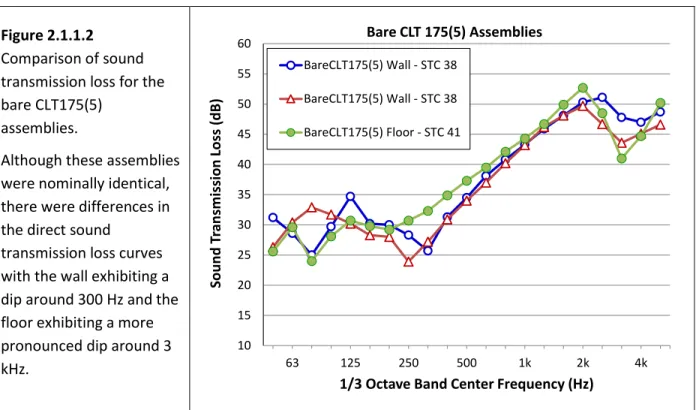
Figure 2.1.1.2
Comparison of sound transmission loss for the bare CLT175(5)
assemblies.
Although these assemblies were nominally identical, there were differences in the direct sound
transmission loss curves with the wall exhibiting a dip around 300 Hz and the floor exhibiting a more pronounced dip around 3 kHz.
The transmission loss values for the same CLT175(5) assemblies with two layers of gypsum board applied to one face are compared in Figure 2.1.1.3. A comparison between Figure 2.1.1.2 and Figure 2.1.1.3 indicates that the differences between the curves was primarily due to the leakage of sound through the CLT assemblies.
Figure 2.1.1.3
Comparison of sound transmission loss for the CLT175(5) assemblies with a layer of gypsum board directly fixed to one side. With the addition of the lining, the assemblies show similar trends at frequencies above the 250 Hz one-third octave band. 10 15 20 25 30 35 40 45 50 55 60 63 125 250 500 1k 2k 4k Sound Tr an smi ss io n Los s ( dB )
1/3 Octave Band Center Frequency (Hz) Bare CLT 175(5) Assemblies BareCLT175(5) Wall - STC 38 BareCLT175(5) Wall - STC 38 BareCLT175(5) Floor - STC 41 10 15 20 25 30 35 40 45 50 55 60 63 125 250 500 1k 2k 4k Sound Tr an smi ss io n Los s ( dB )
1/3 Octave Band Center Frequency (Hz) Bare CLT 175(5) Assemblies
CLT175(5)_2G13 Wall - STC 42
CLT175(5)_2G13 Wall - STC 39
When a lining of 2 layers of gypsum board was fastened directly to each surface of the CLT175(5) assemblies, the sharp dips in the direct sound transmission loss curves exhibited by the bare assemblies were reduced. It was concluded that the effect was primarily due to the linings blocking any leaks through gaps in the assemblies, eliminating the sound transmission due to leakage.
The term Base CLT is used throughout the remainder of this Report to denote a CLT assembly without
a li i g ut ithout a edu tio of the di e t sou d t a s issio loss due to leakage. The te Bare
CLT ill e used to de ote a CLT asse l hi h does i lude a edu tion of the direct sound
transmission loss due to leakage. The Base CLT assemblies are more appropriate for the determination of the effect of linings (presented in Section 2.1.2) and for the calculation of the ASTC ratings (presented in Chapter 4) than the measured values for Bare CLT assemblies given in Figure 2.1.1.1.
Several differences between the Base CLT estimates and the Bare CLT results should be noted:
In all cases, the STC rating for the Base CLT assembly without leakage is higher than the STC rating for the corresponding Bare CLT assembly. As a result, the STC ratings for Base CLT assemblies should not be used to quantify the direct sound transmission loss of CLT assemblies without linings.
The changes in the direct sound transmission loss curves and in the STC ratings are largest for the thinner assemblies, and smallest for the thicker assemblies. This is consistent with the expectation that there will be less sound leakage as the number of interior plies in a CLT assembly increases, and that the application of a lining will have a smaller effect on the damping and structural properties of the heavier CLT assemblies.
The direct sound transmission loss curves for the Base CLT assemblies in Figure 2.1.1.4 exhibit behavior which is broadly consistent with the theory for thick homogeneous panels:
The coincidence dips are not obvious due to high damping and orthotropic stiffness of the CLT assemblies. Below the coincidence frequency (approximately 200 Hz, 300 Hz and 400 Hz for CLT245(7), CLT175(5), and CLT78(3), respectively), the sound transmission loss curves exhibit little dependence on frequency other than minor dips and peaks due to resonances controlled by assembly dimensions and edge constraints.
At frequencies below the coincidence frequency, the average sound transmission loss for the three curves differ by about 6 dB, which is close to the variation due to assembly mass expected f o the theo eti al ass la .
Above the coincidence frequency, each curve rises at a rate of approximately 3 dB per one-third octave band.
At higher frequencies, a dip due to a thickness resonance is expected and shown at approximately 2 kHz, 4 kHz and 6 kHz for CLT245(7), CLT175(5), and CLT78(3), respectively.
Figure 2.1.1.4:
Direct sound transmission loss for the Base CLT assemblies without linings.
These values are used both for al ulatio of ΔTL alues i Section 2.1.2 and in the calculation of ASTC ratings in Chapter 4.
The STC ratings and one-third octave band direct sound transmission loss values for the CLT assemblies without linings (both directly measured values for the bare assemblies, and derived values for the Base CLT assemblies) are presented in the tables in Appendix A1.1.
For the first edition of this Report, a systematic methodology of calculating the Base case without sound leakage by comparing the transmission loss values of the assemblies with different linings attached was developed. This method is presented below and is used for all of the CLT elements presented in this second edition of this Report. Since the first edition of this Report was published, the NRC developed a new testing protocol for mass timber elements so that the effect of sound leakage could be measured directly for the calculation of the change in the transmission loss of linings installed on the mass timber elements. The new protocol was used to determine the Base case for the NLT and DLT elements presented in this second edition of this Report.
Calculations of the Base Case Using Lining Data
For test series which did not include a systematic sealing and re-testing of the bare CLT assemblies, a good estimate of the sound transmission loss for CLT assemblies without sound leaks can be extracted by using the finding (as illustrated in Figures 2.1.1.2 and 2.1.1.3) that adding a lining reduces the sound transmission due to leakage to insignificance. This is important information since the calculations of the flanking sound transmission loss in Chapter 4 must be based on the sound transmission of the bare assemblies without leakage.
The first step in the process of estimating the direct sound transmission loss of CLT assemblies without sound leaks was to establish the effect of attaching two layers of 12.7 mm gypsum board directly to the CLT assemblies when a lining on the other side already suppressed the sound transmission due to leakage and introduced additional damping and structural connections, as shown in Figure 2.1.1.5.
Figure 2.1.1.5:
Change in the direct sound t a s issio loss, ΔTL due to adding a lining of two layers of 12.7 mm gypsum board to the CLT assemblies where a lining on the opposite side has already reduced the effects of leakage which compromised the measured sound
transmission loss for the bare CLT assemblies.
The features of these curves are discussed in Section 2.1.2, as part of the discussion of linings on single-leaf CLT assemblies.
Subtracting the changes in the direct sound transmission loss curves due to the addition of the lining on the second side from the corresponding measured direct sound transmission loss for the CLT78(3), CLT175(5), and CLT245(7) assemblies with the lining applied to one side, yields estimates for the direct sound transmission loss for the Base CLT assemblies. These derived direct sound transmission loss results for the Base CLT assemblies are shown in Figure 2.1.1.4.
Measurement of the Base Case by Parging
The base case of cross-laminated timber assemblies can be determined through a testing protocol that includes a final test where one side of the assembly is sealed with a thin layer of cementitious material (parge) that seals the openings of the seams between the timber elements comprising the assembly. The layer of cementitious material was used because it effectively stopped the sound leakage without significantly changing the mass or stiffness of the element. The changes in the transmission loss of the cementitious material itself could be determined by applying the cementitious material to the other side of the element and subtracting the measured transmission loss of the element with cementitious material on both sides from the transmission loss of the same element with cementitious material on one side. This is discussed further in Section 2.2.1 of this Report which shows measurements of the transmission loss of a nail-laminated timber assembly with cementitious material on one side and with cementitious material on both sides of the assembly. Figure 2.2.1.1 shows that the cementitious material had a negligible transmission loss itself and therefore was a good means of sealing air leaks without otherwise affecting the transmission loss of the bare element.
2.1.2 Adding Linings on Single-Leaf CLT Wall or Floor Assemblies
It is common practice, especially in residential buildings, to add finishing surfaces to the basic structural floor or wall assemblies to conceal both the bare surfaces as well as the building services such as electrical wiring, water pipes and ventilation ducts. The finishing on walls or ceilings is commonly comprised of gypsum board panels, framing used to support the gypsum board panels and sound absorptive material in the inter-framing cavities between the gypsum board and the face of the basic structural floor or wall assemblies. On floors, the finish may include toppings such as concrete or a floating floor as well as flooring such as hardwood or tiles. These elements are described in ISO 15712-1 as li i gs o li e s o la e s o o e i gs . The te li i gs is used in this Report.
Two methods of characterizing the change in the direct sound transmission loss of the CLT assemblies by adding a lining are used in this Report. The first method is the change in the transmission loss (ΔTL) which is calculated from the difference between the transmission loss values measured with the lining installed on the Base CLT assembly and the transmission loss values of the Base CLT assembly without a lining. The ΔTL is used for the calculation of the ASTC rating using the Detailed Method.
The second method of characterizing the change in the direct sound transmission loss of the CLT assemblies by adding a lining is a single-number rating called the Δ“TC. The ASTM standards do not define a rating like Δ“TC, but there is a counterpart in the ISO standards called ΔRW. The calculation of
the Δ“TC rating is adopted from the ISO standard with modification as explained in Appendix A2 of this
Report. The Δ“TC rating is used for the calculation of the ASTC rating using the Simplified Method.
The linings evaluated on CLT assemblies for this study are described in Tables 2.1.2.1 to 2.1.2.3. The
corresponding Δ“TC ratings for the measured linings are listed in Table 2.1.2.4. The ΔTL alues fo the
measured linings are provided in Appendix A1.1.
Each Lining Code shown in Table 2.1.2.1 to 2.1.2.3 egi s ith ΔTL-CLT to i di ate that the li i g applied to a CLT assembly has an effect on the direct sound transmission loss through the lined assembly. For the first three linings in Table 2.1.2.1 (W01, W02, and W03), the initial part of the code also indicates the thickness (for example CLT175(5)) of the Base CLT assembly to which the lining is applied. For the three other linings in Table 2.1.2.1 (W04, W05, and W06), the code does not indicate the thickness of the Base CLT assembly because the thickness of the Base CLT assembly did not have a significant effect on the change in direct sound transmission loss provided by the lining. The final part of the lining code is a lette su h as W to i di ate a all li i g o F fo a floo li i g follo ed a
u i ue u e used to ide tif the li i g i the ta le of Δ“TC ati gs a d i the o ked e a ples i
The Descriptive Short Code provides a compact physical description of each lining and is used in the figure captions and in the examples throughout this Report. This code identifies the elements of the lining beginning at the exposed side and proceeding to the face of the supporting CLT wall or floor assembly. As detailed in the descriptions in Tables 2.1.2.1 to 2.2.2.3, each component of the lining is described by the short code. For example: G13 is gypsum board that is 12.7 mm thick, 2G13 is two connected G13 layers, and WFUR38 is a 38 mm x 38 mm wood furring. The distance between components such as adjacent studs is indicated by a number in parentheses which is the distance (on center) between the components in millimetres.
The spacing and type of fasteners are not stated in the tables, but they are expected to conform to standard industry practice as specified in the endnotes. Where sound absorbing material was included in a tested assembly, the code indicates the specific material that was tested, but applicability to other sound absorbing materials is expected as explained in the endnotes of this Report.
Table 2.1.2.1: Linings tested on the CLT Wall Assemblies.
Lining Code Descriptive Short Code Description of Lining
ΔTL-CLT(n-ply)-W01 2G13
Two layers of 12.7 mm thick fire-rated
gypsum board2 screwed to the face of the CLT
assembly
ΔTL-CLT(n-ply)-W02 2G13_WFUR38(400)_GFB38
Two layers of 12.7 mm thick fire-rated gypsum board screwed to 38 x 38 mm wood furring (spaced 400 mm o.c. and mechanically attached to the face of the CLT) with 38 mm thick glass fiber batts6 filling the spaces between the gypsum board and the CLT
ΔTL-CLT(n-ply)-W03 2G13_WFUR38(600)_GFB38
Two layers of 12.7 mm thick fire-rated gypsum board screwed to 38 x 38 mm wood furring (spaced 600 mm o.c. and mechanically attached to the face of the CLT) with 38 mm thick glass fiber battsfilling the spaces between the gypsum board and the CLT
ΔTL-CLT-W04 WFUR38(400)_GFB38 2G13_RC13(600)_
Two layers of 12.7 mm thick fire-rated
gypsum boardscrewed to 13 mm resilient
metal channels3 (spaced 600 mm o.c.) that
are screwed to 38 x 38 mm wood furring (spaced 400 mm o.c. and mechanically attached to the face of the CLT) with 38 mm thick glass fiber batts filling the spaces between the gypsum board and the CLT
ΔTL-CLT-W05 2G13_WFUR64(600)_GFB65
Two layers of 12.7 mm thick fire-rated gypsum board screwed to 64 x 38 mm wood furring (spaced 600 mm o.c. and mechanically attached to the face of the CLT) with 64 mm thick glass fiber batts filling the spaces between the gypsum board and the CLT
ΔTL-CLT-W06 2G13_WS64(600)_GFB65_AIR13
Two layers of 12.7 mm thick fire-rated gypsum board screwed to 64 x 38 mm wood studs (spaced 600 mm o.c. and spaced 13 mm from the face of the CLT) with 64 mm thick glass fiber battsfilling the spaces between the gypsum board and the CLT
NOTES: a. For the notes in this table please see corresponding endnotes
b. Linings listed here for wall assemblies may also be used on ceilings.
c. For linings W01, W02, and W03, the CLT thickness is indicated because it has an effect on the change in sound transmission loss provided by the lining; for the other linings, one short code applies for any of the CLT thicknesses considered in this Report.
Table 2.1.2.2: Linings tested on the Base CLT Floor Assemblies.
Lining Code Descriptive Short Code Description of Lining
ΔTL-CLT-F01 CON38(no bond) 38 mm thick concrete with no bond to the
supporting CLT
ΔTL-CLT-F02 CON38_FOAM09 38 mm thick concrete on 9 mm thick
closed-cell foam, covering the supporting CLT
ΔTL-CLT-F03 CON38_WFB13 38 mm thick concrete on 13 mm thick wood
fiber board, covering the supporting CLT
ΔTL-CLT-F04 CON38_FELT19 38 mm thick concrete on 19 mm thick felt of
recycled fiber, covering the supporting CLT
ΔTL-CLT-F05 CON38_RESL13 38 mm thick concrete on mat of 13 mm
rubber nuggets, covering the supporting CLT
ΔTL-CLT-F06 CON38_RESL08
38 mm thick concrete on 8 mm thick shredded rubber mat, covering the supporting CLT
ΔTL-CLT-F07 CON38_RESL17
38 mm thick concrete on 17 mm thick shredded rubber mat covering the supporting CLT
ΔTL-CLT-F08 2CEMBRD12_WFB13
Two layers of 12 mm thick fiber-reinforced cement board on 13 mm thick wood fiber board, covering the supporting CLT
ΔTL-CLT-F09 GCON38_FOAM09
38 mm thick gypsum concrete on 9 mm thick closed-cell foam, covering the supporting CLT
NOTES: a. For the notes in this table please see the corresponding endnotes
b. For all the floor linings listed, one short code applies for any of the CLT thicknesses considered in this Report.
Table 2.1.2.3: Linings tested on Base CLT Ceiling Assemblies.
Lining Code Descriptive Short Code Description of Lining
ΔTL-CLT-C01 2G13_WFUR38(600)_GFB38
Two layers of 12.7 mm thick fire-rated
gypsum board2 screwed to 38 x 38 mm
wood furring (spaced 600 mm o.c. and mechanically attached to the face of the CLT) with 38 mm thick glass fiber batts6 filling the spaces between the gypsum board and the CLT
ΔTL-CLT-C02 2G13_UC22(600)_CC38(1200)_
GFB140
Two layers of 12.7 mm thick fire-rated gypsum board screwed to metal grillage (U-channels spaced 600 mm o.c. supported by orthogonal 38 mm C-channels spaced 1200 mm o.c. that are supported on wires 140 mm below the bottom face of the CLT) with 140 mm thick glass fiber battsfilling the space between the furring and the CLT
ΔTL-CLT-C03 G16_UC22(600)_CC38(1200)_
GFB140_2G13
One layer of 15.9 mm thick fire-rated gypsum board screwed to metal grillage (U-channels spaced 600 mm o.c. supported by orthogonal 38 mm C-channels spaced 1200 mm o.c. that are supported on wires 140 mm below the bottom face of 2 layers of 12.7 mm thick fire-rated gypsum board screwed to the CLT) with 140 mm thick glass fiber batts filling the spaces between the furring and the bottom of the gypsum board screwed to the CLT
NOTES: a. For the notes in this table please see the corresponding endnotes
b. The linings listed for wall assemblies may also be used on ceilings.
c. For all the ceiling linings listed, one short code applies for any of the CLT thicknesses considered in this Report.
Change in the Transmission Loss
ΔTL due to Linings on Single-Leaf CLT Assemblies
The trends in the change in the sound transmission loss when linings are added to single-leaf CLT assemblies are presented and discussed in this Section.
The changes in the transmission loss are presented as follows:
The averaged one-thi d o ta e a d ha ges i the di e t sou d t a s issio loss ΔTL fo the
set of linings applied to the CLT assemblies are given in Table A1.1.2 of Appendix A1.1. The ΔTL
data is needed for the calculation of the ASTC rating using the Detailed Method as presented in Report RR-331 and Chapter 4 of this Report.
The corresponding single- u e Δ“TC ati gs fo ea h li i g a e gi e i Table 2.1.2.4. The Δ“TC ati gs a e eeded fo the calculation of the ASTC rating using the Simplified Method as presented in Report RR-331 and in Chapter 4 of this Report.
For the assemblies evaluated in this study, each type of lining was tested in the first situation listed below with the lining applied only on one side of the CLT assembly (sometimes there were several tests), and many were tested in one or both of the other situations.
Situation 1: the lining was tested on one side: The transmission loss of the Base CLT assembly was subtracted from the transmission loss with the added lining on one side to obtain the ΔTL values.
Situation 2: the lining was tested on both sides: The transmission loss of the Base CLT assembly was subtracted from the transmission loss with the added lining on both sides, and the result was divided by 2 to obtain the ΔTL.
Situation 3: different linings were tested on each side: The transmission loss of a CLT assembly with the other lining on one side was subtracted from the transmission loss for the wall with two different linings to obtain the ΔTL.
Because the test results for assemblies with linings on both sides were likely to be compromised by the facility flanking limit, several precautions were included when lining data was averaged to determine the ΔTL values to be used in the calculations:
A weighted average of the different situations was used with a 50% weighting for data from situation 1 and a 50% weighting for the mean of situations 2 and 3.
Where the measured direct sound transmission loss was above the facility flanking limit (10 dB below the maximum sound transmission loss recorded for that frequency band in the facility) the potentially compromised results were excluded from the average values.
The lining that was tested most often was the 2G13 lining of two layers of 12.7 mm gypsum board screwed directly to the surface of the CLT assembly. This lining was tested when applied on one side of all of the thicknesses of the CLT assemblies and for many of the thicknesses of the CLT assemblies, the lining was applied to the second side as well. Subsets of these test results were shown previously in Section 2.1.1 to explain the calculation of estimates of the direct sound transmission loss for Base CLT assemblies.
The results from averaging the full set of ΔTL data for all the test assemblies with the 2G13 lining are
given in Figure 2.1.2.1.
Figure 2.1.2.1
Change in direct sound transmission loss (ΔTL) due to the addition of the 2G13 lining on the CLT assemblies.
Note the close similarity among the results for all CLT thicknesses above the mass-air-mass resonances. Also note the higher ΔTL for the lighter CLT base assemblies below the mass-air-mass resonances.
The results in Figure 2.1.2.1 illustrate the key features typical of all of the linings discussed in this Report: A dip can be observed in each of the ΔTL curves at the mid-frequencies, varying from about 315 Hz for CLT245(7) to 500 Hz for CLT78(3). The dips are due to the mass-air-mass resonance caused by air which is trapped between the gypsum board and the CLT assembly which acts like a spring.
The dip in the ΔTL curves around 2500 Hz is due to the critical frequency of the gypsum board panels. The critical frequency in the 2500 Hz one-third octave band is typical for 12.7 mm fire-rated gypsum board.
Increasing the width of the CLT assembly shifts the mass-air-mass resonance to lower
frequencies, resulting in higher ΔTL above the resonance frequency and generally higher ΔSTC
ratings. Improvements are also possible by increasing the mass of the gypsum board layer, increasing the gap between the gypsum board and the surface of the CLT and filling the gap with
-4 -2 0 2 4 6 8 10 63 125 250 500 1k 2k 4k Chang e in S ound T rans miss ion Loss ( dB)
1/3 Octave Band Center Frequency (Hz) CLT Assemblies with 2G13 Linings
CLT78(3)_2G13 -∆“TC CLT175(5)_2G13 -∆“TC CLT245(7)_2G13 -∆“TC
Below the mass-air-mass resonance, the values of the ΔTL curves tend to increase as the mass of
the CLT assembly is decreased. The mean increase of about 2 dB in ΔTL due to adding the 2G13
lining to CLT78(3) versus the smaller ΔTL for adding the lining to CLT245(7) reflects the changing
atio of the li i g’s mass relative to that of the CLT.
Above the mass-air-mass resonance, there is little dependence on the mass of the supporting CLT assembly.
As noted in the legend in Figure 2.1.2. , the Δ“TC rating is slightly higher for this lining on CLT78(3) than on the CLT175(5) or CLT245(7). Similar effects are observed for other linings with a rather small cavity (under 40 mm) between the gypsum board and the CLT.
The a e aged ΔTL data fo all the test assemblies with the 2G13_WFUR38(600)_GFB38 lining are shown in Figure 2.1.2.2.
Figure 2.1.2.2
Change in direct sound
transmission loss (ΔTL)
due to the addition of the lining W03 on the Base CLT assemblies.
The ΔTL u es fo this li i g show quite similar trends for the CLT78(3) and CLT175(5) assemblies with a mass-air-mass resonance below 125 Hz. This is just below the frequency range that determines the STC rating, so the resonance has little influence on the single-number Δ“TC ati g. Bet ee Hz a d 2 kHz, most of the ΔTL alues fo the li i g o the CLT78(3) assembly are higher than those for the CLT175(5) assembly, esulti g i a slightl highe Δ“TC rating for the former.
The full Δ“TC ratings are listed in Table 2.1.2.4.
-10 -5 0 5 10 15 20 63 125 250 500 1k 2k 4k Cha ng e in Sound T ran smi ss ion Los s (dB )
1/3 Octave Band Center Frequency (Hz)
CLT Assemblies with the 2G13_WFUR38(600)_GFB38 Linings CLT78(3)_2G13_WFUR38(600)_GFB38 -∆“TC
CLT175(5)_2G13_WFUR38(600)_GFB38 -∆“TC CLT245(7)_2G13_WFUR38(600)_GFB38 -∆“TC
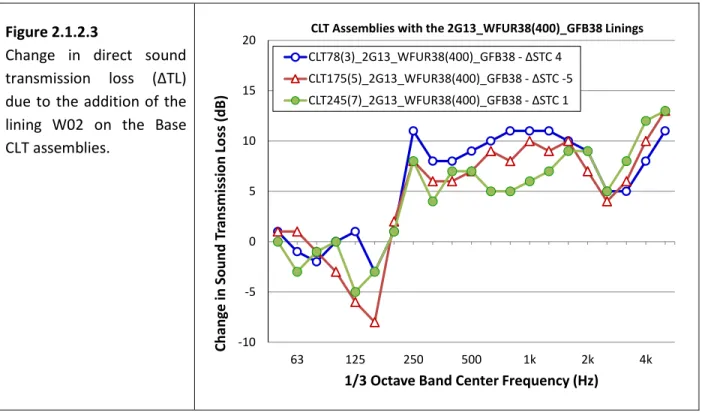
Figure 2.1.2.3 shows the o espo di g ΔTL data fo the assemblies with the 2G13_WFUR38(400)_GFB38 lining. The only change from the assemblies in the preceding figure is the reduction of the spacing between the furring strips from 600 mm to 400 mm, but this is shown to cause
a large change in the ΔTL values at the low frequencies and thereby a change in the Δ“TC ati gs.
Figure 2.1.2.3
Change in direct sound
transmission loss (ΔTL)
due to the addition of the lining W02 on the Base CLT assemblies.
Some features of the changes in the direct sound transmission loss in Figure 2.1.2.3 should be noted: The change in the sound transmission loss due to the addition of a lining is not always an
improvement. In this case, the ΔTL values are negative at frequencies below about 200 Hz. That
is, the sound transmission loss of the CLT with the added lining is below that for the Base CLT assembly. This finding emphasizes the point that linings for the CLT assemblies must be
chosen with care to avoid reducing the transmission loss of the assembly.
The addition of a matching lining on both sides of the wall approximately doubles the ΔTL values at each frequency relative to the change observed for adding a lining to one side of the Base CLT so that the negative dips become even more negative when both sides have this lining.
Note that the change in the STC rating does NOT usually double due to addition of the lining on
the second side. Unfortunately, the negative low frequency dips in the ΔTL value like those due
to adding this lining have a strong influence on the STC rating. It is this sort of behaviour that
forces the conservative process for calculating the Δ“TC rating as presented in Appendix A2.
-10 -5 0 5 10 15 20 63 125 250 500 1k 2k 4k Cha ng e in Sound T ran smi ss ion Los s (dB )
1/3 Octave Band Center Frequency (Hz)
CLT Assemblies with the 2G13_WFUR38(400)_GFB38 Linings CLT78(3)_2G13_WFUR38(400)_GFB38 -∆“TC
CLT175(5)_2G13_WFUR38(400)_GFB38 -∆“TC -5 CLT245(7)_2G13_WFUR38(400)_GFB38 -∆“TC