EUROPEAN ORGANISATION FOR NUCLEAR RESEARCH (CERN)
CERN-PH-EP-2013-164
Submitted to: Phys. Rev. D
Measurement of the inclusive isolated prompt photon cross
section in
pp
collisions at
√
s = 7 TeV
with the ATLAS detector
using 4.6 fb
−1
The ATLAS Collaboration
Abstract
A measurement of the cross section for the production of isolated prompt photons in pp collisions at
a center-of-mass energy
√
s = 7
TeV is presented. The results are based on an integrated luminosity
of 4.6 fb
−1collected with the ATLAS detector at the LHC. The cross section is measured as a function
of photon pseudorapidity η
γand transverse energy E
γT
in the kinematic range 100 ≤ E
γT
< 1000
GeV
and in the regions |η
γ| < 1.37 and 1.52 ≤ |η
γ| < 2.37. The results are compared to leading-order
parton-shower Monte Carlo models and next-to-leading-order perturbative QCD calculations.
Next-to-leading-order perturbative QCD calculations agree well with the measured cross sections as a
function of E
Tγand η
γ.
Measurement of the inclusive isolated prompt photons cross section in pp collisions at
√
s = 7 TeV with the ATLAS detector using 4.6 fb
−1(The ATLAS Collaboration)
(Dated: July 17, 2018)
A measurement of the cross section for the production of isolated prompt photons in pp collisions at a center-of-mass energy√s = 7 TeV is presented. The results are based on an integrated luminosity of 4.6 fb−1 collected with the ATLAS detector at the LHC. The cross section is measured as a function of photon pseudorapidity ηγ and transverse energy ETγ in the kinematic range 100 ≤ ETγ< 1000 GeV and in the regions |ηγ| < 1.37 and 1.52 ≤ |ηγ| < 2.37. The results are compared to
leading-order parton-shower Monte Carlo models and next-to-leading-leading-order perturbative QCD calculations. Next-to-leading-order perturbative QCD calculations agree well with the measured cross sections as a function of ETγ and ηγ.
PACS numbers: 13.25.Hw, 12.15.Hh, 11.30.Er
I. INTRODUCTION
Prompt photon production at hadron colliders allows tests of perturbative QCD predictions [1]. The mea-surement is sensitive to the gluon content of the pro-ton through the qg → qγ process, which dominates the prompt photon production cross section at the LHC, and can be used to constrain parton distribution func-tions (PDFs) [2].
Recent measurements of the production cross section of isolated prompt photons have been performed by AT-LAS [3, 4] and CMS [5, 6] using pp collision data at √
s = 7 TeV at the LHC. Earlier measurements were made by CDF and D0 using p¯p collisions collected at √
s = 1.8 TeV and √s = 1.96 TeV at the Tevatron col-lider [7–10]. Also, similar measurements were made at the Sp¯pS collider [11,12].
In this paper, the production cross section of isolated prompt photons is measured in the transverse energy (ETγ) range between 100 GeV and 1 TeV, extending the result of the previous ATLAS measurement, which cov-ered the range between 45 GeV and 400 GeV [4]. The differential cross section as a function of ETγ is measured in the pseudorapidity [13] range |ηγ| < 1.37 (the barrel
region) and 1.52 ≤ |ηγ| < 2.37 (the end-cap region).
Pho-ton reconstruction in these pseudorapidity regions has a high efficiency and a low background rate. The differen-tial cross section is also studied as a function of ηγ for
ETγ > 100 GeV. The data sample corresponds to an inte-grated luminosity of 4.64 ± 0.08 fb−1[14]; thus this anal-ysis uses a data set more than two orders of magnitude larger than that used in the previous measurement [4].
In the following, all photons produced in pp collisions and that are not secondaries to hadron decays are consid-ered as “prompt”. They include “direct” photons, which originate from the hard processes calculable in pertur-bative QCD, and “fragmentation” photons, which are the result of the fragmentation of a colored high-pT
par-ton [15, 16]. Photons are considered “isolated” if the transverse energy (Eiso
T ) within a cone of radius ∆R =
p(∆η)2+ (∆φ)2 = 0.4 centered around the photon in
the pseudorapidity and azimuthal angle (φ) is smaller
than 7 GeV. In next-to-leading-order (NLO) parton-level theoretical calculations, Eiso
T is calculated from all
par-tons within the cone, while in the leading-order (LO) parton-shower Monte Carlo (MC) simulations, Eiso
T is
cal-culated from all the generated particles (except muons and neutrinos) inside the cone. Experimentally, ETiso is calculated from the energy deposited in the calorimeters in a ∆R = 0.4 cone around the photon candidate, cor-rected for effects associated with the energy of the photon candidate itself, the underlying event, and the additional pp interactions in the same bunch crossing (pileup) [17]. The main background for the prompt photons consists of photons from decays of light neutral mesons such as the π0or η.
II. THE ATLAS DETECTOR
ATLAS [18] is a multi-purpose detector with a forward-backward symmetric cylindrical geometry and nearly 4π coverage in solid angle. The most relevant subdetectors for the present analysis are the inner tracking detector (ID) and the calorimeters.
The ID consists of a silicon pixel detector and a silicon microstrip detector covering the pseudorapidity range |η| < 2.5, and a straw-tube transition radiation tracker covering |η| < 2.0. It is immersed in a 2 T magnetic field provided by a superconducting solenoid. The ID al-lows efficient reconstruction of converted photons if the conversion occurs at a radius of less than 0.80 m.
The electromagnetic calorimeter (ECAL) is a lead/liquid-argon (LAr) sampling calorimeter providing coverage for |η| < 3.2. It consists of a barrel section (|η| < 1.475) and two end-caps (1.375 < |η| < 3.2). The central region (|η| < 2.5) is segmented into three layers in shower depth. The first (inner) layer, covering |η| < 1.4 in the barrel and 1.5 < |η| < 2.4 in the end-caps, has a high η granularity (between 0.003 and 0.006 depending on η), which can be used to provide event-by-event discrimination between single-photon showers and two overlapping showers such as may be produced by π0 decay. The second layer, which collects
most of the energy deposited in the calorimeter by the photon shower, has a cell granularity of 0.025×0.025 in η × φ. The third layer is used to correct high-energy showers for leakage. In front of the ECAL a thin presampler layer, covering the pseudorapidity interval |η| < 1.8, is used to correct for energy loss before the ECAL.
The hadronic calorimeter (HCAL), surrounding the ECAL, consists of an iron/scintillator-tile calorimeter in the range |η| < 1.7, and two copper/LAr calorimeters spanning 1.5 < |η| < 3.2. The ECAL and HCAL accep-tance is extended by two copper/LAr forward calorime-ters (using copper and tungsten as absorbers) up to |η| = 4.9.
A three-level trigger system is used to select events containing photon candidates. The first level (level-1) is implemented in hardware and is based on towers with a coarser granularity (0.1 × 0.1 in η × φ) than that of the ECAL. They are used to search for electromagnetic de-posits in η × φ regions of 2 × 1 and 1 × 2 towers, within a fixed window of size 2 × 2 and with an ETγ above a pro-grammable threshold. The algorithms of the second and third level triggers (collectively referred to as the high-level trigger) are implemented in software. The high-high-level trigger exploits the full granularity and precision of the calorimeter to refine the level-1 trigger selection, based on improved energy resolution and detailed information on energy deposition in the calorimeter cells.
III. DATA AND SIMULATED SAMPLES
A. Collision Data selection
The measurement presented here is based on proton-proton collision data collected at a center-of-mass energy of √s = 7 TeV with the ATLAS detector at the LHC in 2011. Only events where both the calorimeter and the ID are fully operational and that have good data quality are used. Events are triggered using a high-level photon trigger, with a nominal ETγ threshold of 80 GeV. The trigger selection criteria for the fraction and pro-file of the energy measured in the various layers of the calorimeters are looser than the photon identification cri-teria applied in this analysis; as described in Sec. IV C. For 2011, the average number of pp interactions in the same bunch crossing is nine. Events are required to have a reconstructed primary vertex (PV) [19] consistent with the average beam-spot position and with at least three associated tracks.
B. Simulated events
To study the characteristics of signal and background events, MC samples are generated using PYTHIA 6.4 [20], a LO parton-shower MC generator, with the modified LO MRST2007 [21] PDFs. The event generator parameters
are set according to the ATLAS AMBT2 tune [22]. The ATLAS detector response is simulated using the GEANT4 program [23]. In order to have a realistic description of the experimental conditions under which the data are taken, pileup interactions are included in the simulation. These samples are then reconstructed with the same algo-rithms used for data. More details of the event generation and simulation infrastructure of the ATLAS experiment are provided in Ref. [24].
For the study of systematic uncertainties and for com-parisons with the final cross sections, events are gener-ated with the HERWIG 6.5 [25] model using the ATLAS AUET2 tune [26] and the same PDFs as used for the PYTHIA event generation. HERWIG and PYTHIA use differ-ent parton-shower and hadronization models.
Signal MC samples include hard-scattering photons from the LO processes qg → qγ and q ¯q → gγ, and pho-tons from QED radiation from quarks produced in QCD 2 → 2 processes.
To study background processes, MC samples enriched in photons from meson decays with an EγT> 100 GeV are used. The samples are generated using all tree-level 2→2 QCD processes, while events with photons originating from quarks were removed.
IV. PHOTON SELECTION
The reconstruction of photons in the ATLAS detector is described in detail elsewhere [3, 27].The selection of photons is discussed in the following three sections: kine-matic preselection, isolation selection and shape identifi-cation.
A. Photon kinematic preselection
As already stated in Sec. III, photon candidates are first required to have passed an 80 GeV trigger. From these, only those with calibrated transverse energies above 100 GeV are retained for the subsequent analy-sis. The calibration includes an in situ technique based on the Z boson mass peak [28]. In order to benefit from the fine segmentation of the first layer of the ECAL for identification of genuine photons, the photon candidates are required to be within the barrel or the end-cap pseu-dorapidity regions. After the selection, approximately 2.6×10⁶ photon candidates remain in the data sample.
B. Photon isolation selection
Isolation is an important observable for prompt pho-ton studies. The prompt phopho-ton signal is expected to be more isolated from hadronic activity than the back-ground. Also, because of the mixture of hard-scattering and fragmentation contributions in the prompt photon signal, it is important to have a well modeled isolation
variable that can be linked to the parton-level isolation cut used in NLO QCD computations. A robust isolation prescription helps limit the non-perturbative fragmenta-tion contribufragmenta-tion, which is poorly understood in theory, while retaining the signal produced from direct processes. This study uses the same definition of the cone iso-lation variable, ETiso, as for the previous ATLAS mea-surement [4]. It is computed using calorimeter cells from both the ECAL and HCAL, in a cone of radius ∆R = 0.4 around the photon candidate. The contributions from the 5 × 7 second layer ECAL cells in the η × φ space around the photon shower barycenter are not included in the calculation. The expected small value of the leakage from the photon shower into the cone outside this small central region, evaluated as a function of the ETγ in simu-lated samples of single photons, is then subtracted from the isolation variable. The contribution to the photon isolation energy from the underlying event and pileup is subtracted using the procedure proposed in Refs. [29,30], and implemented as described in Ref. [3]. After these corrections, the transverse isolation energy of simulated prompt photons is independent of ETγ. A residual mild dependence on the amount of in-time pileup (from col-lisions of protons in the same bunches as the hard pp scattering from which the photon originates) is observed for this isolation variable. This dependence can be traced back to the fact that Eiso
T is calculated from cells
with-out noise suppression whereas the pileup correction is computed from noise-suppressed topological clusters [31]. The pileup dependence of Eiso
T is well modeled in the
sim-ulation and found to be robust against systematic uncer-tainties discussed later.
In the following, all photon candidates having recon-structed isolation energies ETiso ≤ 7 GeV are considered “isolated”, while candidates with Eiso
T > 7 GeV are
con-sidered “non-isolated”. These definitions are applied to the data and to the MC calculations at both parton and particle level. An ambient energy algorithm correction, which is used to correct for the activity of the underlying event, is also applied for the particle level MC isolation. The isolation requirement Eiso
T ≤ 7 GeV is looser than
that used in the previous analysis [4] and is chosen in order to optimize the signal purity and the photon re-construction efficiency at high ETγ.
C. Photon shower-shape identification
Shape variables computed from the lateral and longitu-dinal energy profiles of the shower in the ECAL are used to further discriminate the signal from the background. The selection criteria do not depend on the photon can-didate’s ETγ, but vary as a function of the photon’s re-constructed ηγ to take into account significant changes in the total thickness of the upstream material and vari-ations in the calorimeter geometry or granularity. The same “tight” selection criteria as used in the measure-ment of the isolated photon-pair production cross
sec-tion [17] are applied. After the photon identification requirements, 1.3×10⁶ (6.2×10⁵) photon candidates re-main in the barrel (end-cap) ηγ region. The fraction of
converted photons, i.e. photons that pair produce in the presence of material and are identified by their tracks are considered converted photons, is 32% (45%) in the barrel (end-cap) ηγ region. Converted photons are identified by there tracks. There are 19 photon candidates with ETγ between 800 GeV and 1 TeV. The total number of events with more than one good photon candidate is 1240.
V. BACKGROUND ESTIMATION AND SIGNAL EXTRACTION
The main background for prompt photons is due to hadronic jets containing π0 mesons that carry most of
the jet energy and that decay to photon pairs. Such background photons are expected to be less isolated than prompt photons due to activity from the other particles in the jet. The isolation energy, Eiso
T , therefore provides
a discrimination between prompt photons and photons from jets and meson decays. To avoid relying on the simulation to accurately model the energy flow inside jets and the fragmentation to π0mesons, a data-driven tech-nique is used for the reconstruction of the background isolation distribution.
Among the shower-shape variables used in the pho-ton selection, some measured in the first ECAL layer are fairly uncorrelated with the EisoT . A background-enhanced sample is provided by requiring the photon candidates to fail the “tight” identification criteria for at least one of four variables computed from the finely segmented first layer of the calorimeter, and to satisfy all the other criteria [3]. From now on, such photons are called “non–tight candidates”, while the photon can-didates satisfying the “tight” selection are called “tight candidates”.
The residual background contamination in the tight candidates event sample is estimated using the “two-dimensional side bands” method [3]. It is based on the definition of a “tight–isolated” signal region A and three background control regions B, C, D: “tight– non-isolated”, “non-tight–isolated” and “non-tight–non-isolated”, respectively. The basic method assumes that the control regions have negligible signal contamination and that the isolation energy distribution of background events is the same for tight and non-tight candidates. In that case the signal yield in region A, NA
S, can be
ob-tained from the number Nk of events observed in data,
in each of the four regions k = A, B, C, and D, as NSA= NA− NC
NB
ND. (1)
The method can easily be extended to account for de-viations from the previous hypotheses, requiring only a limited knowledge of the signal and background
proper-ties. In that case, the equation to solve is NSA= NA− RBKG (NB− c BNSA)(N C− c CNSA) (ND− c DNSA) ; (2) where ck = NSk/N A
S are the fractions of signal events
ex-pected in each of the three control regions, relative to the signal region A, and RBKG = NBKGA NBKGD /NBKGB NBKGC
characterizes the correlation between the isolation and identification variables in background events (RBKG= 1
when the correlations are negligible). Figure1(a) shows the distribution of Eiso
T for tight and
non-tight candidates. The latter is normalized to the for-mer in the background-dominated region Eiso
T > 15 GeV.
The excess of tight candidates over normalized non-tight candidates in the region EisoT < 15 GeV shows a clear peak for signal prompt photons. Fig.1(b) and1(c) show the isolation profile of photon candidates after subtract-ing the distribution of non-tight candidates (with the same normalization as applied in Fig. 1(a)), for differ-ent ranges of the photon candidate transverse energy in the two different ηγ regions. The distributions of these signal-enriched samples are largely independent of the ETγ range, according to the simulation.
In the following, Eq. (2) is used to estimate the prompt photon yield in the selected sample, with RBKG fixed to
one as observed (within uncertainties) in simulated back-ground events. Results obtained neglecting signal leakage in the control regions, as in Eq. (1), or with RBKG 6= 1
are used to evaluate systematic uncertainties. In the end-cap region there are too few events in the 500 to 600 GeV bin; therefore, the signal purity from the preceding bin is used instead.
The largest contribution to the impurity arises from background photons that come from the meson decays. Figure 2 shows the signal purity for prompt photons in region A as a function of ETγ for the barrel and end-cap regions. The signal purity is estimated from the data using the two-dimensional side band approach shown in Eq. (2). The shaded bands indicate statistical uncer-tainties. The measured signal purity is larger than 93% and increases with ETγ. The purity has also been deter-mined using Eq. (2) and the result agrees with the default method to within 3% and has a similar ETγ-dependence.
VI. RESIDUAL BACKGROUND
A possible residual background could arise from elec-trons that fake photons; primarily high-pT isolated
elec-trons from W or Z boson decays that tend to be tified as converted photons. The corresponding misiden-tification probability is measured by studying the invari-ant mass spectrum of e±γ combinations in the Z bo-son mass range. It was found that the background from prompt electrons is ≈ 0.5% for ETγ < 400 GeV [4].
To understand the background from electrons for higher EγT, a MC study was performed using a sam-ple of high-pT electrons. The current analysis neglects
[GeV] iso T E -10 -5 0 5 10 15 20 25 30 35 40 Entries / GeV 0 20 40 60 80 100 120 140 160 180 200 3 10 × =7 TeV s Data 2011 γ tight γ non-tight |<1.37 γ η >100 GeV | γ T E ATLAS -1 L dt = 4.6 fb
∫
(a) [GeV] iso T E -10 -5 0 5 10 15 20 25 30 35 40Entries / total [1/GeV]
0 0.05 0.1 0.15 0.2 =7 TeV s Data 2011 |<1.37 γ η Photons in | <125 GeV γ T 100<E <600 GeV γ T 500<E ATLAS -1 L dt = 4.6 fb
∫
(b) [GeV] iso T E -10 -5 0 5 10 15 20 25 30 35 40Entries / total [1/GeV]
0 0.05 0.1 0.15 0.2 =7 TeV s Data 2011 |<2.37 γ η Photons in 1.52<| <125 GeV γ T 100<E <500 GeV γ T 400<E ATLAS -1 L dt = 4.6 fb
∫
(c)FIG. 1. (a): Distributions of tight photon transverse energy Eiso
T (dots) and non-tight (shaded gray region) photon
candi-dates in data, for photon transverse energy ETγ > 100 GeV in the central ηγ region. The latter is normalized to the
former for Eiso
T > 15 GeV. Distributions of tight EisoT
pho-tons in the barrel (b) and end-cap (c) regions after subtract-ing the normalized non-tight distribution. For both (b) and (c) a comparison of two representative ETγ regions with dif-ferent ηγ is shown. The vertical lines show the requirement of ETiso≤ 7 GeV used to define the final cross sections. These
100 200 300 400 500 600 700 800 900 1000 0.86 0.88 0.9 0.92 0.94 0.96 0.98 1 1.02 1.04 [GeV] γ T E 100 200 300 400 500 600 700 800 900 1000 Signal purity 0.86 0.88 0.9 0.92 0.94 0.96 0.98 1 1.02 1.04 =7 TeV s Data 2011 |<1.37 η | |<2.37 η 1.52<| -1 L dt = 4.6 fb
∫
ATLASFIG. 2. The signal purity for the barrel and end-cap ηγ re-gions as a function of photon transverse energy EγTestimated from the data using the two-dimensional side band approach shown in Eq. (2). The shaded bands indicate statistical un-certainties.
contributions from high-pT isolated electrons, since the
MC study indicates that the rate of misidentified pho-tons with ETγ above 400 GeV originating from electrons is well below 0.5%.
VII. CROSS-SECTION MEASUREMENT
The differential cross section for the production of iso-lated prompt photons in a given phase-space bin i is Ni/(Ci(γ) · ∆i·R Ldt), where Ni is the number of
pho-tons in a bin i after the background subtraction, Ci(γ) is
a correction factor, ∆i is the width of bin i andR Ldt is
the integrated luminosity. The correction factor, Ci(γ),
is evaluated from the bin-by-bin ratio of the number of reconstructed prompt photons to the number of particle-level prompt photons in the signal simulation. The pho-ton reconstruction efficiency in the MC simulation was tuned using data-driven techniques [32]. The correction factor Ci(γ) accounts for acceptance and smearing
fects, photon reconstruction efficiency and selection ef-ficiency, as well as the event selection efficiency. The various components of the correction are discussed.
• Acceptance and smearing correction, is defined as the efficiency for a particle-level photon, in the ac-ceptance of the differential cross section, to be re-constructed as a photon passing all the selection cri-teria outlined in Sec. VI. The largest contributing factor to this efficiency is the selection requirement ETiso ≤ 7 GeV. The shower-shape corrections for the MC simulation are determined from the com-parison of data with the simulation in the control samples of photons selected in the same kinematic
regions as used in this measurement. The aver-age value of this efficiency in the barrel region was found to be 95%, while it is 87% in the end-cap region.
• Identification efficiency, which is defined as the efficiency for reconstructed prompt photons after the isolation requirement to pass the tight pho-ton identification criteria described in Sec.V. This efficiency was estimated by using simulated sig-nal events after correcting the simulated shower-shapes in the calorimeter to match those observed in data [3]. This efficiency in the barrel and end-cap region was found to be above 93%.
• Trigger efficiency, which is defined as the efficiency for an event to be accepted by a photon trigger with an energy threshold of 80 GeV. The trigger effi-ciency is determined using a data-driven technique based on high level triggers with low-ETγ thresh-old, and it is estimated to be close to 100% for ETγ > 100 GeV [33].
In addition to the efficiencies quoted above, the correc-tion factor also accounts for the bin-by-bin migracorrec-tion due to the finite bin sizes. The MC simulations indicate that the RMS of the ETγ resolution for photons in the range 100 < ETγ < 600 GeV is close to 3% in the central region and 4% in the end-cap region. The widths of the bins for the differential cross-section measurement are chosen to be substantially larger than the resolution in order to minimize migration between neighboring bins.
The average value of the Ci(γ) estimated using PYTHIA
is about 94% in the barrel region and 86% in the end-cap region. It increases with EγTby approximately 4% in the range of ETγ explored in this measurement. This correc-tion factor is shown in Fig.3, where the shaded bands represent the systematic and statistical uncertainties dis-cussed in Sec.VIII.
VIII. SYSTEMATIC UNCERTAINTIES
The systematic uncertainties on the measured differen-tial cross sections are determined by repeating the anal-ysis with some of the selection or analanal-ysis procedures changed. The systematic variations affect the Ci(γ)
cor-rection factors and signal purity, thus an overall change in the cross section. The largest uncertainties are described below.
• A shift between the true and reconstructed isola-tion energy in the MC simulaisola-tion was found to be less than 700 MeV for ETiso ' 7 GeV. This differ-ence does not depend on the ETγ, and is similar in PYTHIA and HERWIG signal and background MC samples. This difference is also similar to that ob-served between the data and MC simulation. In the previous publication [4], this difference estimated using electrons was found to be 500 MeV.
100 200 300 400 500 600 700 800 900 1000 0.7 0.8 0.9 1 1.1 1.2 1.3 [GeV] γ T E 100 200 300 400 500 600 700 800 900 1000 ) γ C( 0.7 0.8 0.9 1 1.1 1.2 1.3
PYTHIA + data-driven correction |<1.37 η | |<2.37 η 1.52<| -1 L dt = 4.6 fb
∫
ATLASFIG. 3. The correction factor, Ci(γ), as a function of photon
transverse energy EγTfor the barrel and end-cap regions. The correction factor is evaluated from the bin-by-bin ratio, using the PYTHIA simulation, of reconstructed prompt photons to particle-level prompt photons in the signal simulation. The shaded bands indicate statistical and systematic uncertainties discussed in Sec.VIII.
MC samples with an additional amount of material in front of the calorimeter show a small effect on the isolation distribution. For this MC, the shift between the true and reconstructed levels for the isolation is smaller than 700 MeV. The correction factors Ci(γ) calculated using such MC showed a
negligible effect on the cross section.
The systematic uncertainty on the cross section due to the isolation cut was evaluated by changing the requirement by ±700 MeV in the simulation and recalculating the correction factors Ci(γ). This
sys-tematic variation leads to a typical uncertainty of less than 1% for all ETγ explored in this measure-ment.
• The uncertainty on the cross section due to insuf-ficient knowledge of the photon identification effi-ciency is estimated by using different techniques for the photon identification as described in Ref. [32]. Such uncertainties also account for the amount of material upstream of the calorimeter. An effect of 2% or less is observed for all ETγ explored in this measurement.
• The uncertainty due to the photon energy mea-surement is calculated by varying the photon en-ergy scale within the expected uncertainty in the MC simulation. This uncertainty mostly affects the Ci(γ) correction factor. The effect of such a
varia-tion leads to an uncertainty between 2% at low ETγ and 6% at large ETγ.
• The systematic uncertainty on the cross section due to the photon energy resolution is calculated by
smearing the central value and then varying the reconstructed energy in the MC simulations as de-scribed in Ref. [3] and then recomputing the Ci(γ)
factor. This uncertainty is typically 2% for all ETγ explored in this measurement.
• The stability on the Ci(γ) factors due to the
choice of MC generator is computed by consider-ing HERWIG for the bin-by-bin correction instead of PYTHIA. The stability affects photon reconstruction and identification. It also probes the uncertainty on the signal reconstruction due to an alternative fragmentation mechanism. The uncertainty on the cross section due to this contribution ranges from 2% at low ETγ to 4% at ETγ > 800 GeV.
• The uncertainty on the background subtraction is estimated using alternative background subtrac-tion techniques discussed in Sec.V. Equation (2) is modified to either neglect signal leakage or include a modified RBKG.The background is subtracted by
either neglecting correlations between the signal and background regions, or using the central values of the correlations estimated from simulated back-ground events. The uncertainty on the cross sec-tion due to the background subtracsec-tion technique varies between 2% and 3% for all ETγ explored in this measurement.
• The uncertainty arising from the definition of the background control regions is estimated by repeat-ing the measurement usrepeat-ing an alternative definition of the non-isolated region. The isolation require-ment was increased from 7 GeV to 10 GeV. Such a redefinition affects both the signal purity and the Ci(γ) factors. An effect of 1% or less for all E
γ T
explored in this measurement is observed, which is compatible with the statistical uncertainty. • The systematic uncertainty on the fraction of
photons from fragmentation was estimated using the PYTHIA signal sample with 50% fewer pho-tons from fragmentation. Alternatively, weights of events with photons from fragmentation were scaled by a factor of two. The effect from such changes on the final cross sections is compatible with the statistical uncertainty (< 0.5%).
• The relative systematic uncertainty on the cross section due to the uncertainty of the luminosity measurement is 1.8%. It is fully correlated among all ETand η bins of the differential cross sections.
The sources of systematic uncertainty are assumed un-correlated and thus the total systematic uncertainty is es-timated by summing in quadrature all the contributions. The final systematic uncertainty on the differential and total cross sections in the barrel (end-cap) region is below 6(7)%.
As a cross-check, the measurement is repeated using an alternative definition of the photon transverse isola-tion energy, based on three-dimensional topological clus-ters [31] of energy deposits in the calorimeters, affecting mostly the photon reconstruction efficiency. The same calorimeter cells are used for both the calculation of the photon isolation and for the subtraction of the contribu-tion from the underlying event and pileup, thus providing a quantity that is less dependent on the amount of pileup. A difference smaller than 3% is found between the alter-native and the nominal results. In addition, in order to verify the reliability of the pileup removal technique, dif-ferential cross sections were calculated separately for low pileup and high-pileup runs. These two cross sections were found to be consistent.
IX. THEORETICAL PREDICTIONS
The expected prompt-photon production cross section was estimated using the JETPHOX 1.3 Monte Carlo pro-gram [15,16], which implements a full NLO QCD calcu-lation of both the direct and fragmentation contributions to the total cross section. The parton-level isolation, de-fined as the total ETfrom the partons produced with the
photon inside a cone of radius ∆R = 0.4 in η × φ around the photon direction, is required to be smaller than 7 GeV. The fragmentation contribution in the JETPHOX cal-culation decreases with increasing ETγ and becomes neg-ligible for ETγ > 500 GeV. Further details of the JETPHOX calculation can be found in Ref. [34]. The calculation uses the NLO photon fragmentation function of BFG set II [35]. The CT10 [36] and MSTW2008NLO [37] PDFs for the proton are provided by the LHAPDF package [38]. The nominal renormalization (µR), factorization (µF)
and fragmentation (µf) scales were set to the photon
transverse energy (µR = µF = µf = E γ
T). Systematic
uncertainties on the QCD cross sections are estimated and listed below.
• The scale uncertainty is evaluated by varying the three scales following the constraints and are added in quadrature [34]: – µR= µF = µf ∈ [E γ T/2, 2E γ T]; – µR∈ [ETγ/2, 2E γ T], µF = µf = EγT; – µF ∈ [EγT/2, 2E γ T], µR= µf = EγT; – µf ∈ [ETγ/2, 2E γ T], µR= µF = EγT;
This leads to a change of between 12% and 20% in the predicted cross section.
• The uncertainty on the differential cross section due to insufficient knowledge of the PDFs was obtained by repeating the JETPHOX calculation for 52 eigen-vector sets of the CT10 PDF and applying a scal-ing factor in order to obtain the uncertainty for the 68% confidence-level (CL) interval [34]. The corre-sponding uncertainty on the cross section increases
with ETγ and varies between a 5% at ETγ ' 100 GeV and 15% at EγT' 900 GeV.
• The effect of the uncertainty on the value of the strong coupling constant, αs, is evaluated following
the recommendation in Ref. [36]. This was done us-ing different CT10 PDF sets with αsvalues varied
by ±0.002 around the central value, αs = 0.118.
Then, a scaling factor was applied in order to ob-tain the uncerob-tainty for the 68% CL interval. The average αsuncertainty on the cross section is 4.5%,
with a small dependence on ETγ.
In the following, the total uncertainty includes the three sources above added in quadrature. In addition the uncertainty arising from the scale variations, which is the largest of these three contributions, will be shown separately.
In order to perform a proper comparison with the JETPHOX calculation, the effects of hadronization, pileup and the underlying event have to be understood because the isolation energy is directly sensitive to these effects. The ambient-energy-density correction used for the Eiso T
reconstruction reduces the effects from the underlying event and pileup, but this effect may not be completely taken into account. Using PYTHIA and HERWIG with dif-ferent tunes, the combined effect from hadronization and the underlying event is estimated to be about ±1%. This correction is small compared to the full uncertainty from other sources and is not included in the total theoretical uncertainty.
The measured cross sections are also compared to those from the LO parton-shower generators, PYTHIA and HERWIG. These models are described in Sec. III B. Both simulate the fragmentation components through the emission of photons in the parton shower.
X. RESULTS
The differential cross section for the production of iso-lated prompt photons is obtained from the number of signal events as discussed in Sec.VII. The measured ETγ -differential cross sections together with the theoretical predictions are shown in Figs.4and5for the barrel and end-cap ηγ regions, respectively. TablesI andIIlist the values of the differential cross sections shown in these fig-ures. Figure6 and TableIII show the cross section as a function of ηγ for Eγ
T > 100 GeV. The full error bars
on the data points represent the combination of statis-tical and systematic uncertainties. The inner error bars show statistical uncertainties. The shaded bands on the NLO predictions show the theoretical uncertainties as discussed in Sec. IX. The theoretical uncertainties due to the choice of factorization and renormalization scales as well as the fragmentation scale are shown as an inner band.
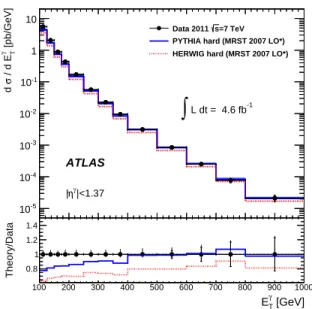
The NLO calculations agree with the data up to the highest ETγ considered. The data are somewhat higher
100 200 300 400 500 600 700 800 900 1000 -5 10 -4 10 -3 10 -2 10 -1 10 1 10
100200300400500600700800900
1000
[pb/GeV] γ T / d E σ d -5 10 -4 10 -3 10 -2 10 -1 10 1 10100200300400500600700800900
1000
[pb/GeV] γ T / d E σ d -5 10 -4 10 -3 10 -2 10 -1 10 1 10 |<1.37 γ η | =7 TeV s Data 2011 PYTHIA (MRST 2007 LO*) HERWIG (MRST 2007 LO*) NLO (Jetphox) CT10 Total uncertainty Scale uncertainty NLO (Jetphox) MSTW2008nlo-1 L dt = 4.6 fb
∫
ATLAS 100 200 300 400 500 600 700 800 900 1000 0.5 0.6 0.7 0.8 0.9 1 1.1 1.2 1.3 1.4 [GeV] γ T E 100 200 300 400 500 600 700 800 900 1000 0.6 0.8 1 1.2 1.4 Theory/DataFIG. 4. Measured (dots with error bars) and expected inclu-sive prompt photon cross section as a function of the photon transverse energy, ETγ, in the barrel ηγ region. The inner
error bars on the data points show statistical uncertainties, while the full error bars show statistical and systematic un-certainties added in quadrature. The NLO theory prediction is shown with the shaded bands that indicate the scale uncer-tainty (the inner yellow band) and the total unceruncer-tainty (the outer green band), which also includes the PDF and αs
uncer-tainties. The LO parton-shower MC generators are shown as lines. The bottom panel shows the corresponding theory/data ratio, in which the data points are centered at one.
than the central NLO calculation for low ETγ, but agree within the theoretical uncertainty of the NLO calcula-tion. This trend is also visible throughout ηγ as it is
dominated by the low ETγ range of the measurement. At low ETγ, the observed difference between the NLO pre-dictions based CT10 PDF and MSTW2008NLO PDF are larger than the PDF uncertainty estimated using CT10. The difference between CT10 and MSTW2008NLO pre-dictions is smaller than the CT10 PDF uncertainty for ETγ > 600 GeV.
The predictions of the LO parton-shower MC gener-ators, PYTHIA and HERWIG, are also shown in Figs. 4-6. The PYTHIA model describes the data fairly well, while HERWIG falls below the data by 10%-20%. The shapes of the cross sections are well described by both models.
The data are also compared to MC predictions that include only direct photons from qg → qγ and q ¯q → gγ processes calculated at LO QCD. Figure 7 shows that these MC generators predict a cross section at low ETγ that is 20% lower than the data which includes all the higher-order fragmentation processes. This difference is reduced at high ETγ, where the contribution from pho-tons originating from fragmentation becomes small. This shows that the higher order fragmentation processes con-tribute significatly to the shape of the predicted EγTcross section. 100 150 200 250 300 350 400 450 500 550 600 -5 10 -4 10 -3 10 -2 10 -1 10 1 10
100150200250300350400450500550600
[pb/GeV] γ T / d E σ d -5 10 -4 10 -3 10 -2 10 -1 10 1 10100150200250300350400450500550600
[pb/GeV] γ T / d E σ d -5 10 -4 10 -3 10 -2 10 -1 10 1 10 |<2.37 γ η 1.52<| =7 TeV s Data 2011 PYTHIA (MRST 2007 LO*) HERWIG (MRST 2007 LO*) NLO (Jetphox) CT10 Total uncertainty Scale uncertainty NLO (Jetphox) MSTW2008nlo-1 L dt = 4.6 fb
∫
ATLAS 100 150 200 250 300 350 400 450 500 550 600 0.5 0.6 0.7 0.8 0.9 1 1.1 1.2 1.3 1.4 [GeV] γ T E 100 150 200 250 300 350 400 450 500 550 600 0.6 0.8 1 1.2 1.4 Theory/DataFIG. 5. Measured (dots with error bars) and expected in-clusive prompt photon cross section in the end-cap region. The inner error bars on the data points show statistical un-certainties, while the full error bars show statistical and sys-tematic uncertainties added in quadrature. The NLO theory prediction is shown with the shaded bands that indicate the scale uncertainty (the inner yellow band) and the total uncer-tainty (the outer green band), which also includes the PDF and αs uncertainties. The LO parton-shower MC generators
are shown as lines.
0 0.5 1 1.5 2 2.5 50 100 150 200 250 300 350 400
0
0.5
1
1.5
2
2.5
[pb] γ η / d σ d 100 200 300 4000
0.5
1
1.5
2
2.5
[pb] γ η / d σ d 100 200 300 400 >100 GeV γ TE Data 2011 PYTHIA (MRST 2007 LO*)s=7 TeV
HERWIG (MRST 2007 LO*) NLO (Jetphox) CT10
Total uncertainty Scale uncertainty NLO (Jetphox) MSTW2008nlo
-1 L dt = 4.6 fb
∫
ATLAS 0 0.5 1 1.5 2 2.5 0.7 0.8 0.9 1 1.1 1.2 | γ η | 0 0.5 1 1.5 2 2.5 0.8 1 1.2 Theory/DataFIG. 6. Measured and expected inclusive prompt photon cross section as a function of |ηγ|, for photons with trans-verse energies above 100 GeV excluding 1.37 < |ηγ| < 1.52. The data points show full error bars that contain statistical, systematic, and luminosity uncertainties added in quadrature, and are negligible. The NLO theory prediction is shown with the shaded bands that indicate the scale uncertainty (the in-ner yellow band) and the total uncertainty (the outer green band), which also includes the PDF and αsuncertainties. The
100 200 300 400 500 600 700 800 900 1000 -5 10 -4 10 -3 10 -2 10 -1 10 1 10
100200300400500600700800900
1000
[pb/GeV] γ T / d E σ d -5 10 -4 10 -3 10 -2 10 -1 10 1 10100200300400500600700800900
1000
[pb/GeV] γ T / d E σ d -5 10 -4 10 -3 10 -2 10 -1 10 1 10 |<1.37 γ η | =7 TeV s Data 2011PYTHIA hard (MRST 2007 LO*) HERWIG hard (MRST 2007 LO*)
-1 L dt = 4.6 fb
∫
ATLAS 100 200 300 400 500 600 700 800 900 1000 0.7 0.8 0.9 1 1.1 1.2 1.3 1.4 [GeV] γ T E 100 200 300 400 500 600 700 800 900 1000 0.8 1 1.2 1.4 Theory/DataFIG. 7. Same data as in Fig.4, but the comparison is made with MC predictions that include only direct photons from the hard processes.
The total inclusive cross section of direct photons cal-culated in the kinematic region ETγ > 100 GeV, |ηγ| < 1.37 and Eiso
T ≤ 7 GeV is
σ(γ + X) = 236 ± 2 (stat)+13−9 (syst) ± 4 (lumi) pb. PYTHIA predicts that this cross section is 224 pb while HERWIG predicts 187 pb. The cross section was calcu-lated from the total number of signal events in the given kinematic region. The NLO calculations with the CT10 and MSTW2008NLO PDFs predict 203 ± 25 (theory) pb and 212 ± 24 (theory) pb, respectively, where the theory uncertainty is symmetrized and includes the scale, PDF and αsuncertainties.
The total inclusive cross section for direct photons within the kinematic range ETγ > 100 GeV, 1.52 ≤ |ηγ| <
2.37 and EisoT ≤ 7 GeV is
σ(γ + X) = 123 ± 1 (stat)+9−7(syst) ± 2 (lumi) pb, which can be compared to predictions of 118 pb (PYTHIA) and 99 pb (HERWIG). The NLO calculations based on CT10 and MSTW2008NLO PDFs predict 105 ± 15 (the-ory) pb and 109 ± 15 (the(the-ory) pb, respectively.
XI. CONCLUSION
A measurement of the differential cross sections for the inclusive production of isolated prompt photons in pp collisions at a center-of-mass energy of√s = 7 TeV was presented using 4.6 fb−1 of collision data collected with the ATLAS detector at the LHC. The cross sections were measured as a function of photon transverse energy ETγ and pseudorapidity ηγ. The Eγ
T kinematic range of this
measurement spans from 100 GeV to 1 TeV, thus signif-icantly extending the measured kinematic range previ-ously published [4] by ATLAS. The measured differential cross section falls by more than five orders of magnitude in this kinematic range.
Both PYTHIA and HERWIG describe the shapes of the differential cross sections. The HERWIG generator pre-dicts a smaller cross section compared to PYTHIA and the data. The MC studies presented in this paper indicate that fragmentation contributions are needed for a good description of the data.
The data agree with the NLO predictions based on the CT10 and MSTW2008 PDF up to the highest measured EγT ' 1 TeV. In this kinematic regime, the theoretical uncertainties due to the PDFs of the proton become sig-nificant. Thus the presented cross sections have the po-tential to provide additional constraints on the proton PDFs.
EγTbin [GeV] dσ/dEγT ± (stat.) ± (syst.) [pb/GeV] 100 − 125 5.55 ±0.02 +0.30 −0.21 125 − 150 2.06 ±0.01 +0.12 −0.08 150 − 175 8.82 ±0.07 +0.45 −0.32 ×10 −01 175 − 200 4.28 ±0.05 +0.27 −0.15 ×10 −01 200 − 250 1.71 ±0.01 +0.11 −0.06 ×10 −01 250 − 300 5.65 ±0.07 +0.33 −0.24 ×10 −02 300 − 350 2.25 ±0.04 +0.14 −0.09 ×10 −02 350 − 400 9.43 ±0.21 +0.67 −0.40 ×10 −03 400 − 500 3.12 ±0.08 +0.26 −0.14 ×10 −03 500 − 600 8.44 ±0.44 +0.82 −0.58 ×10 −04 600 − 700 2.50 ±0.24 +0.32 −0.26 ×10 −04 700 − 800 7.77 ±1.30 +1.49 −1.36 ×10 −05 800 − 1000 2.11 ±0.48 +0.53 −0.49 ×10 −05
TABLE I. Measured inclusive prompt photon production cross section in the pseudorapidity range |ηγ| < 1.37 as a function of EγTwith statistical and systematic uncertainties.
ACKNOWLEDGEMENTS
We thank CERN for the very successful operation of the LHC, as well as the support staff from our institutions without whom ATLAS could not be operated efficiently. We acknowledge the support of ANPCyT, Argentina; YerPhI, Armenia; ARC, Australia; BMWF and FWF, Austria; ANAS, Azerbaijan; SSTC, Belarus; CNPq and FAPESP, Brazil; NSERC, NRC and CFI, Canada; CERN; CONICYT, Chile; CAS, MOST and NSFC, China; COLCIENCIAS, Colombia; MSMT CR, MPO CR and VSC CR, Czech Republic; DNRF, DNSRC and Lundbeck Foundation, Denmark; EPLANET, ERC and NSRF, European Union; IN2P3-CNRS, CEA-DSM/IRFU, France; GNSF, Georgia; BMBF, DFG,
ETγ bin [GeV] dσ/dETγ ± (stat.) ± (syst.) [pb/GeV] 100 − 125 3.03 ±0.01 +0.19 −0.19 125 − 150 1.06 ±0.01 +0.09 −0.06 150 − 175 4.34 ±0.05 +0.27 −0.24 ×10 −01 175 − 200 1.90 ±0.03 +0.16 −0.10 ×10 −01 200 − 250 6.84 ±0.08 +0.57 −0.37 ×10 −02 250 − 300 1.89 ±0.04 +0.16 −0.12 ×10 −02 300 − 350 5.52 ±0.22 +0.60 −0.36 ×10 −03 350 − 400 1.76 ±0.10 +0.19 −0.16 ×10 −03 400 − 500 3.93 ±0.32 +0.58 −0.46 ×10 −04 500 − 600 6.83 ±1.35 +1.53 −1.74 ×10 −05
TABLE II. Measured inclusive prompt photon production cross section in the pseudorapidity range 1.52 ≤ |ηγ| < 2.37 as a function of EγTwith statistical and systematic uncertainties.
|ηγ| bin dσ/d|ηγ| ± (stat.) ± (syst.) [pb]
0.0 − 0.2 1.72 ±0.01 +0.08 −0.09 ×10 +02 0.2 − 0.4 1.71 ±0.01 +0.08 −0.08 ×10 +02 0.4 − 0.6 1.75 ±0.01 +0.09 −0.07 ×10 +02 0.6 − 0.8 1.77 ±0.01 +0.10 −0.06 ×10+02 0.8 − 1.0 1.73 ±0.01 +0.09 −0.07 ×10+02 1.0 − 1.2 1.75 ±0.01 +0.11 −0.06 ×10 +02 1.2 − 1.37 1.76 ±0.01 +0.13 −0.06 ×10 +02 1.52 − 1.8 1.68 ±0.01 +0.12 −0.11 ×10 +02 1.8 − 2.0 1.46 ±0.01 +0.10 −0.08 ×10+02 2.0 − 2.2 1.41 ±0.01 +0.09 −0.07 ×10+02 2.2 − 2.37 1.17 ±0.01 +0.07 −0.07 ×10 +02
TABLE III. Measured inclusive prompt photon production cross section for ETγ > 100 GeV as a function of |ηγ| with statistical and systematic uncertainties.
HGF, MPG and AvH Foundation, Germany; GSRT and NSRF, Greece; ISF, MINERVA, GIF, DIP and Benoziyo Center, Israel; INFN, Italy; MEXT and JSPS, Japan; CNRST, Morocco; FOM and NWO, Netherlands; BRF and RCN, Norway; MNiSW, Poland; GRICES and FCT, Portugal; MERYS (MECTS), Romania; MES of Rus-sia and ROSATOM, RusRus-sian Federation; JINR; MSTD, Serbia; MSSR, Slovakia; ARRS and MIZˇS, Slovenia; DST/NRF, South Africa; MICINN, Spain; SRC and Wallenberg Foundation, Sweden; SER, SNSF and Can-tons of Bern and Geneva, Switzerland; NSC, Taiwan; TAEK, Turkey; STFC, the Royal Society and Lever-hulme Trust, United Kingdom; DOE and NSF, United States of America.
The crucial computing support from all WLCG part-ners is acknowledged gratefully, in particular from CERN and the ATLAS Tier-1 facilities at TRIUMF (Canada), NDGF (Denmark, Norway, Sweden), CC-IN2P3 (France), KIT/GridKA (Germany), INFN-CNAF
(Italy), NL-T1 (Netherlands), PIC (Spain), ASGC (Tai-wan), RAL (UK) and BNL (USA) and in the Tier-2 fa-cilities worldwide.
[1] P. Aurenche, R. Baier, M. Fontannaz, and D. Schiff,
Nucl. Phys. B 297, 661 (1988).
[2] P. Aurenche, R. Baier, M. Fontannaz, J. F. Owens, and M. Werlen,Phys. Rev. D 39, 3275 (1989).
[3] ATLAS Collaboration,Phys. Rev. D 83, 052005 (2011),
arXiv:1012.4389 [hep-ex].
[4] ATLAS Collaboration, Phys. Lett. B 706, 150 (2011),
arXiv:1108.0253 [hep-ex].
[5] CMS Collaboration, Phys. Rev. Lett. 106, 082001 (2011),
arXiv:1012.0799 [hep-ex].
[6] CMS Collaboration, Phys. Rev. D 84, 052011 (2011),
arXiv:1108.2044 [hep-ex].
[7] D. Acosta et al. (CDF),Phys. Rev. D 65, 112003 (2002),
arXiv:hep-ex/0201004 [hep-ex].
[8] D. Acosta et al. (CDF),Phys. Rev. D 70, 074008 (2004),
arXiv:hep-ex/0404022 [hep-ex].
[9] D. Acosta et al. (CDF), Phys. Rev. D 80, 111106(R) (2009),arXiv:0910.3623 [hep-ex].
[10] V. Abazov et al. (D0), Phys. Lett. D 639, 151 (2006),
arXiv:051.1054 [hep-ex].
[11] C. Albajar et al. (UA1), Phys. Lett. B 209, 385 (1988). [12] J. Alitti et al. (UA2), Phys. Lett. B 263, 544 (1991). [13] ATLAS uses a right-handed coordinate system with its
origin at the nominal interaction point (IP) in the cen-ter of the detector, and the z-axis along the beam line. The x-axis points from the IP to the center of the LHC ring, and the y-axis points upwards. Cylindrical coordi-nates (r, φ) are used in the transverse plane, φ being the azimuthal angle around the beam line. Observables la-beled “transverse” are projected into the x–y plane. The pseudorapidity is defined in terms of the polar angle θ as η = − ln tan(θ/2).
[14] ATLAS Collaboration, Eur. Phys. J. C 73, 1 (2013),
arXiv:1302.4393 [hep-ex].
[15] S. Catani et al., J. High Energy Phys. 0205, 028 (2002),
arXiv:hep-ph/0204023 [hep-ph].
[16] P. Aurenche, M. Fontannaz, J.-P. Guillet, E. Pilon, and M. Werlen, Phys. Rev. D 73, 094007 (2006), arXiv:hep-ph/0602133.
[17] ATLAS Collaboration,J. High Energy Phys. 1301, 086 (2013).
[18] ATLAS Collaboration,JINST 3, S08003 (2008). [19] The leading primary vertex is defined as the vertex with
the highestP |pT|2 of tracks.
[20] T. Sj¨ostrand, S. Mrenna, and P. Z. Skands,J. High En-ergy Phys. 0605, 026 (2006).
[21] A. Sherstnev and R. S. Thorne,Eur. Phys. J. C 55, 553 (2008).
[22] ATLAS Collaboration,“ATLAS tunes of PYTHIA 6 and Pythia 8 for MC11,” (2011), ATL-PHYS-PUB-2011-009. [23] S. Agostinelli et al. (GEANT4),Nucl. Instrum. Methods
Phys. A 506, 250 (2003).
[24] ATLAS Collaboration, Eur. Phys. J. C 70, 823 (2010),
arXiv:1005.4568 [physics.ins-det].
[25] G. Corcella et al.,J. High Energy Phys. 0101, 010 (2001),
arXiv:hep-ph/0011363 [hep-ph].
[26] ATLAS Collaboration, “New ATLAS event generator tunes to 2010 data,” (2011), ATL-PHYS-PUB-2011-008. [27] ATLAS Collaboration,Expected Performance of the AT-LAS Experiment, Detector, Trigger and Physics (CERN-OPEN-2008-020, Geneva, 2009) arXiv:0901.0512 [hep-ex].
[28] ATLAS Collaboration,Eur. Phys. J. C 72, 1909 (2012),
arXiv:1110.3174 [hep-ex].
[29] M. Cacciari, G. P. Salam, and G. Soyez,J. High Energy Phys. 04, 0804 (2008).
[30] M. Cacciari, G. P. Salam, and S. Sapeta,J. High Energy Phys. 04, 1004 (2010),arXiv:0912.4926 [hep-ph]. [31] W. Lampl et al, ATL-LARG-PUB-2008-002 (2008). [32] ATLAS Collaboration,ATLAS-CONF-2012-123 (2012). [33] ATLAS Collaboration,“Performance of the Electron and Photon Trigger in p-p Collisions at√s=7 TeV with the ATLAS Detector at the LHC in 2011,” (2012), ATLAS-CONF-2012-048.
[34] R. Blair et al., “NLO Theoretical Predictions for Pho-ton Measurements Using the PHOX Generators,” CERN-OPEN-2011-041 (2011).
[35] L. Bourhis, M. Fontannaz, and J. Guillet, Eur. Phys. J. C2, 529 (1998),arXiv:hep-ph/9704447.
[36] H.-L. Lai et al., Phys. Rev. D 82, 074024 (2010),
arXiv:1007.2241 [hep-ph].
[37] A. Martin, W. Stirling, R. Thorne, and G. Watt,
Eur. Phys. J. C 63, 189 (2009), arXiv:0901.0002 [hep-ph].
[38] W. Giele, E. N. Glover, I. Hinchliffe, J. Huston, L. Eric, et al., , 275 (2002),arXiv:hep-ph/0204316 [hep-ph].
The ATLAS Collaboration
G. Aad48, T. Abajyan21, B. Abbott112, J. Abdallah12, S. Abdel Khalek116, A.A. Abdelalim49, O. Abdinov11, R. Aben106, B. Abi113, M. Abolins89, O.S. AbouZeid159, H. Abramowicz154, H. Abreu137, Y. Abulaiti147a,147b,
B.S. Acharya165a,165b,a, L. Adamczyk38a, D.L. Adams25, T.N. Addy56, J. Adelman177, S. Adomeit99, T. Adye130,
S. Aefsky23, T. Agatonovic-Jovin13b, J.A. Aguilar-Saavedra125b,b, M. Agustoni17, S.P. Ahlen22, F. Ahles48,
A. Ahmad149, M. Ahsan41, G. Aielli134a,134b, T.P.A. ˚Akesson80, G. Akimoto156, A.V. Akimov95, M.A. Alam76,
J. Albert170, S. Albrand55, M.J. Alconada Verzini70, M. Aleksa30, I.N. Aleksandrov64, F. Alessandria90a,
C. Alexa26a, G. Alexander154, G. Alexandre49, T. Alexopoulos10, M. Alhroob165a,165c, M. Aliev16, G. Alimonti90a, J. Alison31, B.M.M. Allbrooke18, L.J. Allison71, P.P. Allport73, S.E. Allwood-Spiers53, J. Almond83,
A. Aloisio103a,103b, R. Alon173, A. Alonso36, F. Alonso70, A. Altheimer35, B. Alvarez Gonzalez89,
M.G. Alviggi103a,103b, K. Amako65, Y. Amaral Coutinho24a, C. Amelung23, V.V. Ammosov129,∗,
S.P. Amor Dos Santos125a, A. Amorim125a,c, S. Amoroso48, N. Amram154, C. Anastopoulos30, L.S. Ancu17, N. Andari30, T. Andeen35, C.F. Anders58b, G. Anders58a, K.J. Anderson31, A. Andreazza90a,90b, V. Andrei58a, X.S. Anduaga70, S. Angelidakis9, P. Anger44, A. Angerami35, F. Anghinolfi30, A.V. Anisenkov108, N. Anjos125a,
A. Annovi47, A. Antonaki9, M. Antonelli47, A. Antonov97, J. Antos145b, F. Anulli133a, M. Aoki102,
L. Aperio Bella18, R. Apolle119,d, G. Arabidze89, I. Aracena144, Y. Arai65, A.T.H. Arce45, S. Arfaoui149,
J-F. Arguin94, S. Argyropoulos42, E. Arik19a,∗, M. Arik19a, A.J. Armbruster88, O. Arnaez82, V. Arnal81,
A. Artamonov96, G. Artoni23, D. Arutinov21, S. Asai156, N. Asbah94, S. Ask28, B. ˚Asman147a,147b, L. Asquith6, K. Assamagan25, R. Astalos145a, A. Astbury170, M. Atkinson166, B. Auerbach6, E. Auge116, K. Augsten127,
M. Aurousseau146b, G. Avolio30, D. Axen169, G. Azuelos94,e, Y. Azuma156, M.A. Baak30, C. Bacci135a,135b,
A.M. Bach15, H. Bachacou137, K. Bachas155, M. Backes49, M. Backhaus21, J. Backus Mayes144, E. Badescu26a,
P. Bagiacchi133a,133b, P. Bagnaia133a,133b, Y. Bai33a, D.C. Bailey159, T. Bain35, J.T. Baines130, O.K. Baker177,
S. Baker77, P. Balek128, F. Balli137, E. Banas39, P. Banerjee94, Sw. Banerjee174, D. Banfi30, A. Bangert151, V. Bansal170, H.S. Bansil18, L. Barak173, S.P. Baranov95, T. Barber48, E.L. Barberio87, D. Barberis50a,50b, M. Barbero84, D.Y. Bardin64, T. Barillari100, M. Barisonzi176, T. Barklow144, N. Barlow28, B.M. Barnett130,
R.M. Barnett15, A. Baroncelli135a, G. Barone49, A.J. Barr119, F. Barreiro81, J. Barreiro Guimar˜aes da Costa57,
R. Bartoldus144, A.E. Barton71, V. Bartsch150, A. Basye166, R.L. Bates53, L. Batkova145a, J.R. Batley28,
A. Battaglia17, M. Battistin30, F. Bauer137, H.S. Bawa144,f, S. Beale99, T. Beau79, P.H. Beauchemin162, R. Beccherle50a, P. Bechtle21, H.P. Beck17, K. Becker176, S. Becker99, M. Beckingham139, K.H. Becks176,
A.J. Beddall19c, A. Beddall19c, S. Bedikian177, V.A. Bednyakov64, C.P. Bee84, L.J. Beemster106, T.A. Beermann176,
M. Begel25, C. Belanger-Champagne86, P.J. Bell49, W.H. Bell49, G. Bella154, L. Bellagamba20a, A. Bellerive29,
M. Bellomo30, A. Belloni57, O.L. Beloborodova108,g, K. Belotskiy97, O. Beltramello30, O. Benary154,
D. Benchekroun136a, K. Bendtz147a,147b, N. Benekos166, Y. Benhammou154, E. Benhar Noccioli49,
J.A. Benitez Garcia160b, D.P. Benjamin45, J.R. Bensinger23, K. Benslama131, S. Bentvelsen106, D. Berge30, E. Bergeaas Kuutmann16, N. Berger5, F. Berghaus170, E. Berglund106, J. Beringer15, P. Bernat77, R. Bernhard48,
C. Bernius78, F.U. Bernlochner170, T. Berry76, C. Bertella84, F. Bertolucci123a,123b, M.I. Besana90a,90b,
G.J. Besjes105, N. Besson137, S. Bethke100, W. Bhimji46, R.M. Bianchi124, L. Bianchini23, M. Bianco72a,72b,
O. Biebel99, S.P. Bieniek77, K. Bierwagen54, J. Biesiada15, M. Biglietti135a, H. Bilokon47, M. Bindi20a,20b,
S. Binet116, A. Bingul19c, C. Bini133a,133b, B. Bittner100, C.W. Black151, J.E. Black144, K.M. Black22,
D. Blackburn139, R.E. Blair6, J.-B. Blanchard137, T. Blazek145a, I. Bloch42, C. Blocker23, J. Blocki39, W. Blum82, U. Blumenschein54, G.J. Bobbink106, V.S. Bobrovnikov108, S.S. Bocchetta80, A. Bocci45, C.R. Boddy119,
M. Boehler48, J. Boek176, T.T. Boek176, N. Boelaert36, J.A. Bogaerts30, A.G. Bogdanchikov108, A. Bogouch91,∗,
C. Bohm147a, J. Bohm126, V. Boisvert76, T. Bold38a, V. Boldea26a, N.M. Bolnet137, M. Bomben79, M. Bona75,
M. Boonekamp137, S. Bordoni79, C. Borer17, A. Borisov129, G. Borissov71, M. Borri83, S. Borroni42, J. Bortfeldt99,
V. Bortolotto135a,135b, K. Bos106, D. Boscherini20a, M. Bosman12, H. Boterenbrood106, J. Bouchami94, J. Boudreau124, E.V. Bouhova-Thacker71, D. Boumediene34, C. Bourdarios116, N. Bousson84, S. Boutouil136d,
A. Boveia31, J. Boyd30, I.R. Boyko64, I. Bozovic-Jelisavcic13b, J. Bracinik18, P. Branchini135a, A. Brandt8,
G. Brandt15, O. Brandt54, U. Bratzler157, B. Brau85, J.E. Brau115, H.M. Braun176,∗, S.F. Brazzale165a,165c,
B. Brelier159, J. Bremer30, K. Brendlinger121, R. Brenner167, S. Bressler173, T.M. Bristow46, D. Britton53,
F.M. Brochu28, I. Brock21, R. Brock89, F. Broggi90a, C. Bromberg89, J. Bronner100, G. Brooijmans35, T. Brooks76, W.K. Brooks32b, E. Brost115, G. Brown83, P.A. Bruckman de Renstrom39, D. Bruncko145b, R. Bruneliere48, S. Brunet60, A. Bruni20a, G. Bruni20a, M. Bruschi20a, L. Bryngemark80, T. Buanes14, Q. Buat55, F. Bucci49,
J. Buchanan119, P. Buchholz142, R.M. Buckingham119, A.G. Buckley46, S.I. Buda26a, I.A. Budagov64, B. Budick109,
L. Bugge118, O. Bulekov97, A.C. Bundock73, M. Bunse43, T. Buran118,∗, H. Burckhart30, S. Burdin73, T. Burgess14,
S. Burke130, E. Busato34, V. B¨uscher82, P. Bussey53, C.P. Buszello167, B. Butler57, J.M. Butler22, C.M. Buttar53, J.M. Butterworth77, W. Buttinger28, M. Byszewski10, S. Cabrera Urb´an168, D. Caforio20a,20b, O. Cakir4a, P. Calafiura15, G. Calderini79, P. Calfayan99, R. Calkins107, L.P. Caloba24a, R. Caloi133a,133b, D. Calvet34,
S. Calvet34, R. Camacho Toro49, P. Camarri134a,134b, D. Cameron118, L.M. Caminada15, R. Caminal Armadans12, S. Campana30, M. Campanelli77, V. Canale103a,103b, F. Canelli31, A. Canepa160a, J. Cantero81, R. Cantrill76, T. Cao40, M.D.M. Capeans Garrido30, I. Caprini26a, M. Caprini26a, D. Capriotti100, M. Capua37a,37b, R. Caputo82,
R. Cardarelli134a, T. Carli30, G. Carlino103a, L. Carminati90a,90b, S. Caron105, E. Carquin32b,
G.D. Carrillo-Montoya146c, A.A. Carter75, J.R. Carter28, J. Carvalho125a,h, D. Casadei109, M.P. Casado12,
M. Cascella123a,123b, C. Caso50a,50b,∗, E. Castaneda-Miranda174, A. Castelli106, V. Castillo Gimenez168,
N.F. Castro125a, G. Cataldi72a, P. Catastini57, A. Catinaccio30, J.R. Catmore30, A. Cattai30, G. Cattani134a,134b, S. Caughron89, V. Cavaliere166, D. Cavalli90a, M. Cavalli-Sforza12, V. Cavasinni123a,123b, F. Ceradini135a,135b,
B. Cerio45, A.S. Cerqueira24b, A. Cerri15, L. Cerrito75, F. Cerutti15, A. Cervelli17, S.A. Cetin19b, A. Chafaq136a,
D. Chakraborty107, I. Chalupkova128, K. Chan3, P. Chang166, B. Chapleau86, J.D. Chapman28, J.W. Chapman88,
D.G. Charlton18, V. Chavda83, C.A. Chavez Barajas30, S. Cheatham86, S. Chekanov6, S.V. Chekulaev160a,
G.A. Chelkov64, M.A. Chelstowska105, C. Chen63, H. Chen25, S. Chen33c, X. Chen174, Y. Chen35, Y. Cheng31, A. Cheplakov64, R. Cherkaoui El Moursli136e, V. Chernyatin25, E. Cheu7, S.L. Cheung159, L. Chevalier137, V. Chiarella47, G. Chiefari103a,103b, J.T. Childers30, A. Chilingarov71, G. Chiodini72a, A.S. Chisholm18,
R.T. Chislett77, A. Chitan26a, M.V. Chizhov64, G. Choudalakis31, S. Chouridou9, B.K.B. Chow99, I.A. Christidi77,
A. Christov48, D. Chromek-Burckhart30, M.L. Chu152, J. Chudoba126, G. Ciapetti133a,133b, A.K. Ciftci4a, R. Ciftci4a,
D. Cinca62, V. Cindro74, A. Ciocio15, M. Cirilli88, P. Cirkovic13b, Z.H. Citron173, M. Citterio90a, M. Ciubancan26a, A. Clark49, P.J. Clark46, R.N. Clarke15, J.C. Clemens84, B. Clement55, C. Clement147a,147b, Y. Coadou84,
M. Cobal165a,165c, A. Coccaro139, J. Cochran63, S. Coelli90a, L. Coffey23, J.G. Cogan144, J. Coggeshall166, J. Colas5,
S. Cole107, A.P. Colijn106, N.J. Collins18, C. Collins-Tooth53, J. Collot55, T. Colombo120a,120b, G. Colon85,
G. Compostella100, P. Conde Mui˜no125a, E. Coniavitis167, M.C. Conidi12, S.M. Consonni90a,90b, V. Consorti48,
S. Constantinescu26a, C. Conta120a,120b, G. Conti57, F. Conventi103a,i, M. Cooke15, B.D. Cooper77,
A.M. Cooper-Sarkar119, N.J. Cooper-Smith76, K. Copic15, T. Cornelissen176, M. Corradi20a, F. Corriveau86,j, A. Corso-Radu164, A. Cortes-Gonzalez166, G. Cortiana100, G. Costa90a, M.J. Costa168, D. Costanzo140, D. Cˆot´e30,
G. Cottin32a, L. Courneyea170, G. Cowan76, B.E. Cox83, K. Cranmer109, S. Cr´ep´e-Renaudin55, F. Crescioli79,
M. Cristinziani21, G. Crosetti37a,37b, C.-M. Cuciuc26a, C. Cuenca Almenar177, T. Cuhadar Donszelmann140,
J. Cummings177, M. Curatolo47, C.J. Curtis18, C. Cuthbert151, H. Czirr142, P. Czodrowski44, Z. Czyczula177,
S. D’Auria53, M. D’Onofrio73, A. D’Orazio133a,133b, M.J. Da Cunha Sargedas De Sousa125a, C. Da Via83, W. Dabrowski38a, A. Dafinca119, T. Dai88, F. Dallaire94, C. Dallapiccola85, M. Dam36, D.S. Damiani138, A.C. Daniells18, H.O. Danielsson30, V. Dao105, G. Darbo50a, G.L. Darlea26c, S. Darmora8, J.A. Dassoulas42,
W. Davey21, T. Davidek128, E. Davies119,d, M. Davies94, O. Davignon79, A.R. Davison77, Y. Davygora58a,
E. Dawe143, I. Dawson140, R.K. Daya-Ishmukhametova23, K. De8, R. de Asmundis103a, S. De Castro20a,20b,
S. De Cecco79, J. de Graat99, N. De Groot105, P. de Jong106, C. De La Taille116, H. De la Torre81, F. De Lorenzi63, L. De Nooij106, D. De Pedis133a, A. De Salvo133a, U. De Sanctis165a,165c, A. De Santo150, J.B. De Vivie De Regie116, G. De Zorzi133a,133b, W.J. Dearnaley71, R. Debbe25, C. Debenedetti46, B. Dechenaux55, D.V. Dedovich64,
J. Degenhardt121, J. Del Peso81, T. Del Prete123a,123b, T. Delemontex55, M. Deliyergiyev74, A. Dell’Acqua30,
L. Dell’Asta22, M. Della Pietra103a,i, D. della Volpe103a,103b, M. Delmastro5, P.A. Delsart55, C. Deluca106,
S. Demers177, M. Demichev64, A. Demilly79, B. Demirkoz12,k, S.P. Denisov129, D. Derendarz39, J.E. Derkaoui136d,
F. Derue79, P. Dervan73, K. Desch21, P.O. Deviveiros106, A. Dewhurst130, B. DeWilde149, S. Dhaliwal106,
R. Dhullipudi78,l, A. Di Ciaccio134a,134b, L. Di Ciaccio5, C. Di Donato103a,103b, A. Di Girolamo30, B. Di Girolamo30, S. Di Luise135a,135b, A. Di Mattia153, B. Di Micco135a,135b, R. Di Nardo47, A. Di Simone134a,134b, R. Di Sipio20a,20b,
M.A. Diaz32a, E.B. Diehl88, J. Dietrich42, T.A. Dietzsch58a, S. Diglio87, K. Dindar Yagci40, J. Dingfelder21,
F. Dinut26a, C. Dionisi133a,133b, P. Dita26a, S. Dita26a, F. Dittus30, F. Djama84, T. Djobava51b, M.A.B. do Vale24c,
A. Do Valle Wemans125a,m, T.K.O. Doan5, D. Dobos30, E. Dobson77, J. Dodd35, C. Doglioni49, T. Doherty53, T. Dohmae156, Y. Doi65,∗, J. Dolejsi128, Z. Dolezal128, B.A. Dolgoshein97,∗, M. Donadelli24d, J. Donini34,
J. Dopke30, A. Doria103a, A. Dos Anjos174, A. Dotti123a,123b, M.T. Dova70, A.T. Doyle53, M. Dris10, J. Dubbert88,
S. Dube15, E. Dubreuil34, E. Duchovni173, G. Duckeck99, D. Duda176, A. Dudarev30, F. Dudziak63, L. Duflot116,
M-A. Dufour86, L. Duguid76, M. D¨uhrssen30, M. Dunford58a, H. Duran Yildiz4a, M. D¨uren52, M. Dwuznik38a,
J. Ebke99, S. Eckweiler82, W. Edson2, C.A. Edwards76, N.C. Edwards53, W. Ehrenfeld21, T. Eifert144, G. Eigen14,
K. Einsweiler15, E. Eisenhandler75, T. Ekelof167, M. El Kacimi136c, M. Ellert167, S. Elles5, F. Ellinghaus82, K. Ellis75, N. Ellis30, J. Elmsheuser99, M. Elsing30, D. Emeliyanov130, Y. Enari156, O.C. Endner82,
R. Engelmann149, A. Engl99, J. Erdmann177, A. Ereditato17, D. Eriksson147a, J. Ernst2, M. Ernst25, J. Ernwein137,
D. Errede166, S. Errede166, E. Ertel82, M. Escalier116, H. Esch43, C. Escobar124, X. Espinal Curull12, B. Esposito47,
F. Etienne84, A.I. Etienvre137, E. Etzion154, D. Evangelakou54, H. Evans60, L. Fabbri20a,20b, C. Fabre30, G. Facini30,
R.M. Fakhrutdinov129, S. Falciano133a, Y. Fang33a, M. Fanti90a,90b, A. Farbin8, A. Farilla135a, T. Farooque159, S. Farrell164, S.M. Farrington171, P. Farthouat30, F. Fassi168, P. Fassnacht30, D. Fassouliotis9, B. Fatholahzadeh159, A. Favareto90a,90b, L. Fayard116, P. Federic145a, O.L. Fedin122, W. Fedorko169, M. Fehling-Kaschek48, L. Feligioni84,