HAL Id: hal-03015052
https://hal-amu.archives-ouvertes.fr/hal-03015052
Submitted on 19 Nov 2020
HAL is a multi-disciplinary open access
archive for the deposit and dissemination of
sci-entific research documents, whether they are
pub-lished or not. The documents may come from
teaching and research institutions in France or
abroad, or from public or private research centers.
L’archive ouverte pluridisciplinaire HAL, est
destinée au dépôt et à la diffusion de documents
scientifiques de niveau recherche, publiés ou non,
émanant des établissements d’enseignement et de
recherche français ou étrangers, des laboratoires
publics ou privés.
Blueprint of human thymopoiesis reveals molecular
mechanisms of stage-specific TCR enhancer activation
Agata Cieslak, Guillaume Charbonnier, Melania Tesio, Eve-Lyne Mathieu,
Mohamed Belhocine, Aurore Touzart, Charlotte Smith, Guillaume Hypolite,
Guillaume Andrieu, Joost H.A. Martens, et al.
To cite this version:
Agata Cieslak, Guillaume Charbonnier, Melania Tesio, Eve-Lyne Mathieu, Mohamed Belhocine,
et al.. Blueprint of human thymopoiesis reveals molecular mechanisms of stage-specific TCR
en-hancer activation. Journal of Experimental Medicine, Rockefeller University Press, 2020, 217 (9),
�10.1084/jem.20192360�. �hal-03015052�
ARTICLE
Blueprint of human thymopoiesis reveals molecular
mechanisms of stage-specific TCR enhancer
activation
Agata Cieslak1*, Guillaume Charbonnier2,3*, Melania Tesio1, Eve-Lyne Mathieu2,3, Mohamed Belhocine2,3, Aurore Touzart1,4, Charlotte Smith1,
Guillaume Hypolite1, Guillaume P. Andrieu1, Joost H.A. Martens5, Eva Janssen-Megens5, Marta Gut6,7, Ivo Gut6,7, Nicolas Boissel8, Arnaud Petit9,
Denis Puthier2,3, Elizabeth Macintyre1, Hendrik G. Stunnenberg5, Salvatore Spicuglia2,3**, and Vahid Asnafi1**
Cell differentiation is accompanied by epigenetic changes leading to precise lineage definition and cell identity. Here we
present a comprehensive resource of epigenomic data of human T cell precursors along with an integrative analysis of other
hematopoietic populations. Although T cell commitment is accompanied by large scale epigenetic changes, we observed that
the majority of distal regulatory elements are constitutively unmethylated throughout T cell differentiation, irrespective of
their activation status. Among these, the
TCRA gene enhancer (Eα) is in an open and unmethylated chromatin structure well
before activation. Integrative analyses revealed that the HOXA5-9 transcription factors repress the E
α enhancer at early
stages of T cell differentiation, while their decommission is required for
TCRA locus activation and enforced αβ T lineage
differentiation. Remarkably, the HOXA-mediated repression of E
α is paralleled by the ectopic expression of
homeodomain-related oncogenes in T cell acute lymphoblastic leukemia. These results highlight an analogous enhancer repression
mechanism at play in normal and cancer conditions, but imposing distinct developmental constraints.
Introduction
T lymphocytes develop from a stepwise process of cell fate choices whereby distinct signaling pathways in the thymus cause hematopoietic precursors to commit to the T cell fate, while mobilizing a T cell gene expression program that prepares the cells for TCR expression, TCR-based repertoire selection, and long, versatile careers as immune effectors (Dik et al., 2005b; Rothenberg, 2019;Spits, 2002). However, major questions re-main as the molecular mechanisms involved in this process and the stage-specific regulation of T cell genes are not well defined yet. Despite numerous reports on the dynamics of epigenetic modifications during murine T cell differentiation (Pekowska et al., 2011;Zhang et al., 2012;Hu et al., 2018;Wei et al., 2011), we still have a limited understanding of the epigenetic mecha-nisms controlling human T cell differentiation. Thus, describing
these mechanisms is of crucial importance, given the potential relevance for immune-related diseases (Clave et al., 2018;Kernfeld et al., 2018) as well as for the oncogenic transformation of T cell precursors (Aifantis et al., 2008).
Human T lymphocyte ontogeny in the thymus requires the ordered somatic recombination of V, D, and J gene segments at the TCR loci to determine the development into either γδ or αβ T cell lineages (Dik et al., 2005b;Spits, 2002). While the TCRD, TCRG, and TCRB loci rearrange at the early double negative (DN) tCD34 (CD34+/CD3−/CD4−/CD8−) stage (Fig. S1 A), the TCRA
lo-cus germline expression and rearrangements start at the early cortical (EC) stage and reach high levels of mature TCRA ex-pression by late cortical (LC) and subsequent single positive (SP) stages (Dik et al., 2005b). It has been previously shown that the
...
1Universit´e de Paris (Descartes), Institut Necker-Enfants Malades, Institut National de la Sant´e et de la Recherche M´edicale U1151, and Laboratory of Onco-Hematology,
Assistance Publique-Hˆopitaux de Paris, Hˆopital Necker Enfants-Malades, Paris, France; 2Aix-Marseille University, Institut National de la Sant´e et de la Recherche M´edicale,
Theories and Approaches of Genomic Complexity, UMR1090, Marseille, France; 3Equipe Labellis´ee Ligue Contre le Cancer, Marseille, France; 4Division of Cancer
Epigenomics, German Cancer Research Center, Heidelberg, Germany; 5Department of Molecular Biology, Faculties of Science and Medicine, Radboud Institute for
Molecular Life Sciences, Radboud University, Nijmegen, Netherlands; 6Centro Nacional de An´alisis Genómico–Centre for Genomic Regulation, Barcelona Institute of Science
and Technology, Barcelona, Spain; 7Universitat Pompeu Fabra, Barcelona, Spain; 8Universit´e Paris Diderot, Institut Universitaire d’H´ematologie, EA-3518, Assistance
Publique-Hˆopitaux de Paris, University Hospital Saint-Louis, Paris, France; 9Department of Pediatric Hematology and Oncology, Assistance Publique-Hˆopitaux de Paris,
Hˆopital Armand Trousseau, Paris, France.
*A. Cieslak and G. Charbonnier contributed equally to this paper; **S. Spicuglia and V. Asnafi contributed equally to this paper; Correspondence to Vahid Asnafi:
vahid.asnafi@aphp.fr; Salvatore Spicuglia:salvatore.spicuglia@inserm.fr.
© 2020 Cieslak et al. This article is distributed under the terms of an Attribution–Noncommercial–Share Alike–No Mirror Sites license for the first six months after the publication date (seehttp://www.rupress.org/terms/). After six months it is available under a Creative Commons License (Attribution–Noncommercial–Share Alike 4.0 International license, as described athttps://creativecommons.org/licenses/by-nc-sa/4.0/).
TCRA gene enhancer (Eα enhancer) is essential for the tight regulation of TCRA rearrangements and expression during αβ T cell differentiation (Bassing et al., 2003;Sleckman et al., 1997). The Eα enhancer is the only known enhancer associated with the TCRA locus and is both necessary and sufficient to provide lin-eage- and stage-specific TCRA rearrangements and expression. The Eα activates transcription originating from the T early α (TEA) promoter, located upstream to the Jα gene segments (100 kb upstream to Eα), thus preparing the 59 Jα chromatin state for the initial recombination events (Abarrategui and Krangel, 2009; Hawwari and Krangel, 2005; Villey et al., 1996). As such, the Eα enhancer represents a paradigm of gene regulation whereby a nucleoprotein complex is assembled during T cell differentiation in order to drive timely and stage-specific re-arrangements of the TCRA locus (Carico and Krangel, 2015;Giese et al., 1992,1995;Hern´andez-Munain et al., 1999;Roberts et al., 1997;Spicuglia et al., 2000). However, the factor, either acti-vators or repressors, governing the stage-specific activation of Eα remains elusive.
To investigate the epigenetic mechanisms guiding the T cell identity, we generated epigenomic and transcriptomic data within the BLUEPRINT Epigenome Project (Stunnenberg and Hirst, 2016), including whole-genome bisulfite sequencing (WGBS) DNA methylation maps, genome-wide maps of six his-tone modifications, and RNA expression of key thymic sub-populations of human T cell precursors. The integration of other epigenomic dataset from BLUEPRINT and Roadmap, covering the development of the major branches of the hematopoietic system, provided a comprehensive view of the epigenomic dy-namics at play at crucial transitions of T cell commitment and development. We observed that most of the distal regulatory elements are constitutively unmethylated throughout T cell differentiation, irrespective of their activation status. This was best exemplified by the Eα enhancer that was found to be in an open and unmethylated chromatin structure well before the activation of the TCRA gene.
Our thorough gene expression analysis revealed that the HOXA5-9 transcription factors are down-regulated concomi-tantly to Eα activation and repress its activity. These findings highlight the key role of HOXA proteins in the epigenetic control of TCRA rearrangements and illustrate a general mechanism of “setting the stage” for orchestrated developmental progression as soon as the inhibition is removed.
Results
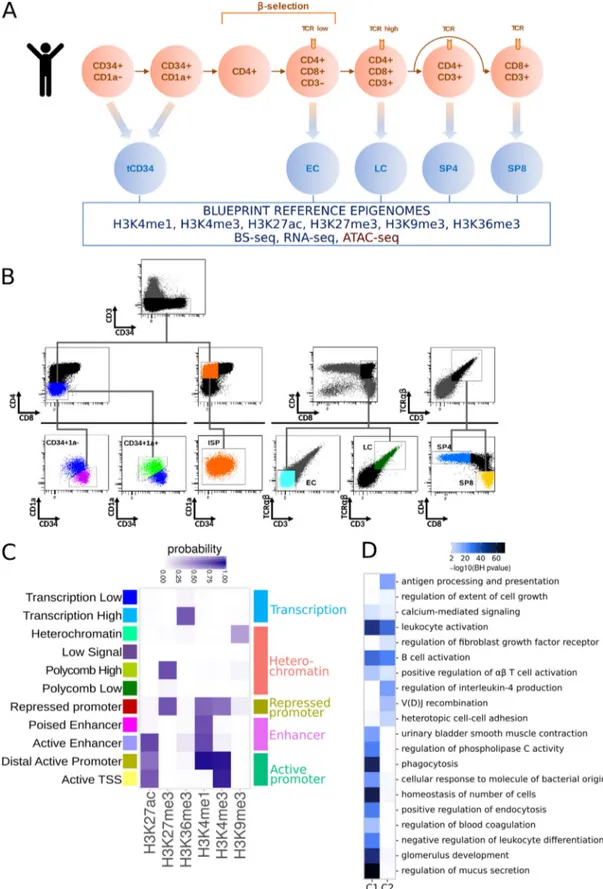
A reference epigenome of human early T cell differentiation As part of the BLUEPRINT project, we generated reference ep-igenomes of sorted human thymocytes encompassing the main differentiation stages (Fig. S1, A and B), including immature DN CD34+ (tCD34: CD34+/CD3−/CD4−/CD8−), EC (TCRαβ−/CD3−/
CD4+/CD8+), LC (TCRαβ+/CD3+low/CD4+/CD8+), SP CD4 (SP4:
TCRαβ+/CD3+/CD4+/CD8−), and SP CD8 (SP8: TCRαβ+/CD3+/
CD4−/CD8+). Reference epigenomes comprise chromatin
im-munoprecipitation sequencing (ChIP-seq) for four histone marks positively associated with gene expression (H3K36me3, H3K4me1, H3K4me3, and H3K27ac) and two with silent
chromatin (H3K27me3 and H3K9me3), WGBS, and RNA se-quencing (RNA-seq; details in Table S2). Replicates from dif-ferent individuals were merged and normalized to provide a consistent set of reference epigenome tracks for each differ-entiation stage.
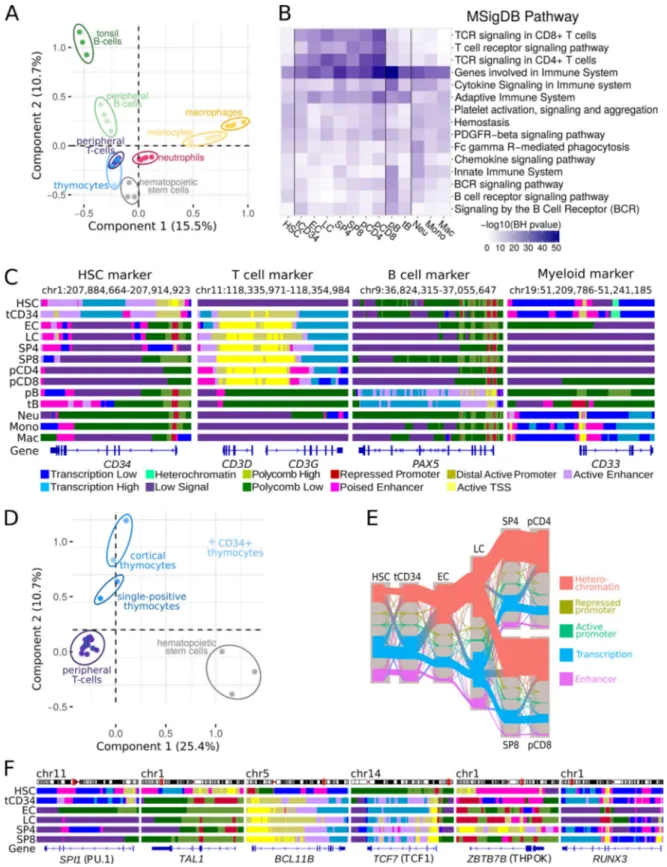
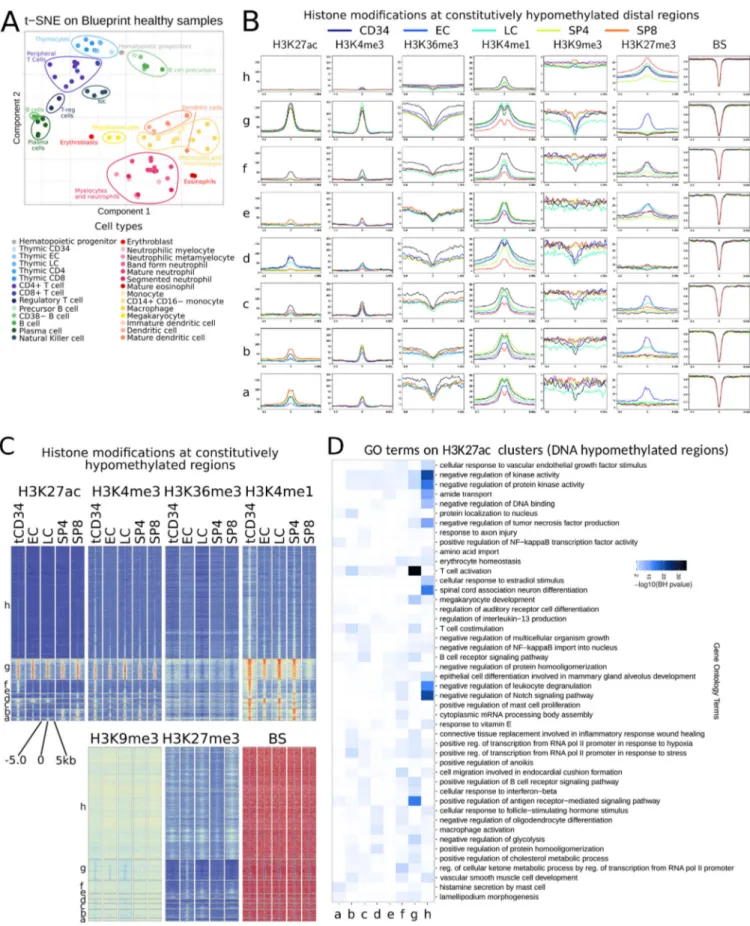
To obtain a global view of the epigenomic landscape of hu-man hematopoiesis, we integrated the ChIP-seq data of each thymic subpopulation into 11 chromatin states derived from the six histone modifications (Fig. S1 C) and compared them with chromatin states for other hematopoietic populations generated by the BLUEPRINT and Roadmap consortia. Multiple corre-spondence analysis (MCA) based on reduced chromatin states (Carrillo-de-Santa-Pau et al., 2017) allowed us to create a mul-tidimensional space, where the different hematopoietic samples were placed depending on their chromatin state vectors across the genome. Clustering based on the first two components grouped samples from the same cell type while the main he-matopoietic populations were clearly separated from each other, in agreement with previous results (Carrillo-de-Santa-Pau et al., 2017;Fig. 1 A). The first component revealed two main differ-entiation branches, representing the myeloid and lymphoid cell lineages, while the hematopoietic stem cells (HSCs) localized in a central position. The second component reflected the differen-tiation stage and the environmental context of each cell type with respect to the HSCs. Interestingly, the thymocyte sub-populations clustered tightly to the peripheral T cells, except for the most immature T cell precursors (tCD34), which clustered close to HSCs and complied with an incomplete commitment to the T cell lineage (Dik et al., 2005b;Fig. 1 A).
To assess whether the epigenomic states were consistent with the known biological functions of each cell type, we ana-lyzed the enrichment in biological processes of genes associated with active enhancer states (Fig. S1 C). The enhancer regions found in each population were significantly enriched in path-ways associated with the corresponding lineage (Fig. 1 B). For instance, thymic and peripheral T cells were associated with TCR signaling, B cells with B cell antigen receptor signaling, and myeloid lineages with phagocytosis and innate immunity.
Lineage-specific genes displayed the expected chromatin dynamics across the hematopoietic populations (Fig. 1 C). The stem cell marker CD34 was associated with open chromatin states in HSC and tCD34 early T cell precursors; the CD3 cluster of T cell receptors was open in T cell samples; the B cell master transcription factor PAX5 was associated with open chromatin in B cells; the myeloid marker CD33 was associated with open chromatin in HSCs, monocytes, and neutrophils but only transcribed in the myeloid lineage. Thus, the epigenomic states, including those from the newly generated thymocyte pop-ulations, were able to capture the main biological differences between cell types and were consistent with their known un-derlying biological processes.
We next investigated more deeply the epigenetic dynamics during human T cell differentiation. Chromatin states clearly separated the main stages of thymic T cell differentiation from HSC and peripheral T cells (Fig. 1 D), suggesting a specific chromatin signature of thymic T cell precursors. While the first dimension (separating T cells from HSC and tCD34 precursors)
Figure 1. Reference epigenomes of human hematopoietic and T cell precursors. (A) MCA of human hematopoietic samples based on chromatin states. Ovals highlight the major subtypes of hematopoietic lineages. (B) Top enriched MSigDB pathways associated with active enhancers found in each hema-topoietic population of A. Vertical lines delineate the main hemahema-topoietic lineages. (C) Chromatin state profiles at representative genes of the different hematopoietic lineages. The color code is indicated at the right of the panel. (D) MCA of HSC and human T cell populations based on chromatin states. (E) Sankey diagram depicting the main epigenomic transitions between the HSC and the human T cell populations. The width of the arrows is proportional to the number of regions associated with the indicated chromatin state. The color code represents the merged chromatin states as indicated at the right of the panel. (F) Chromatin state profiles at representative genes specifically expressed at different stages of T cell differentiation. The color code is as in C. BH, Benjamini–Hochberg. Mac, macrophages; Neu, neutrophils; Mono, monocytes.
was enriched with cell homeostasis and activation functions, the second dimension (separating the thymocyte populations from peripheral T cells and HSC) was specifically enriched with V(D)J recombination (Fig. S1 D). To get a global view of the main epigenetic changes occurring during T cell differentia-tion, we represented the chromatin state transitions among HSCs, thymic subpopulations, and peripheral T cells using a Sankey diagram (Fig. 1 E). We observed a progressive increase of heterochromatin regions along with a decrease of active enhancers and transcribed regions. This suggests a gradual loss of plasticity from HSCs to mature T cells. Finally, master transcription factors that are either repressed (SPI1/PU.1, TAL1) or activated (BCL11B, TCF1/TCF7) during T cell commitment or required for specific CD4+(ZBTB7B/THPOK) or CD8+(RUNX3)
T cell differentiation displayed consistent epigenomic changes (Fig. 1 F).
Overall our analysis of the hematopoietic reference epi-genomes recapitulated the hematopoietic chromatin signatures and accurately captured the main biological identities of thymic T cell precursors. It demonstrates that our epigenomic data provide an excellent resource to study the regulatory networks underlying early T cell differentiation in humans.
DNA demethylation is a hallmark of distal regulatory elements irrespective of their activation status in T cells
We next analyzed the DNA methylation status of the five thymic subpopulations and the different hematopoietic populations using WGBS data generated by both the BLUEPRINT and Road-map consortia. Similar to the chromatin state classification, a dimensional reduction based on DNA methylation grouped the different hematopoietic samples according to their cell lineage, while the thymocyte populations were separated from periphe-ral T cells (Fig. S2 A).
Gene distal DNA hypomethylation has been shown to be a hallmark of enhancer regions, allowing an accurate identifica-tion of recognized cis-regulatory sequences (Stadler et al., 2011). To assess the dynamics of enhancer activities during early T cell differentiation, we retrieved all distal hypomethylated regions found in at least one thymic subpopulation and clustered these regions based on the changes of DNA methylation across the thymic subpopulations (Fig. 2 A and Fig. S2 B). Clusters 1–4 corresponded to constitutively hypomethylated regions and represented the majority of distal hypomethylated regions. Cluster 5 corresponded to regions preferentially hypomethy-lated in tCD34 precursors. Regions of clusters 1–5 were poorly enriched in H3K27ac (Fig. 2 B), and the associated genes were expressed at low levels in thymocytes (Fig. 2 C), displayed low thymus specificity (Fig. 2 D), and were either related to he-matopoietic lineages other than T cells or not specifically en-riched in relevant biological processes (Fig. 2 E). In contrast to clusters 1–5, clusters 6–8 corresponded to regions that were hypermethylated in tCD34 thymocytes and underwent pro-gressive demethylation through different T cell differentiation stages. Consistent with this, clusters 6–8 were highly enriched with H3K27ac mark (Fig. 2 B), and the associated genes were expressed at a high level in thymocytes (Fig. 2 C), displayed higher thymus specificity (Fig. 2 D), and were related to
T cell–specific functions (Fig. 2 E). The results suggest that clusters 6–8 are likely enriched in T cell–related genes that are expressed at all stages, but for which the relative expression level is fine-tuned during differentiation.
As we were surprised by the elevated proportion of consti-tutively hypomethylated regions (77% of total distal hypomethy-lated regions), we decided to further explore the epigenomic dynamics of these potential regulatory regions. Clustering of the constitutively hypomethylated distal DNA regions (corre-sponding to clusters 1–4 from Fig. 2 A), based on H3K27ac levels (Fig. S2, C and D), revealed five clusters with dynamic H3K27 acetylation (Fig. 2, F and G), representing 17% of the total set of distal hypomethylated regions. Changes in H3K27ac levels roughly followed the expression dynamics of neighbor-ing genes (Fig. 2 H). Consistent H3K27ac signatures at the promoter and constitutively hypomethylated distal regions were observed for early (RAG1-RAG2) and late (CD44) expressed loci. The Il7R locus was associated with distal enhancers acti-vated either at the early (downstream) or the late (upstream) stages; in both cases, the regulated enhancers were constitu-tively demethylated (Fig. 2 I).
These observations strongly indicate that DNA hypomethylation marks distal regulatory elements independently of their ac-tivation status, both preceding to and persisting after enhancer activation.
Chromatin opening precedes enhancer activation
The above analyses suggested that the activation onset of distal regulatory elements might be preceded by DNA demethylation. This raised the question of whether premarked enhancers (DNA hypomethylated) are already in an open chromatin configura-tion (nucleosome free). To address this issue, we performed assay for transposase-accessible chromatin (ATAC) experiments in tCD34 and EC stages, as these stages reflected the major epi-genetic transitions (Fig. 1 and Fig. 2). We identified 2,084 and 2,905 distal ATAC peaks in tCD34 and EC, respectively (Fig. 3, A and B). About one-third of the distal ATAC peaks (1,108) were shared between the two thymic populations. Distal ATAC peaks present in both tCD34 and EC stages and specific to EC were in proximity to genes associated with T cell differentiation and function, while tCD34-specific peaks were associated with more general functions (Fig. 3 C). Consistent with this, analysis of conserved transcription factor binding sites in tCD34-associated peaks showed a preferential association of hematopoietic factors such as TAL1 and AML1 (RUNX1), while transcription factors involved in T cell differentiation and activation such as E47 (TCF3), STAT, and ETS were preferentially found in EC-associated peaks (Fig. 3 D). As predicted, ATAC peak regions were consti-tutively demethylated in tCD34 and EC stages, independently of whether the regions were specifically open in tCD34 or EC thy-mocytes (Fig. 3 E). This suggests that DNA demethylation may both precede enhancer opening and hold after enhancer closing. Thus, DNA demethylation seems to represent a primary marking of distal regulatory regions, independently of the actual enhancer activity or chromatin accessibility.
Next, we asked whether constitutively open and demethy-lated regions could be associated with changes in enhancer
Figure 2. DNA demethylation is a hallmark of distal regulatory elements irrespective of their activation status in T cells. (A) Heatmap displaying DNA methylation scores of distal hypomethylated regions in the indicated thymocyte populations, based on WGBS. Regions are clustered into eight groups using k-means. The scale of DNA methylation is indicated at the bottom of the panel. (B) H3K27ac profiles in the indicated thymocyte populations, centered on the hypomethylated clusters defined in A. (C) Median of the RNA-seq signal of genes associated with the hypomethylated clusters defined in A, in the indicated thymocyte populations. (D) Fraction of thymus-specific genes associated with each hypomethylated cluster defined in A and in all genes (AG). The Human Protein Atlas version 19.2 (Uhl´en et al., 2015) was used to assess tissue specificity. Inset shows the percentage of thymus-specific genes that is associated with a distal hypomethylated region. (E) Top GO biological processes enriched at genes associated with the hypomethylated clusters defined in A. Relevant he-matopoietic and T cell related terms are highlighted. Labels are abbreviated as follows: neg, negative; pos, positive; reg, regulation; pol, polymerase.
activity. For this purpose, shared ATAC peaks were ordered relative to the H3K27ac ratio between tCD34 and EC thymocytes (Fig. 3 F). Interestingly, ATAC regions that are most highly H3K27ac marked in tCD34 (tCD34 high) or EC (EC high) cells (Fig. 3 G) were linked with genes that significantly decrease or increase expression, respectively (Fig. 3 H; paired Wilcoxon test). Concordant proportions of differentially regulated genes were also observed (Fig. 3 I). This suggests that constitutively open and demethylated distal regions can be associated with locus activation or repression.
To identify potentially interesting loci, we searched for genes showing strong differential expression between tCD34 and EC/ LC thymocytes that were also associated with distal open regions displaying a gain of H3K27ac (Fig. 3 J and Fig. S3). Strikingly, the TRAC transcript, associated to the TCRA locus, was the most induced gene having an H3K27ac enhancer gain in a region corresponding to the known Eα enhancer (Hawwari and Krangel, 2005;Ho et al., 1989;Winoto and Baltimore, 1989; Fig. 4 A).
The Eα enhancer is in an open but epigenetically silent configuration in immature thymocytes
To better understand the tight regulation of the Eα enhancer, we depicted the epigenetic dynamic at the TCRA locus during the human thymopoiesis (Fig. 4 A). In tCD34 thymocytes, the TCRA locus was in a relatively closed configuration, with low levels of H3K4me1, H3K4me3, and H3K27ac and relatively high levels of H3K27me3. In contrast, EC and LC cortical thymocytes displayed overall high levels of H3K4me1, H3K4me3, H3K27ac, and H3K36me3, whereas H3K27me3 was strongly reduced. Of note, active histone marks were shifted from the 59 to the 39 side of the Jα-Cα locus between the EC and LC stages, in agreement with progressive Vα-to-Jα rearrangements (Hawwari and Krangel, 2005;Huang et al., 2002;Krangel et al., 2004). The adjacent TCRD locus displayed a general loss of active marks during T cell differentiation, as expected (Fig. 4 A). In contrast to the TCRA locus, the Eα enhancer was found to be in an open chromatin configuration since the very immature stages of thymic matu-ration (ATAC), when it was fully demethylated (WGBS) and enriched in H3K4me1 (a mark of poised enhancers;Fig. 4, A and B). By the EC and LC stages on, the Eα region had gained sub-stantial levels of H3K27ac and, in particular, H3K4me3, previ-ously shown to be associated with highly active enhancers (Pekowska et al., 2011).
Our findings are consistent with murine data showing that Eα is occupied by transcription factors from the early CD4−/
CD8−DN stage of thymocyte development, thus preceding the transcriptional activation of TCRA locus, which takes place after
theβ-selection (Hern´andez-Munain et al., 1999;Spicuglia et al., 2000). We have previously suggested that the Eα enhancer ac-tivation occurs via a conformational change of a preassembled nucleo-protein complex (Cauchy et al., 2016;Spicuglia et al., 2000). Analysis of published ChIP-seq experiments for ETS1, RUNX1, E47/TCF3, GATA3, and Ikaros lymphoid transcription factors (Zacar´ıas-Cabeza et al., 2015;Koch et al., 2011;Lepoivre et al., 2013;Wei et al., 2011;Vanhille et al., 2015;Oravecz et al., 2015) confirmed that Eα is already occupied by these activating transcription factors in murine DN thymocytes (Fig. S4 A). Im-portantly, transcription of short noncoding enhancer RNAs, a hallmark of active enhancers, was only observed in murine late CD4+/CD8+ double positive (DP) thymocytes (Fig. S4 B).
Fur-thermore, as shown by ChIP–quantitative PCR (ChIP-qPCR) as-says (Fig. 4, C and D), Eα is already bound by its activating ETS1 and RUNX1 transcription factors in human immature tCD34 thymocytes. This was also confirmed for RUNX1 by ChIP-seq experiment (Fig. 4 E).
Overall, these data suggest that Eα is in an open chromatin state and is already bound by its activating transcription factors from the very immature stages of human and murine thymic maturation. As Eα remains inactive until the cortical stages, this suggests that a repressive mechanism prevents its activity during the early stages of thymic maturation in mice and hu-mans. While the functions of Eα have been intensively studied (Carey, 1998;Hawwari and Krangel, 2005;Ho et al., 1989,1990; McMurry and Krangel, 2000), the molecular mechanisms mediating the stage-specific activation of Eα have remained elusive. As such, Eα control of the TCRA locus represents an unsolved paradigm of tissue-specific gene regulation by distal regulatory elements.
TheHOXA locus is progressively repressed during early T cell differentiation
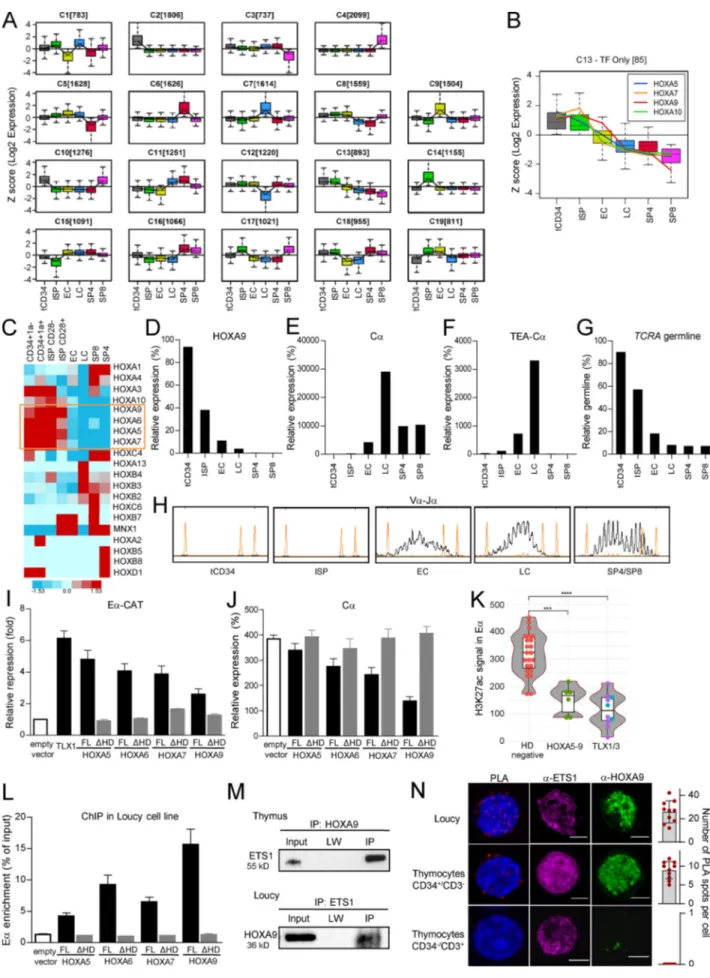
Given that Eα is already bound by key transcription factors re-quired for its activation, we hypothesized that the loss of a transcriptional repressor might explain the stage-specific acti-vation of Eα. To explore this possibility, we analyzed RNA-seq of the main human thymic subpopulations to identify transcripts that were down-regulated at the TCR β-selection. Unsuper-vised gene expression analysis identified 19 clusters, each corre-sponding to transcripts with different gene expression kinetics during thymic maturation (Fig. 5 A). Cluster C13, containing 893 different transcripts, presented the expected profile of gene expression modulation, with high expression at the early stages and gradual reduction during maturation up to the extinction of expression after theβ-selection stage (immature single positive [ISP] > EC > LC;Fig. 5 A). Interestingly, this cluster
(F) K-means clustering of DNA hypomethylated regions with dynamics H3K27ac levels among thymocytes subpopulation. The heatmap of H3K27ac levels in the indicated thymocytes subpopulation is shown. (G) H3K27ac, H3K4me1, and WGBS profiles in the indicated thymocyte populations centered on the clusters defined in E. Same color code as in B. (H) Z-scores of the median H3K27ac signal of the regions defined in E and RNA-seq signal of associated genes in the indicated thymocyte populations of genes associated with clusters defined in E. (I) Chromatin states, H3K27ac, and WGBS profiles of representative loci displaying constant hypomethylation, but dynamic H3K27ac enrichments in the indicated thymocyte populations (red rectangles). The regulation of the as-sociated gene, specifically expressed at different stages of T cell differentiation, is indicated at the top of each panel. The normalized signal range is indicated by brackets. For WGBS track, red and blue colors indicate methylated and unmethylated CpGs, respectively. The color code for the ChromHMM track is as in
Fig. 1 C.
Figure 3. Chromatin opening precedes enhancer activation. (A) Overlap between ATAC peaks identified in tCD34 and EC thymocytes. (B) Clustered heatmap of ATAC signal in tCD34 and EC thymocytes (left panels). Scores associated with the color code is on the right. (C) Top GO biological processes enriched in genes associated with distal ATAC peaks specific to either tCD34 or EC thymocytes, or common to both. (D) Conserved TFBS enriched at distal ATAC peaks specific to either tCD34 or EC thymocytes, or common to both. (E) Average profiles of WGBS signals corresponding to the ATAC peaks defined in A. (F) Heatmap of H3K27ac signals based on common ATAC peaks ordered by the H3K27ac ratio between tCD34 and EC. (G) Average H3K27ac profiles centered on ATAC peaks with relative high H3K27ac signal in either tCD34 or EC thymocytes or remained unchanged, as defined in E. (H) Violin plots of the RNA-seq signal of genes associated with distal ATAC peaks (as defined in E) in the indicated thymocyte populations. Right panels represent RNA-seq data fromCasero et al. (2015). Statistical significance was assessed by a Wilcoxon rank-sum test. **, P≤ 0.01; ***, P ≤ 0.001; ****, P ≤ 1e-04. (I) Percentage of significantly regulated genes associated with distal ATAC peaks defined in E. (J) Top significantly induced genes associated with ATAC peaks and H3K27ac gain. The expression fold change between Thy3 (tCD34) and Thy4 (EC/LC) thymocytes is indicated.
contained several members of the HOX-like (HOXL) subclass of homeodomain (Hox) transcription factors (Fig. 5 B and Fig. S5, A and B). Of note, ectopic expression (i.e., oncogenic deregu-lation by chromosomal translocations) of the HOX family of
transcription factors (i.e., TLX1 and TLX3 from the NKL sub-class) was reported to exert repressive activity on Eα in T cell acute lymphoblastic leukemia (T-ALL), an aggressive cancer developed from thymic precursors (Dadi et al., 2012). We then
Figure 4. Epigenetic and transcription factor analysis of theTCRA locus in the human thymic subpopulations. (A) ChromHMM, ATAC-seq, and ChIP-seq profiles for histone modifications (H3K27ac, H3K4me1, H3K4me3, H3K36me3, and H3K27me3) and BS-seq at theTCRA/D locus in the human thymic sub-populations tCD34, EC, and LC. A zoom on Eα is presented on the right. The legend is as inFig. 2 H. (B) ATAC profiles of theTCRA locus (TRAJ gene segments and TCRA enhancer) in human thymic subpopulations CD34+1a−, CD34+1a+, EC, and LC. Representative of two independent experiments. (C) ChIP-qPCR analysis of
ETS1 binding to Eα in human thymic subpopulations tCD34, EC, and LC. ChIP enrichment level is presented as percent of input and corresponds to the ratios between the Eα and IgG signal. Data are presented as duplicates of experiments with error bars to represent SEM. (D) ChIP-qPCR analysis of RUNX1 binding to Eα in human thymic subpopulations tCD34, EC, and LC. ChIP enrichment level is presented as percent of input and corresponds to the ratios between the Eα and actin signal. IgG isotype control was performed to assess absence of nonspecific Eα ChIP enrichment. Data are presented as duplicates of experiments with error bars to represent SEM. (E) RUNX1 ChIP-seq profile in thymic CD34+population (tCD34).
Figure 5. HOXA5-9 proteins are progressively repressed during human thymopoiesis, bind to Eα, and repress its activity. (A) An unsupervised RNA-seq gene expression classification identified 19 clusters with different profiles of gene expression modulations. (B) Cluster 13 identifies 85 transcription factors in
focused on HOXL genes pattern expression during human thymopoiesis. A TaqMan Low-Density Array (TLDA) was de-signed to evaluate the expression of all HOXL members in an independent set of human thymic subpopulations (Table S1). Unsupervised TLDA clustering showed that HOXA5, HOXA6, HOXA7, and HOXA9 genes best fitted the relevant expression profiles (Fig. 5 C and Fig. S5, C–E). In particular, HOXA9 ap-peared to be a good candidate, as its down-regulation perfectly coincides with the Cα up-regulation, the presence of TEA-Cα germline transcripts, and the beginning of TCRA rearrange-ments (Fig. 5, D–H).
HOXA5-9 proteins repress Eα activity via their homeodomain To test the possibility that HOXA5-9 proteins interfere with Eα transcriptional activity, we used a gene reporter assay in which the expression of chloramphenicol acetyltransferase (CAT) is under the control of Eα (Eα-CAT) (Giese et al., 1995). The ectopic expression of HOXA-5, -6, -7, and -9 repressed Eα-regulated CAT expression by three- to fivefold (Fig. 5 I). Next, we evaluated the level of Eα-CAT repression of the truncated forms of HOXA proteins, lacking their homeodomains (ΔHD). As shown inFig. 5 I, all truncated HOXA forms (ΔHD) exerted significantly reduced repressive activity compared with their respective full-length (FL) proteins. The reduced activity of HOXA5-9ΔHD proteins was not due to their lack of nuclear localization because they were mainly localized in the nucleus as their FL counterpart (Fig. S5 F). Using the same expression vectors, we tested whether HOXA5-9 proteins can repress TCRA activity in the HOXA-negative and TCRαβ-positive T-ALL cell line Jurkat. As shown in Fig. 5 J, HOXA9 overexpression resulted in the strongest repression of the TCRA gene expression. Additionally, we found that H3K27ac signal, a hallmark of active enhancers, is significantly lower in Eα in HOX-overexpressing T-ALLs, com-pared with T-ALLs without deregulation of homeodomain genes
(Fig. 5 K). We concluded that HOXA5-9 proteins repress Eα transcriptional activity in a homeodomain-dependent manner.
ChIP assays using Loucy (HOXA overexpressing) or HeLa (HOXA-negative) cell lines nucleotransfected with Flag-tagged expressing vectors for FL HOXA5, -6, -7, or -9, showed signifi-cantly enriched Eα DNA (Fig. 5 L and Fig. S5 G). Importantly, HOXA proteins without their homeodomain (ΔHD) displayed reduced binding to Eα. As Eα lacks the AT-rich DNA motif TAATNA characteristic of the HOX homeodomain binding, we hypothesized that HOXA proteins exert their Eα repressive ac-tivity by interacting with ETS1, as we showed for TLX proteins, members of the NKL subclass of homeodomain proteins (Dadi et al., 2012). Co-immunoprecipitation (IP) assays with anti-HOXA9 antibody in human thymocytes recovered both ETS1 and HOXA9 in the precipitated material (Fig. 5 M, upper panel). CoIP assays in the Loucy cell line, which coexpresses HOXA9 and ETS1, also showed that an anti-ETS1 antibody coimmuno-precipitated HOXA9 (Fig. 5 M, lower panel). Furthermore, proximity ligation assay (PLA) confirmed the HOXA9-ETS1 interaction in Loucy and in immature CD34+/CD3−thymocytes
(Fig. 5 N). However, more mature CD34−/CD3+thymocytes, as
expected, showed no HOXA9-ETS1 interaction (Fig. 5 N). Taken together, these data suggest that the HOXA9 tran-scription factor could be recruited to Eα and repress the Eα ac-tivity in a homeodomain-dependent manner.
HOXA9 overexpression affects T cell development in humans and mice
To functionally evaluate the role of HOXA homeoproteins in TCRA rearrangement and T cell development, we transduced human CD34+umbilical cord blood cells (UCB CD34+) with either
a HOXA9 overexpressing (HOXA9-GFP) or a control (GFP) vec-tor and co-cultured them in vitro on OP9-DL1 stroma under conditions for T cell differentiation. After 7 wk of co-culture, we
which expression progressively decreases afterβ-selection (ISP). The expression of the HOXA5, HOXA7, HOXA9, and HOXA10 genes is highlighted. (C) TLDA analysis of HOXL expression profiles in thymic subpopulations. The expression level is classified from blue to red. Only genes that show expression at any of the thymic subpopulation are presented. Results represent means duplicate reactions. (D) RQ-PCR analysis ofHOXA9 gene expression in human thymic sub-populations. Results are relative to theABL1 housekeeping gene. Representative of two independent experiments. (E) RQ-PCR analysis of Cα gene expression in human thymic subpopulations. Results are relative to theABL1 housekeeping gene expression. Representative of two independent experiments. (F) RQ-PCR analysis ofTEA-Cα gene expression in human thymic subpopulations. Results are relative to the ABL1 housekeeping gene. Representative of two independent experiments. (G) RQ-PCR analysis of TCRA germline from normal human thymocyte subpopulations. Normalization was performed with the albumin housekeeping gene. Representative of two independent experiments. (H) Fluorescent PCR Genescan analysis of Vα-Jα rearrangements detected in sorted thymic populations. Representative of two independent experiments. (I) Eα-CAT fold repression in HeLa cells following transfection with encoding vectors for ETS1, RUNX1, LEF1, and individual HOXA5-9 (FL and HD-deleted forms). TLX1 is used as a positive control of repression. Eα-CAT signals were normalized to those of control cells transfected with an empty GFP vector. Data are presented as means of at least triplicate measurements with error bars to represent SEM. (J) RQ-PCR analysis ofCα gene expression in T-ALL cell line transfected with HOXA5-9 (FL or ΔHD forms)–expressing vectors. Results are relative to the ABL1 housekeeping gene expression. Representative of two independent experiments. (K) Violin plots of quantile-normalized H3K27ac signal in Eα in T-ALL patients. Immature T-ALLs (IM0, IMD, and IMB) were excluded. Red dots: T-ALLs with no deregulation of homeodomain genes (n = 23); green dots: T-ALLs over-expressingHOXA-5, -6, -7, and -9 genes (n = 6); blue dots: TLX1 positive T-ALLs (n = 3); violet dots: TLX3 positive T-ALLs (n = 7). Statistical significance was assessed by a Wilcoxon rank-sum test. ***, P≤ 0.001; ****, P ≤ 1e-04. (L) Anti-Flag ChIP-qPCR analysis of HOXA5-9 binding to Eα in the Loucy cell line expressing Flagged HOXA5-9 (FL orΔHD forms). ChIP enrichment level is presented as a percentage of input and corresponds to the ratios between the Eα and actin signals. ChIP with an empty NTAP vector was performed as a control. Results represent means and SEM of triplicate reactions. (M) Upper panel: CoIP using HOXA9 antibody followed by an immunoblotting with anti-ETS1 antibody in human thymocytes. The input corresponds to the 1% of cell extract used in the CoIP experiment. LW, last wash. A representative result of two independent experiments is shown. Lower panel: IP using anti-ETS1 antibody followed by an immunoblotting with anti-HOXA9 antibody in Loucy cell line. A representative result of two independent experiments is shown. The input corresponds to the 1% of cell extract used in the CoIP. (N) Duolink PLA and confocal microscopy analysis of cells labeled with anti-ETS1 (Alexa 488, purple) and anti-HOXA9 (Alexa 555, green) antibodies in Loucy cell line and tCD34+/CD3−and tCD34−/CD3+thymocytes. Scale bars, 10 µm. On the right, the quantification of the number of
PLA dots per cell is presented with the mean values and SD.
found more TCRγδ-expressing cells when HOXA9 was overex-pressed (22.0 ± 11.6%) compared with control cells (10.8 ± 4.6%; Fig. 6, A–C). The difference was significantly pronounced after 8 wk of co-culture (HOXA9-GFP 26.8 ± 15.3% vs. control GFP 6.8 ± 3.1%;Fig. 6, A–C). TCRγδ cells in HOXA9-overexpressing con-ditions were mostly CD4+/CD8+ DP compared with the TCRγδ
cells in controls (Fig. 6 D). We then analyzed the TCRA re-arrangements and observed fewer TCRA rere-arrangements under HOXA9-overexpressing conditions, with a clear difference by the fifth week of culture (Fig. 6 E). Additionally, using the CRISPR-Cas9 system, we performed knock-out of HOXA9 and deletion of HOXA5-9 genes in CD34+ UCB cells, which were
differentiated on OP9-DL1 stroma cells. TCRA gene rearrange-ments were analyzed at day 28 of co-culture, demonstrating a substantial increase in HOXA9 knock-out and HOXA5-9 deletion conditions as compared with controls (Fig. 6 F).
To confirm the role of the HOXA9 protein in TCRA re-arrangements and T cell development, we performed in vitro and in vivo experiments in mice. Murine DN thymocytes were transduced with either a control vector (GFP) or a HOXA9 overexpressing vector (HOXA9-GFP) and differentiated in vitro on OP9-DL1 stromal cells (Fig. 7 A). In control conditions and following 9 d of co-cultures, 44.4 ± 6.8% of the immature thy-mocytes developed into TCRαβ-expressing cells. When HOXA9 was overexpressed, however, few thymocytes (14 ± 7%) differ-entiated into TCRαβ cells, developing instead into CD4+/CD8+DP
TCRγδ cells (Fig. 7, B–E). To confirm these in vivo data, we transplanted HOXA9-overexpressing DN thymocytes and their control counterparts into sub-lethally irradiated Rag2−/−γc−/−mice (Fig. 7 F). At 3 wk after transplant, control cells became virtually exclusively TCRαβ-positive, whereas HOXA9-overexpressing thy-mocytes repressed TCRαβ expression and expressed TCRγδ in a significant proportion of T cells (Fig. 7, G–I).
Taken together, these results indicated that the enforced expression of HOXA9 blocks TCRA rearrangements, thus af-fectingαβ T cell development.
Homeodomain protein deregulation leads to a TCRγδ bias in human T-ALL
In an effort to evaluate the implication of the homeoprotein-mediated inhibition of Eα activity, we took advantage of the T-ALL model. T-ALL is a rare disease resulting from the leuke-mic transformation of thyleuke-mic precursors arrested at specific stages of differentiation (Asnafi et al., 2003;Ferrando et al., 2002). Approximately 30% of T-ALLs have a“mature” pheno-type as they express the sCD3/TCR. Intriguingly, among these sTCR+T-ALLs, an unexpectedly high fraction of cases (@50%)
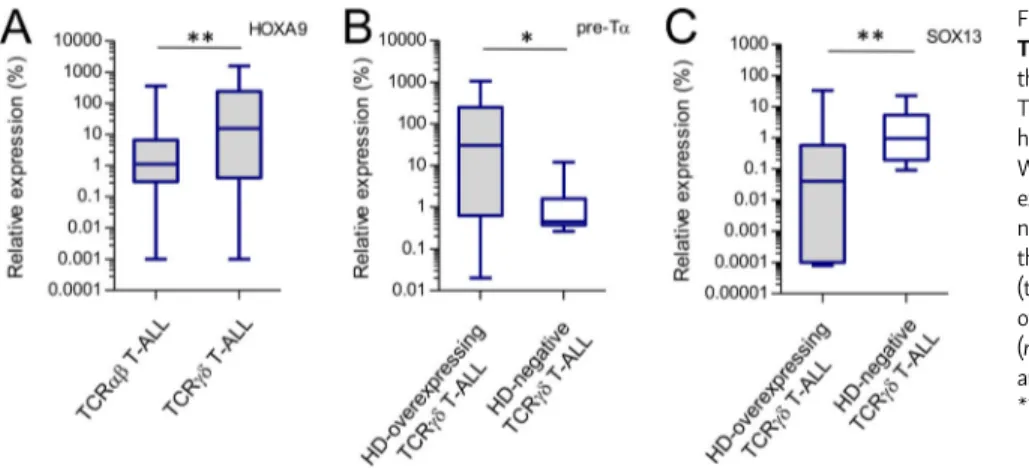
express a TCRγδ. The molecular mechanism of this bias was unidentified (Asnafi et al., 2004;Trinquand et al., 2016). We analyzed a series of 150 TCR-expressing T-ALLs (45 TCRαβ T-ALLs vs. 95 TCRγδ T-ALLs) and evaluated HOXA9 expression. The TCRγδ T-ALLs showed higher (39/95; 41%) HOXA9 over-expression compared with TCRαβ T-ALLs (Fig. 8 A). A further 32/95 (34%) TCRγδ T-ALLs overexpress homeodomain genes from the NKL subclass (i.e., TLX1 or TLX3). In total, 71/95 (75%) TCRγδ T-ALLs demonstrated overexpression of homeodomain genes (HD-overexpressing), compared with 5/45 TCRαβ T-ALLs
(P < 0.0001). We hypothesized that HD overexpression could impose TCRγδ expression in αβ-lineage oriented precursors by preventing TCRαβ expression. In support of this, the expression of the pre-T cell receptorα (pTα) was significantly higher in HD-overexpressing TCRγδ T-ALLs, compared with TCRγδ T-ALLs without HD deregulation (P = 0.04;Fig. 8 B). The opposite was observed for SOX13, a transcription factor involved in normal γδ T cell differentiation (Melichar et al., 2007), which is expressed at lower levels in the HD-overexpressing TCRγδ T-ALLs (P = 0.003;Fig. 8 C). Next, we analyzed the TCRB rearrangements in TCRγδ-expressing T-ALLs and demonstrated a high incidence of complete VDJ TCRB rearrangement in the HD-overexpressing group (45/71 vs. 3/24; P < 0.0001;Table 1). These data suggest that the molecular basis for the skewed TCRγδ expression in T-ALL could be related to homeodomain proteins (HOXA, TLX1/3) deregulation, preventing Eα activation and TCRA rearrangements, with the compensatory expression of a surface TCRγδ.
Discussion
We took advantage of our comprehensive epigenomic resource encompassing the main thymic populations of human T cell precursors to shed light on the epigenomic dynamics of a well-defined developmental program. First, we found that the epi-genetic landscape positions thymocyte populations between HSC and mature T cells within the lymphoid lineage. T cell differentiation was accompanied by major remodeling of histone modifications involving a progressive closing of the chromatin landscape, clearly reflecting the Waddington model of cellular differentiation (Waddington, 1957). Second, our analysis re-vealed an unexpected persistence of DNA demethylation at distal regulatory regions. Interestingly, distal hypomethylated regions were associated with ∼64% of tissue-specific genes (Fig. 2 D, inset). A high proportion of distal regulatory regions were found to be constitutively hypomethylated irrespectively of their activation status throughout T lymphoid development, thus suggesting that DNA hypomethylation might work as a major epigenetic hallmark of enhancer preassembly and memory. Finally, we disentangled the regulatory mechanisms leading to stage-specific activation of the Eα TCRA enhancer, a paradigm of enhancer organization and function (Carey, 1998). Eα is found in a hypomethylated and open chromatin config-uration at the very early stages of T cell differentiation, well before the activation of the TCRA locus, where the HOXA pro-teins function as developmentally regulated repressors of Eα.
During T cell thymopoiesis, Eα regulates the chromatin structure of TCRA gene segments by its ability to recruit a unique combination of transcription factors and induce modi-fication of histone marks (McMurry and Krangel, 2000). We here demonstrated that Eα is already bound by its activating transcription factors, but stays nonfunctional at the earliest stages of the thymic maturation. Indeed, at these stages, Eα is found in an open chromatin state, fully demethylated and as-sociated with histone marks characteristics of poised enhancer defined by enrichment of H3K4me1 and reduced levels of H3K27ac. Additionally, Eα is surrounded by the presence of H3K27me3, indicating a repressive mechanism acting on its
Figure 6. HOXA9 overexpression biases T cell development in humans. (A) Representative FACS plots representing TCRγδ expressing cells during T cell differentiation of human CD34+UCB cells transduced with a HOXA9-GFP expressing vector or a control GFP vector. Presented cells are gated on the
CD45+CD7+CD1a+population. (B) Quantification of TCRγδ positive cells (as in A). Data are presented as means of three independent experiments with error
bars as SEM. (C) Cell number of TCRγδ-positive cells (as in A and B). Data are presented as means of three independent experiments with error bars as SEM. (D) CD4 and CD8 expression of TCRγδ-positive cells at day 56 of human CD34+UCB differentiation. Data are presented as means of two experiments with
error bars as SEM. (E) Fluorescent PCR Genescan analysis ofTCRA rearrangements detected in differentiated CD34+UCB cells in HOXA9-overexpressing
experiments. Representative of two different experiments. (F) Fluorescent PCR Genescan analysis ofTCRA rearrangements detected in differentiated CD34+
UCB cells in CRISPR-Cas9 mediated HOXA9 knock-out and HOXA5-9 deletion experiments. Representative of two different experiments. P values were calculated by Student’s test. *, P < 0.05. SSC-A, side scatter area. ko, knockout; ctr, control.
activity, as suggested for developmentally regulated enhancers (Cruz-Molina et al., 2017; Rada-Iglesias et al., 2011; Zentner et al., 2011). Our results are also reminiscent of previous find-ings showing that cell type–restricted enhancers are premarked by DNA hypomethylation and binding of embryonic stem cell transcription factors, although they do not exhibit traditional enhancer epigenetic marks in embryonic stem cells (Kim et al., 2018;Xu et al., 2007).
HOXA proteins belong to a family of genes that shares a characteristic homeodomain protein fold, consisting of a 60– amino acid helix-turn-helix structure responsible for DNA binding and interactions with other proteins. HOXA functions
are well established in the antero-posterior axis definition of body segment identity specification during embryogen-esis (Carroll, 1995;Goodman, 2002;Lewis, 1978). Importantly, they also play a key role in controlling cell identity and differ-entiation of HSCs and progenitors (Lawrence et al., 1996;Magli et al., 1997). HOX genes are highly expressed in HSCs and pro-genitors, and their expression is silenced as cells become fully mature. Progressive down-modulation of HOXA transcripts was also reported during thymic cell maturation (Taghon et al., 2003). We now report that HOXA proteins repress the Eα ac-tivity in a homeodomain-dependent manner. All HOX homeo-domains bind highly similar AT-rich DNA motifs (Berger et al.,
Figure 7. HOXA9 overexpression biases T cell development in mice. (A) Schematic representation of the in vitro experimental design in mice. (B) Representative FACS plots and quantification of TCRαβ- and TCRγδ-expressing cells in DN thymocytes transduced with a HOXA9-GFP overexpressing vector or a GFP control construct cultivated in vitro for 9 d on OP9-DL1 stromal cells. (C) Quantification of TCRαβ- and TCRγδ-expressing cells in mice in vitro assay (as in B). Quantification represents data of three independent experiments. (D) Cell number in TCRαβ- and TCRγδ-expressing cells in mice in an in vitro assay (A). Quantification represents data of three independent experiments with SEM. (E) Representative FACS plots of CD4 and CD8 expression in TCRαβ-and TCRγδ-expressing cells in an in vitro mice experiment (A). (F) Schematic representation of the in vivo experimental design in mice. (G) Representative FACS plots of TCRαβ- and TCRγδ-expressing cells in donor-derived thymocytes isolated from Rag2−/−γc−/−mice at 3 wk after transplantation. (H)
Quanti-fication of TCRαβ- and TCRγδ-expressing cells in donor-derived thymocytes (as in G). QuantiQuanti-fication represents data of three independent experiments with error bars as SEM. (I) Cell number of TCRαβ- and TCRγδ-expressing cells in an in vivo mice experiment (E). Quantification represents data of three independent experiments with SEM. P values were calculated by Student’s test. *, P < 0.05.
2008; Mann et al., 2009; Noyes et al., 2008). The TAATNA recognition sequence seems to be critically important for DNA binding, as >98% of genome-wide HOXA9 binding sites in transformed myeloblasts contain a HOX motif (Huang et al., 2012). Additional specificity of HOXA proteins is achieved through a combination of motif affinity, interaction with co-factors, and context-specific chromatin accessibility (Choo et al., 2011; Slattery et al., 2011). The TAATNA HOX recognition se-quence is, however, absent in the core Eα, suggesting that HOXA recruitment to Eα is mediated by interactions with components of the Eα enhanceosome. The suppressive function of HOXA proteins on Eα activity could be mediated by ETS1, as has been previously shown for TLX1/TLX3 homeoproteins (Dadi et al., 2012), although we do not exclude alternative protein–protein interactions and mediation of a suppressive effect by other transcription factors, such as RUNX1 (Hollenhorst et al., 2009).
Among HOX genes, HOXA9 is the most preferentially ex-pressed in CD34+HSCs and early hematopoietic progenitors and
is subsequently down-regulated during differentiation (Taghon et al., 2003). Moreover, HoxA9 is known to impact mouse thy-mocyte differentiation, and its knock-down induces the most dramatic hematopoietic phenotype of all HOX genes (Izon et al., 1998;Lawrence et al., 1997). Hoxa9−/−mice show an increase in the percentage of DP TCRαβhi cells and the total number of
TCRαβ positive cells and accelerated progression of DP cells to
mature CD4+and CD8+SP when compared with wild-type cells
(Izon et al., 1998). This suggests that lifting the repression ex-erted by HOXA9 on the TCRA enhancer accelerates the matu-ration of thymocytes. Inversely, our HOXA9 overexpression experiments suggest a shift in lineage choice toward TCR γδ-expressing cells in both in vitro and in vivo experiments. This hints at an important role for physiological repression of Eα activity by HOXA proteins on thymocyte development. These data also pave the way for further investigation of the HOXA proteins role in theαβ versus γδ T cell lineage choice.
The blockage of Eα activity and subsequent lack of TCRA rearrangements during thymic differentiation can have severe implications. The cortical thymic maturation arrest observed in T-ALLs overexpressing TLX1 or TLX3 proteins is caused by the recruitment of TLX1/TLX3 to Eα by interacting with ETS1, leading to reduced enhancer activity and consequent inhibition of TCRA VJ recombination, maturation arrest of DP thymocytes, and leukemic transformation (Dadi et al., 2012). This maturation block can be overcome by TLX1/3 abrogation or by downstream TCRαβ expression, which leads to TCRA rearrangement and apoptosis. The deregulation of HOX genes has also been reported in acute leukemias (Alharbi et al., 2013), especially those with mixed-lineage leukemia/KMT2A translocations. Mixed-lineage leukemia fusion proteins constitutively up-regulate HOXA9 ex-pression (Ferrando et al., 2003). HOX genes are also overex-pressed in T-ALLs with PICALM-MLLT10 or SET-NUP214 translocations or rearrangement of HOXA into a TCR locus (HOXA-TCR;Dik et al., 2005a;Soulier et al., 2005;Speleman et al., 2005;Van Vlierberghe et al., 2008). These T-ALLs are predominantly immature or express a TCRγδ, suggesting a role for HOXA gene overexpression and Eα inhibition in the development of these leukemias. Taken together, we propose that the endogenous HOXA5-9 transcription factors restrain the activity of a fully assembled Eα enhanceosome and prevent premature TCRA recombination in early thymocyte precursors, thereby pro-viding the tight epigenetic control of Eα activation.
Overall, these epigenomic resources provide a detailed mo-lecular framework to guide future studies on early T cell dif-ferentiation in human and their potential implications in leukemogenesis as well as thymic origins of immune-related disorders (Clave et al., 2018;Kernfeld et al., 2018).
Figure 8. HOXA9 overexpression leads to a TCRγδ bias in human T-ALL. (A) RQ-PCR analysis of the HOXA9 gene expression in the TCRαβ (n = 45) and TCRγδ (n = 96) T-ALLs. Results are relative to the ABL1 housekeeping gene. **, P = 0.003 (two-tailed Mann– Whitney test). (B) RQ-PCR analysis of thepreTα gene expression in the HD-overexpressing (n = 30) and HD-negative (n = 8) TCRγδ T-ALL. Results are relative to theABL1 housekeeping gene expression. *, P = 0.02 (two-tailed Mann–Whitney test). (C) RQ-PCR analysis of theSOX13 gene expression in the HD-overexpressing (n = 34) and HD-negative (n = 12) TCRγδ T-ALL. Results are relative to theABL1 housekeeping gene expression. **, P = 0.003 (two-tailed Mann–Whitney test).
Table 1. TCRB rearrangement analysis in the TCRγδ T-ALLs according to their deregulation of homeodomain genes
TCRB rearrangements TCRγδ T-ALL patients (n = 95) No. (%) VDJ DJ GL HD-overexpressing 71 (75) 45 23 3
HOXA 39 (41) 16 20 3
TLX1/3 32 (34) 29 3 0
HD-negative 24 (25) 3 10 11
Abbreviations: DJ, incompleteTCRB rearrangements; GL, germline (TCRB not rearranged); HD, homeodomain gene (i.e., HOXA, TLX1, TLX3).
Materials and methods
Cell lines
HeLa cells were maintained in DMEM, high glucose (Thermo Fisher Scientific, 41965062) supplemented with 10% FBS (Thermo Fisher Scientific, 10270106) and 1% penicillin/streptomycin.
Loucy (ACC-394) and Jurkat cell lines (ACC-282) were cultured in RPMI-1640 medium (Thermo Fisher Scientific, 21875091) sup-plemented with 20% and 10% FBS, respectively, 1% penicillin/ streptomycin, and 1× sodium pyruvate.
Platinum-E (the retroviral packaging cell line) was main-tained in DMEM supplemented with 10% FBS (Thermo Fisher Scientific, 10270106), 1% penicillin/streptomycin, 10 µg/ml blas-ticidin, and 1 µg/ml puromycin.
OP-DL1 stromal cell lines were maintained in MEM α and GlutaMAX supplement medium (Thermo Fisher Sci-entific, 32561094) supplemented with 20% FBS Hyclone SH30070.03HI (Thermo Fisher Scientific, 10772634) and 1% penicillin/streptomycin.
Primary cells preparation
Human CD34+ UCB cells were isolated from cord blood using
lymphocyte separation medium (Eurobio, CMSMSL01-01). Next, immature CD34+UCB cells were positively selected with direct
CD34+ progenitor cell isolation kit (Miltenyi Biotec,
130–046-702) using the LS separation columns (Miltenyi Biotec, 130–042-401). The CD34+-positive cell population was further purified by
sorting with FACS ARIA III to obtain 98–99% purity of CD34+
UCB cells.
Human thymic subpopulations were obtained from children undergoing heart surgery. Informed consent was obtained from the parents. Thymi were dissociated until the single-cell sus-pension. Specific subpopulations were purified by sorting using FACS ARIA III (BD Biosciences). For the immature subpopula-tion, thymocytes were prepurified by depletion of CD3- and CD8-positive fractions by magnetic-activated cell sorting using CD3 MicroBeads (Miltenyi Biotec, 130–050-101) and CD8 Mi-croBeads (Miltenyi Biotec, 130–045-201) respectively. Anti-bodies used for cell labeling of the CD3−/CD8−thymic fraction were as follows: CD1a FITC, clone NA1/34 (Dako, F7141), CD34 APC (BD Biosciences, 345804), CD8 PC7 (Beckman, 737661), CD3 Alexa 700 (BD Biosciences, 557943), CD4 V450, clone RPA-T4 (BD Biosciences, 560345), and CD45 V500, clone HI30 (BD Biosciences, 560777). Final purity after sorting was over 95%.
Mouse thymic cells from 6- to 8-wk-old C57Bl/6Rj mice were extracted and mechanistically disrupted on a 75-µm nylon cell strainer. Cells were washed twice with cold PBS supplemented with 2% of FBS. DN thymocytes were isolated by depletion of CD4- and CD8-positive fractions using magnetic beads (Miltenyi Biotec, 130–117-043 and 130–117-044, respectively). For maxi-mum purity, the sorting of DN cells was performed using a FACS ARIA III.
Rodents
C57Bl/6 (CD45.2) mice were purchased from Janvier Labs. Rag2−/−γc−/−(CD45.1) mice used in the in vivo experiments were purchased from The Jackson Laboratory. All experiments were
performed according to procedures approved by the Committee of Paris Descartes University.
T-ALL patients
150 adult and pediatric TCRαβ- and TCRγδ-expressing T-ALLs were selected from the Necker-Enfants Malades Bio-bank col-lection (http://www.biobanques.eu/fr/nous-connaitre/membres/ item/prb-necker-paris) based on their DNA/cDNA availability. Studies were conducted in accordance with the Declaration of Helsinki and approved by local and multicenter research ethical committees (Group for Research in Adult Acute Lymphoblastic Leukemia—GRAALL NCT00222027 and NCT00327678). Informed consent was obtained from all patients. Leukemic blasts were isolated from peripheral blood of T-ALL patients using Ficoll gradient separation.
Reference epigenomes of human thymopoiesis
Five sorted human thymic subpopulations (tCD34, EC, LC, SP4, and SP8) were used for ChIP-seq (H3K4me3, H4K4me1, H3K27ac, H3K27me3, H3K36me3, and H3K9me3) and WGBS following the BLUEPRINT protocol (http://dcc.blueprint-epigenome.eu/#/md/ methods). Briefly, for ChIP-seq of histone marks, sorted thymic samples were incubated with 1% formaldehyde (Merck, F8775) in PBS for 10 min at room temperature. Next, 1/10 volumes of quenching solution of 1.25 M glycine (Merck, GE17-1323-01) were added to the medium and were shaken for 5 min at room tem-perature. Cells were collected by centrifugation and washed once with PBS-BSA 0.5%. For WGBS sequencing, DNA was extracted from sorted thymic subpopulations using the Nucleon BACC2 extraction kit (Merck, GERPN8502) according to the supplier’s instructions.
Processed data were retrieved from the BLUEPRINT project. To complement the reference epigenomes, additional ChIP sam-ples were sequenced in house in single-end 75 nt mode using the NextSeq 500/550 (Illumina) according to the manufacturer’s in-structions, and processed following the BLUEPRINT protocol. Aligned ChIP-Seq reads from multiple donors were merged for each thymic subpopulation (details in Table S2 and Table S6). RNA-seq of human thymopoiesis
Six sorted human thymic subpopulations (tCD34, ISP, EC, LC, SP4, and SP8) were used for poly(A)-enriched RNA-Seq. Frag-ments were sequenced in stranded paired-end mode (2 × 50 bp) using the SOLiD HQ5500XL platform (Life Technologies; Table S2 and Table S6). SOLiD RNA-seq data were processed using LifeScope (Life Technologies) and TopHat using default parameters. Thy3 and Thy4 RNA-seq samples from Casero et al. (2015)were retrieved and aligned using STAR and En-sembl GRCh38 release 93 annotation track. Quantification in genes for both experiments was done with Subread Featur-esCounts. GeTMM count normalization (Table S3;Smid et al., 2018), and differential expression analysis were done using EdgeR (Table S4).
ATAC-seq of human thymopoiesis
Four sorted human thymic subpopulations (CD34+1a−, CD34+1a+,
EC, and LC) from two donors were used for ATAC-seq. 5 × 10⁴
thymocytes were washed with cold PBS and lysed in 50 µl of cold lysis buffer (10 mM Tris-HCl, pH 7.4; 10 mM NaCl; 3 mM MgCl2;
and 0.1% Igepal CA-630). Transposition reaction was performed in 50 µl of 1× Tagment DNA reaction buffer supplemented with 2.5 µl of TDE1 Tn5 Transposase from Nextera DNA Library Prep Kit (Illumina, FC-121-1030) at 37°C for 30 min. Directly after transposition, purification using MinElute PCR Purification kit (Qiagen, 28004) was performed, followed by sequencing. Sam-ples were sequenced in house in single-end 75 nt mode using the NextSeq 500/550 (Illumina) according to the manu-facturer’s instructions. Reads were trimmed with sickle and aligned with bowtie2 using default settings. Aligned reads from tCD34+1a−and tCD34+1a+populations from the two
do-nors were merged to generate the tCD34 ATAC sample (Table S2 and Table S6).
Chromatin segmentation and space generation
Merged ChIP-seq for each thymic subpopulations were seg-mented with ChromHMM (Ernst and Kellis, 2017) using the 11-state chromatin model from (Carrillo-de-Santa-Pau et al., 2017) to complement their published chromatin states from other hematopoietic cells. Regions with variable chromatin states across hematopoietic cell types were extracted using Chromdet and the five-state collapse model from Carrillo-de-Santa-Pau et al. (2017). MCA was done using FactoMineR R package, and cell-type delimitation ellipses were manually added afterward. The Sankey plot was generated using the riverplot R package. Genome browser views were produced with IGV, then com-pacted with Inkscape.
Functional enrichment analysis
Functional enrichment analyses were produced using a custom pipeline to automate multi-sample queries to the Genomic Re-gions Enrichment of Annotations Tool (GREAT) web service. In summary, features were converted to hg19 assembly using crossmap and queried with rGREAT R package against Gene Ontology (GO) Biological Process and Molecular Signatures Da-tabase (MSigDB) Pathways. Genomic association rules with genes were done using default GREAT“basal plus extension.” Significant terms were filtered as those having binomial fold enrichment >2 and both binomial and hypergeometric tests Benjamini–Hochberg–adjusted P values <0.05. Additionally, MSigDB Pathway terms were further filtered for heatmap display to keep only the best five terms for each sample according to the binomial P value. For GO biological process, GOSemSim R package was used to compute Wang similarity distance between all terms. Terms with a similarity distance higher than 0.1 were grouped, unless specified otherwise. Only the best term according to binomial fold enrichment for each group and sample was kept for heatmap display. Color scale on heatmaps displays binomial Benjamini– Hochberg–adjusted P values.
Definition of distal regulatory elements and association to genes
Hypomethylated CpG regions were defined from WGBS following the BLUEPRINT protocol (http://dcc.blueprint-epigenome.eu/ #/md/bs_seq_grch38). Distal regulatory regions were defined as
hypomethylated regions in at least one thymic subpopulation falling between 2 and 2,000 kb from the closest gene, based on the subset of Ensembl release 93 annotation track containing only protein-coding as well as TCR and immunoglobulin loci. Regions overlapping repeats from repeatMasker, mitochondrial, and sex-ual chromosomes or exhibiting standard deviation >0.05 between donor samples from the same thymic subpopulation were filtered out. Constitutive hypomethylated distal regulatory elements were defined as those with CpG mean methylation signal <0.25 for all thymic subpopulation samples. Distal cis-regulatory regions from WGBS and ATAC peaks were associated with both their nearest upstream and downstream genes as long as they were within 2,000 kb range.
Clustering
Clustering was done by k-means using Lloyd algorithm and Pearson distance on mean CpG signal in hypomethylated regions (Fig. 2 A), on qualitative H3K27ac peak presence (Fig. 2 F), and on qualitative ATAC peak presence (Fig. 3).
Normalization and peak-calling
ChIP-seq coverage tracks were computed using DANPOS and quantile-normalized against SP8 samples, as an arbitrary ref-erence. ATAC-seq coverage tracks were computed using deep-Tools bamCoverage with RPKM normalization. Peaks for both ChIP-seq and ATAC-seq were called using Macs2. Profiles and heatmaps were generated using deepTools plotProfile and plo-tHeatmap, respectively.
Tissue specificity
Consensus RNA-seq signals from 61 tissues were retrieved from the Human Protein Atlas version 19.2 (http://www. proteinatlas.org/download/proteinatlas.tsv.zip; Uhl´en et al., 2015). Preferential expression measure (Huminiecki et al., 2003) was used to score differential expression of genes in thymus versus all other tissues with the exception of mature T cells, total peripheral blood mononuclear cells, and spleen. Genes with a preferential expression measure >0.1 were classified as thymus specific.
Motif enrichment
Conserved transcription factor binding sites were retrieved from the University of California, Santa Cruz genome browser. Binding motifs for the same transcription factor were merged. Clustered distal ATAC peaks were queried for enrichment against the merged set of motifs using the OLOGRAM tool (Ferr´e et al., 2019) from the Pygtftk package (Lopez et al., 2019). Gene expression analysis
RNA was extracted using the RNeasy Mini Kit (Qiagen, 74104) and converted into cDNA using SuperScript III Reverse tran-scription (Thermo Fisher Scientific, 18080093). Real-time PCR reactions were performed using Taqman Universal PCR Master Mix (Thermo Fisher Scientific, 4304437) or SYBR Green PCR Master Mix (Thermo Fisher Scientific, 4309155). Real-time qPCR (RQ-PCR) was performed on an Applied Biosystems 7900HT Fast Real-Time PCR system. Primer sequences are in Table S5.
MultiplexTCRA RT-PCR analysis
TCRA cDNA was amplified from Cα (6-fluorescein amidite fluorophore–labeled) and various Vα in five multiplex RT-PCRs (Villarese et al., 2018). Briefly, 20 ng of cDNA were amplified per PCR tube with 1U HotStarTaq DNA Polymerase (Qiagen, 203203), 2 mM of MgCl2, 20% Q solution, 10 mM
deoxynucle-oside triphosphate final concentration, and 10 pmol of each primer. The Taq polymerase was activated for 15 min at 95°C. Then the DNA was amplified with 37 cycles at 94°C for 30 s, at 63°C for 45 s, and at 72°C for 1 min 30 s. The final elongation was 72°C for 10 min. Primer sequences are in Table S5. The analysis of rearrangements by multiplex fluorescent PCR was performed by separation of single-stand (denaturated) PCR products in a capillary sequencing polymer and detected via automated laser scanning (3130 Genetic Analyzer, Applied Biosystems).
CAT reporter assay
HeLa cell lines were transfected using Lipofectamine 2000 Transfection Reagent (Thermo Fisher Scientific, 11668019) in the Opti-MEM I Reduced Serum Medium (Thermo Fisher Scientific, 51985026) according to the manufacturer’s instructions. Cells at 70% confluency were cotransfected with the Eα-CAT reporter construct together with expression vectors for ETS1-HA-His, LEF1-HA, and RUNX1-T7. To test the CAT repression, cells were additionally transfected with expressing vectors for FL forms of HOXA5-9 or homeodomain deleted forms: HOXA5-ΔHD (aa 1–187), HOXA6-ΔHD (aa 1–147), HOXA7-ΔHD (aa 1–126), and HOXA9-ΔHD (aa 1–193). All HOXA proteins were cloned into the pEGFP-C1 vector (Clontech, 6084–1), where their N terminus were fused with GFP. After 24 h of incubation, expression of CAT activity was determined using the CAT ELISA kit (Merck, 11363727001) according to the manufacturer’s recommendations. TCRA enhancer repression in Jurkat cell line
Jurkat cells were transected with FL and homeodomain depleted forms (ΔHD) of HOXA5-9 proteins (same as in CAT-ELISA ex-perience). Electroporation transfection was performed using the Neon Transfection System according to the manufacturer’s in-structions. At 48 h after transfection, the expression of the constant region of the TCRA gene (Cα transcript) was evaluated by quantitative RT-PCRs.
Quantification of H3K27ac level at Eα enhancer in T-ALL patients
H3K27ac ChIP-seq for mature T-ALL samples was quantile-normalized against an SP8 sample using DANPOS. Then H3K27ac coverage around Eα (chr14:22554500-22558500 in hg38 assembly) was quantified using DeepTools multiBigwigSummary. T-ALL were divided into three groups according to homeodomain gene expres-sion and classified as homeodomain-negative, HOXA5-9–positive, or TLX1/TLX3-positive.
ChIPs
tCD34+, EC, and LC thymocytes were cross-linked for 10 min
with 1% formaldehyde at 20°C and sonicated using a Branson 450 Sonifier Cell Disruptor to obtain DNA fragments of∼500 bp.
ChIP was conducted with RUNX1 (Abcam, ab23980), anti-ETS1 (C20X; Santa Cruz, sc-350) or anti-IgG antibody (Abcam, ab37415) using Dynabeads Protein G for Immunoprecipitation (Thermo Fisher Scientific, 10003D). Extracted ChIP DNA was purified by QIAquick PCR Purification Kit (Qiagen, 28104). ChIPed DNA was quantified in RQ-PCR assay using primers presented in Table S5.
ChIP analysis of HOXA binding was performed in two cell line models: Loucy and HeLa. Loucy cells were electroporated using Neon Transfection System (1 pulse of 1,700 V, 20 ms) with expressing vectors for HOXA5-9 (FL and HD-deleted forms) tagged with streptavidin-binding peptide (SBP)–Flag epitope or empty vector NTAP as control (vectors are listed in Table S6). After 48 h incubation, cells were cross-linked with 1% formal-dehyde for 10 min. ChIP was performed as described above using anti-Flag antibody (Merck, F1804). Samples were analyzed by RQ-PCR using Ealpha-F/Ealpha-R for enhancerα binding and actin-F/actin-R for control. Primers are listed in Table S5. HeLa cells were transiently transfected using Lipofectamine 2000 Transfection Reagent (Thermo Fisher Scientific, 11668019) in the Opti-MEM I Reduced Serum Medium (Thermo Fisher Scientific, 51985026) with expressing vectors for ETS1-HA-His, LEF1-HA, RUNX1-T7, and Eα-CAT reporter constructs together with indi-vidual expressing vectors for HOXA5-9 (FL or HD-deleted forms) tagged with SBP-Flag or the empty vector SBP-Flag (NTAP) as control. After 24 h of incubation, cells were cross-linked with 1% formaldehyde for 10 min. ChIPs were performed with anti-Flag antibody (Merck, F1804). Samples were analyzed by RQ-PCR with the following primers: vect-Ealpha-F/vect-Ealpha-R for enhancer binding and vect-ctr-F/vect-ctr-R for control. Pri-mers are listed in Table S5.
IP
2 × 10⁸of Loucy cells or total thymocytes were lysed for 30 min
with 8 ml of 1× radioimmunoprecipitation assay buffer (Cell Signaling, 9806) complemented with Complete EDTA-free Pro-tease Inhibitor Cocktail (Merck, 11873580001). The lysates were incubated overnight at 4°C with 10 µg of anti-ETS1 (C20X; Santa Cruz, sc-350) or anti-HOXA9 antibody (13C11, noncommercial production), followed by 2 h of incubation at 4°C with 20 µl of Protein G Agarose, Fast Flow (Merck, 16–266). After four washes with washing buffer (100 mM NaCl and 15 mM Tris-HCl, pH 7.8), bound proteins were eluted and detected by Western blot with anti-HOXA9 (13C11) or anti-ETS1 (C20X) antibodies. Immunofluorescence analyses
Cells were fixed on poly-L-lysine (0.01%) precoated slides with PBS-BSA 1%/3.5% formaldehyde solution for 20 min at room temperature, and then permeabilized in PBS supplemented with 10% FBS and 1% Triton X-100 for 5 min (cell lines) or 10 min (thymocytes). Cells were incubated at 4°C overnight with anti-HOXA9 (13C11; dilution 1/20) or anti-ETS1 (C20X; dilution 1/250) antibodies, and then labeled with secondary antibodies goat anti-mouse IgG Alexa Fluor A555 (Thermo Fisher, A-21422) and goat anti-rabbit IgG Alexa Fluor 488 (Thermo Fisher, A-11008) in a dilution of 1/200. For PLA, cells were fixed, permeabilized, and incubated with primary antibodies as described above. The