HAL Id: hal-02735384
https://hal.archives-ouvertes.fr/hal-02735384
Submitted on 2 Jun 2020
HAL is a multi-disciplinary open access
archive for the deposit and dissemination of
sci-entific research documents, whether they are
pub-lished or not. The documents may come from
teaching and research institutions in France or
abroad, or from public or private research centers.
L’archive ouverte pluridisciplinaire HAL, est
destinée au dépôt et à la diffusion de documents
scientifiques de niveau recherche, publiés ou non,
émanant des établissements d’enseignement et de
recherche français ou étrangers, des laboratoires
publics ou privés.
Experiments support simulations by the
NEPTUNE_CFD code in an Upflow Bubbling Fluidized
Bed reactor
Florian Sabatier, Renaud Ansart, Zhang Huili, Jan Baeyens, Olivier Simonin
To cite this version:
Florian Sabatier, Renaud Ansart, Zhang Huili, Jan Baeyens, Olivier Simonin. Experiments support
simulations by the NEPTUNE_CFD code in an Upflow Bubbling Fluidized Bed reactor. Chemical
Engineering Journal, Elsevier, 2020, �10.1016/j.cej.2019.123568�. �hal-02735384�
OATAO is an open access repository that collects the work of Toulouse
researchers and makes it freely available over the web where possible
Any correspondence concerning this service should be sent
to the repository administrator: [email protected]
This is an author’s version published in: http://oatao.univ-toulouse.fr/25248
To cite this version:
Sabatier, Florian
and Ansart, Renaud
and Huili, Zhang and Baeyens,
Jan and Simonin, Olivier
Experiments support simulations by the
NEPTUNE_CFD code in an Upflow Bubbling Fluidized Bed reactor. Chemical
Engineering Journal. ISSN 1385-8947
Official URL :
https://doi.org/10.1016/j.cej.2019.123568
Open Archive Toulouse Archive Ouverte
Experiments support simulations by the NEPTUNE_CFD code in an Upflow
Bubbling Fluidized Bed reactor
Florian Sabatier
a, Renaud Ansart
a,⁎,1, Huili Zhang
b,⁎,2, Jan Baeyens
b, Olivier Simonin
caLaboratoire de Génie Chimique, Université de Toulouse, CNRS, INPT, UPS, Toulouse, France bSchool of Life Science and Technology, Beijing University of Chemical Technology, Beijing, China cInstitut de Mécanique des Fluides de Toulouse (IMFT), Université de Toulouse, CNRS, Toulouse, France
H I G H L I G H T S
•
The different fluidization modes in a 4 m long tube are experimentally in-vestigated.•
Fluidization phenomena differ with the tube length (from freely bubbling to slugging).•
Results are used to validate a 3D si-mulation approach by theNEPTUNE_CFD code.
•
The effect of mesh refinement on the slugging behavior prediction is dis-cussed.•
It is demonstrated that experiments and simulation predictions are in good agreement.G R A P H I C A L A B S T R A C T
A B S T R A C T
Long tubes with small internal diameter find increasing applications in indirect concentrated solar receivers using an Upflow Bubbling Fluidized Bed of Geldart-A powders as heat carrier. Although successfully demon-strated for tubes of 0.5 to 1 m length, longer tubes are required to increase the solar energy capture efficiency and capacity. The fluidization phenomena differ with the tube length, and freely bubbling fluidization will be transformed into slugging, thus hampering the heat transfer. The behavior of Geldart-A powders in tall tubes of small I.D. has not been extensively studied. The research experimentally investigated the different fluidization modes in a 4 m long tube, and demonstrated the occurrence of freely bubbling at the bottom section of the bed, and slugging from a bed depth in excess of about 1.25 m. Slug characteristics (frequency, length, velocity) were measured and correlated. The results were used to validate 3D numerical simulations based on an Euler-Euler approach in the NEPTUNE_CFD code applied to a fine mesh of 15,000,000 cells. A positive match between experimental and simulation results concerning frequency and velocity of large bubble structures was obtained. The effect of mesh refinement on the slugging behavior prediction was discussed.
⁎Corresponding authors.
E-mail addresses:[email protected](R. Ansart),[email protected](H. Zhang).
1Numerical simulation. 2Experiments.
1. Introduction
Gas/solid fluidization powders can involve C (cohesive), A (aera-table), B (bubbling) and D (coarse) particles [1–3]. The different powder groups can be expressed in terms of the relevant particle size,
dp, and gas/solid densities, gand s[1,4].
For cristobalite sand, used in the present research ( ~2640 kg ms 3),
C powders will be smaller than 33 µm; the aeratable group A will cover the range of 33 to 86 μm; group B powders will range from 86 to 446 μm; and group D powders will have a particle size in excess of
446 µm. Although aeratable group A powders are widely used in com-mercial fluidized bed catalytic reactors[5], their recent application in Upflow Bubbling Fluidized Bed (UBFB) or Cross-flow Bubbling Flui-dized Bed (CfBFB) indirect solar receivers opens new application per-spectives[6–11]due to their high mobility[12], high wall-to-bed heat transfer rates[13], and their easy circulation around the concentrated solar energy loops. Gas bubbles in group A powders moreover split and recoalesce frequently, resulting in a maximum stable bubble size
[1,14], as further discussed in the paper. The bubble size is independent of the average particle size in Geldart-A powders. The bubble rise ve-locities appear to be ~0.3 to 0.4 m s−1, irrespective of the bubble size,
suggesting that the gross powder circulation controls the rise velocity
[1,14,15]. Bubbles will transform into slugs at sufficiently high super-ficial gas velocity or in deep beds, as illustrated inFig. 1. Slugs reduce particle mixing and minimize the gas/solid contacting[13]and reduce the wall-to-bed heat transfer coefficient[12]. Bubbling and slugging are distinct hydrodynamic modes in a fluidized bed and should therefore be jointly considered in predicting chemical conversions and heat transfer. At velocities in excess of 0.5m/s, depending on the particle size, a turbulent or ultimately circulating fluidized bed mode will occur and particle recycling is required to maintain the bed solids’ inventory
Nomenclature Roman symbols
Cd drag coefficient (–)
D column diameter (m)
d50 powder distribution median volume diameter (m or μm)
dB bubble diameter (m)
ddrag drag diameter (m or μm)
d[ ; ]m n powder distribution specific [m;n] diameter according to
= dm n d f r dr d f r dr m n [ ; ] ( ) ( ) 1 rminrmax m rminrmax n (m or μm) dp particle diameter (m or μm)
dsv powder surface/volume diameter (m or μm)
ec particle-particle normal restitution coefficient (–)
ew particle-to-wall restitution coefficient (–)
fS slug frequency (Hz)
g gravitational constant (m s−2)
H expanded bed height (m)
Hmb expanded bed height at =U Umb(m)
Hmf expanded bed height at =U Umf(m)
kN Newton regime non-sphericity drag correction coefficient
(–)
kS Stokes regime non-sphericity drag correction coefficient
(–)
L distance between distributor level and measurement level along the bed height (cm)
LS slug length (cm)
qp2 mean particle random kinetic energy (m2s−2)
Rep particle Reynolds number (–)
U fluidization velocity (m s−1)
Uk i, mean velocity of phase k (m s−1)
Umb minimum bubbling velocity (m s−1)
Umf minimum fluidization velocity (m s−1)
US slug velocity (m s−1)
Ut terminal settling velocity (m s−1)
WS slug interval (cm)
x y z, , carthesian coordinates in the tube: x y, in the cross sec-tion, z oriented opposite to the gravitational force (m)
r, polar coordinates projected in plan view x y/ , (m and rad respectively)
Greek symbols
k volume fraction of phase k (–)
s min, frictional viscosity activation threshold (–) s max, maximal particles compaction (–)
P Average pressure drop across the fluidized (Pa)
P
( ) fluctuations of the pressure drop (Pa)
r Radial cell size (m) z Axial cell size (m) l 2D grid cell size (m) B bubble fraction (–)
bed voidage (–)
µg gas viscosity (Pa s−1)
average particle sphericity (–)
k density of phase k (kg m−3) B Bulk density (kg m−3)
Subscripts
g gas
s solid
3
29.7 mm 1 m
U Umf
The novelties of the present paper and the objectives are hence clearly defined, and result from the use of extensive experimental data in support of a dedicated NEPTUNE_CFD code simulation. The objec-tives involve a stepwise approach that:
(i) fully assesses properties of the system under scrutiny, with spe-cial emphasis on secondary particle properties such as size dis-tribution and sphericity;
(ii) studies the hydrodynamic behavior of selected particles experi-mentally in a small I.D. tube of4 mheight;
(iii) introduces relevant simulation conditions into the NEPTUNE_CFD code, to define simulation geometry and mesh, fix boundary conditions (inlet, outlet, tube walls), and assesses the in-fluence of the relevant particle and air properties;
(iv) applies an Euler-Euler model, with governing equations de-scribed by Ansart et al.[23];
(v) validates the approach through pressure gradients and solid volume fraction;
(vi) compares experimental and simulation results towards slug formation, slug frequency, velocity, and occupancy profiles along the tube diameter and height;
(vii) discusses the effect of refining the mesh characteristics on the slugging behavior prediction for Geldart-A powders;
(viii) formulates fluid-dynamic conclusions and recommendations.
2. Experimental setup and procedures 2.1. Equipment and powders used
Within the concept of a “particle-in-tube” UBFB, a small I.D. cy-lindrical column was used of50 mmI.D. and of a total height of4 m, hence complementing the experimental research of Kong et al.[1], limited to a 2 m high tube. Experimental procedures were detailed by Kong et al.[1]and involve an operating air flow rate in the range of 0 to 5 × 10⁻⁴kg s−1. The fluidized bed is fed by compressed air at ambient
temperature and the bed exhaust is connected to atmosphere. The distributor plate had a pressure drop of 1560 Pa at a superficial air velocity of 0.1 m s−1, significantly exceeding the common design
re-commendations[24]. The Geldart-A powder used was cristobalite si-lica. Particle properties were defined by the methods described by Kong et al. [1], with mean particle size of 55 µm, absolute density of 2640 kg m3 and tapped bulk density [3] of 1380 kg m 3. U
mf was
Fig. 2. Schematics of a solar tower combined cycle generation process[7].
[16–18]. Small Internal Diameter (I.D.) beds are normally used in la-boratory scale experiments, or represent the constrained bed cells in between vertical heat exchanger tubes in a catalytic reactor [5]. The current development of particle suspension solar heat receivers use such small I.D. beds with Geldart-A powders as heat carriers [8,9].
Fig. 2 depicts the layout of a MWth hybrid combined cycle solar tower
power plant, to be tested on pilot-scale at the CNRS-Themis solar tower (France), without the steam block [6,7,9]. The pilot-scale set-up is de-scribed elsewhere and includes the particle suspension receiver, hot particle storage [19], and crossflow fluidized bed air heater to preheat the turbine compressed air [6,7]. Exhausts from the turbine are fed to a steam block. The design of the receiver is of paramount importance in order to be able to operate at as high a temperature as possible (750 to 850 °C).
The present work considers the scale-up of the Upflow Bubbling Fluidized Bed (UBFB) receiver concept. Previous papers have provided information concerning the on-sun testing of a single tube (36 mm I.D., 0.5 m long) and of a 150 kWth pilot module consisting of 16 parallel
tubes of I.D., each long, using group A powders fluidized at superficial gas velocities of ~0.03 to 0.20 m s−1 [9,11,20,21]. A further
scale-up to multi-MW capacity will involve the use of the parallel tube-concept with larger I.D. tubes and of taller height towards an optimum use of the concentrated heliostat beams and provide sufficient heat capture surface area. Although receiver heights of 10 to 18 m are now common practice in molten salt applications [22], the gas-solid hy-drodynamics in the UBFB will limit the maximum applicable height in function of the tube geometry, with special emphasis on its height, due to the occurrence of slugging (Fig. 1). The onset of slugging mostly depends upon the tube diameter and the excess gas velocity, i.e.
[1]. Since slugs have a limited bubble-induced particle mixing, they reduce the wall-to-bed heat transfer [13]. It is hence important to investigate the bubbling/slugging effects i n a g eometry s imilar t o the currently scaled-up particle-in-tube concept.
P 0.34
Umf
Umb Umf Umb
Ut
2.2. Measuring techniques
The behavior of fluidized beds at the onset of slugging and full slugging mode was assessed by three different methods, as previously used by Baeyens and Geldart[2]and Kong et al.[1]. Visual observa-tions, pressure drop and its fluctuations and high speed camera imaging were jointly used and assessed. Whereas visual observations cannot be used in the bottom (bubbling) section of the bed due to overlapping bubbles, and pressure drop measurements show significant fluctuations, the combined analyses of the three methods provided a satisfactory insight into the full slugging mode. Photographic illustration of the observed wall and axi-symmetric slugs is given inFig. 3.
2.3. Experimental procedure
The bed heights at UmfandUmbwere measured. The gas velocity was
then increased to well into the slugging regime. Flow rate readings, visual and P observations, and images were made for given periods of time (between 2 and 3 min). All data points presented in the figures are averages of 3 repeat experiments. The deviation among 3 repeat results and the averages was below 5%. The evolution of expanded bed height (H) in relationship with the bed height at minimum bubbling (Hmb)
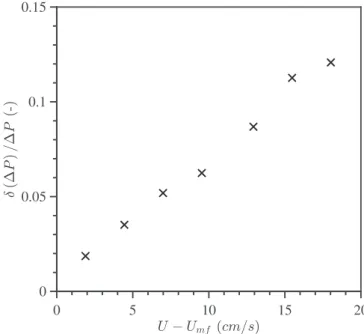
with excess gas velocity is illustrated inFig. 4. The time average pres-sure drop across the whole bed P, and the prespres-sure fluctuations, presented as standard deviation to the average pressure drop ( P), were recorded and presented as ratio inFig. 5. Leva et al.[27] tenta-tively predicted the onset of slugging when pressure fluctuations exceed 5 per cent of the pressure drop through the bed at the given gas flow rate. This rule of thumb was in fair agreement with our observations.
At U U( mf)values beyond the onset of slugging, big bubbles ra-pidly transformed into wall-slugs, which prevailed throughout the bed height for about1.25 m. They are subsequently transformed into
axi-symmetric slugs in deeper beds. The axi-axi-symmetric slugging mode hampers the heat transfer from the receiver wall to the bed (poor solids mixing and long contact of an air slug with the wall).Further experi-mental results will be given in Section4below.
3. Numerical simulation description 3.1. Mathematical model
3.1.1. Eulerian modeling approach
To access to the particle behavior inside the receiver tubes, two CFD approaches (Eulerian-Lagrangian or Eulerian-Eulerian) can be used. The Eulerian-Lagrangian approach treats particles as discrete elements when the fluid flow is characterized by Eulerian equations. The motion for each individual particle is solved, with inclusion of the effects of
Fig. 3. Photographic illustrations of Axi-symmetric slugs in the powder at the
level of 150 cm in the bed: a)U Umf=9cm s−1b)U Umf=12cm s−1, and
wall slugs in the powder at the bed level of 90 cm: c)U Umf =9cm s−1; d) =
U Umf 12cm s−1.
Fig. 4. Total bed height fluctuations with U Umffor the cristobalite powder at
=
Hmf 230 cm, andHmb=~270 cm.
Fig. 5. Relative standard deviation of pressure ( ( P)/ P) versus U Umffor
cristobalite powder, measured across the total bed height, forHmf=230 cm.
determined from a common versus U graph, and was cm s−1.
The minimum bubbling velocity of 0.53 cm s−1 corresponded with the
superficial air velocity when first bubbles could be seen erupting at the bed surface. The accuracy on was 0.01 cm s−1 while being
0.02 cm s−1 for . Values of and are clearly different. The
particle shape was determined by OPTEC DV 320 microscope imaging and the sphericity ( ) varying between 0.64 and 0.71 was calculated from Cavarretta et al. [25] and Cho et al. [26]. was calculated as 0.203 m s−1 according to the method described by Geldart [3]. For the
minimum fluidization height of 230 cm, the column was filled with 5 kg of solid.
100 µm = 0.55 s min, = 0.64 s max, qp2
3.1.3. Consideration of powder PSD and non-sphericity
As shown inFigs. 6 and 7, the powder used presents a very broad particle size distribution. Since particles follow a Gaussian-like mono-modal size distribution, the complete size distribution was simplified to a single particle class with two separate diameters: (SeeFig. 8)
= d d d drag [3; 0] 3 [1;0] (1)
ddragfor the drag coefficient term, as defined in Eq.1anddp=d50, the
median diameter, for every other equation (momentum transfer, random kinetic energy, collisions) as previously applied by Sabatier et al.[41]. The drag term coefficient of Gobin et al.[39]was modified to include effects of non-sphericity based on the work of Bagheri and Bonadonna [42]as expressed in Eqs.(2). Two coefficientskN andkS
were introduced, correcting the drag term in the Stokes and Newton regime respectively, and determined by the measurement of two shape factors defined by Bagheri and Bonadonna[42].
= < C Re C C C ( ) if 0.7 min[ , ] else 0.7 d p d WY g d WY d Erg g , , , nsph nsph nsph (2.a) = + + + C k Re Re k k k 24 1 0.125 0.46 1 d WY S p p N S N Re k k g , 2/3 5300 / 1.7 nsph p N S (2.b) = + = C k Re k Re v d µ 200 (1 ) 7 3 , | | d Erg S g p N p g g r p p g , (2.c) = < > = Vrp i, vr i, p Up i, Ug i, (2.d)
3.2. Geometry and mesh 3.2.1. Geometric model
The geometric model used for simulation was the experimental4 m
long pipe of 5 cm I.D., followed by a convergent head. To prevent the occurence of a local exit pressure drop that could result in a numerical error for the code, the convergent head (although not used experi-mentally) accelerates the particle suspension before the tube exhaust, in order to prevent occasional backflow and thus numerical artifacts.
Fig. 6. SEM photograph of powder at 150× magnification.
Fig. 7. Cristobalite powder PSD, analysis by Malvern MS2000.
particle collisions and forces acting on the particles due to the gas [28]. For this method to be very accurate, every particle has to be taken into account, likewise every particle-particle and particle-wall collisions. Since the calculation time is directly linked to the number of particles simulated, in the specific case studied here, with a particle size less than , more than 1011 particles need to be accounted for. This
ap-proach is clearly impossible to solve with current calculation resources. The Eulerian-Eulerian approach treats particle and fluid p hases a s in-terpenetrating yet separated and continua; although coupled Eulerian transport equations for mass, momentum, and energy are written for both phases. This modeling approach allows the simulation of large fluid-particle s ystems, i ncluding r eactive flow, he at tr ansfers [29,30]
and polydisperse systems [31,32]. In this approach, particles size and inertia are linked to the mesh size: with very small and light particles, calculation time may still be a difficulty to overcome.
Three-dimensional numerical simulations of the fluidized bed were performed using the NEPTUNE_CFD code. This Eulerian n-fluid un-structured parallelized multiphase flow s oftware [ 33] i s d eveloped in the framework of the NEPTUNE project, rallying CEA (Commissariat á l’Energie Atomique), EDF , IRSN (Institut de Radioprotection et de Sûreté Nucléaire), and Framatome. The modeling approach for turbu-lent polydisperse gas-solid flows i s i mplemented b y t he I nstitut de Mécanique des Fluides de Toulouse (IMFT) and the Laboratoire de Génie Chimique (LGC) and has been developed for High Performance Computing [29].
3.1.2. Mathematical models implemented
The mathematical approach used is a hybrid method [34] deriving transport equations by phase ensemble average for the fluid phase and including the effects of the interstitial fluid towards the dispersed phase by the kinetic theory of granular flows [35]. The frictional stress tensor is taken into account in the particle stress tensor using the model pro-posed by Srivastava and Sundaresan [36], with a threshold value for the frictional viscosity activation and a maximal particles compaction of . Transport equations (mass, momentum and fluctuating k inetic e nergy) a re s olved f or e ach p hase a nd coupled through interphase transfer terms. The drag law used is based on two different correlations (Wen and Yu [37] and Ergun [38]) depending on the value of the solid volume fraction [39,40]. The gas flow i s con-sidered as laminar because the variance effects of gas local velocity in the equation of momentum are negligible likened it to the drag term. Finally, , the particle random kinetic energy, is integrated in a transport equation through the solid phase. All mathematical equations are described by Ansart et al. [23].
Geldart-A particles are highly sensitive to the mesh cells size, but a mesh-independent solution based on the bed expansion is possible
[43,44]. A sensitivity study was performed on columns of the same diameter but only of 1 m height. This study was based on the con-vergence of the spatially averaged solid fraction s, depending on the
mesh nodes number on a diameter. For each case,
=
r (nodes on a diameter 1)/D and z= 2 r.Table 1shows the evolution of the solid volume fraction s, spatially averaged over the
bed. As the mesh cells size decreases, the spatially averaged solid vo-lume fraction increases, thus reflecting a bed height decrease. Beyond 80 nodes along the bed diameter, the average solid volume fraction is almost constant (less than 1% variation). Due to computational re-sources, the rest of the study will hence focus on a 80 nodes along the bed diameter mesh. Finally the mesh used for the simulation is built from about 15,000,000 hexahedrons of approximately r=0.63 mm and z=0.89 mm.
3.2.2. Phase properties
The particles used for the simulation were cristobalite silica, flui-dized by air at atmospheric pressure (101325 Pa) and ambient
temperature (298 K). Due to the bed height, the pressure gradient along the tube height cannot be neglected and the gas density cannot be considered as constant but needed to be computed using the perfect gas law. It is noteworthy that cinematic viscosity is automatically computed by the code from density and dynamic viscosity. The initial solid mass in the column for numerical simulations was 5 kg. Phase physical properties used for the simulation are summarized inTable 2.
3.2.3. Boundary conditions
Due to the mesh size, numerical simulations were highly CPU-time consuming and therefore only one intermediary velocity case has been studied. The industrial gas velocity operating range for the UBFB in solar receivers ranges from 7 to 56× Umf, with an average fluidization
velocity of 25 × Umf. The distributor was considered as a horizontal
wall for the particles and an inlet with an imposed uniform superficial velocity for the gas, equals to =U 25×Umf=0.085m s−1. Due to the expansion of the gas flow towards the top of the bed, the superficial gas velocity will increase and close to 30 ×Umf =0.102m s−1. At the top of the fluidized bed, a free outlet for both gas and particles was defined. The same wall-type boundary condition was applied for both the par-ticles at the distributor, and for both phases at the side walls: this condition involves no-slip for velocity, and zero-flux for random kinetic energy for the solid phase, corresponding to a large wall roughness or a high non-sphericity of the particles[45]. It is noteworthy that no-slip boundary condition was assumed over partial-slip boundary condition due to the lack of tube roughness measurement and thus the im-possibility to accurately justify for a value of the models friction and bouncing parameters. In addition, the no-slip boundary condition, considering elastic frictionless bouncing at the walls, and thus with a particle-to-wall restitution coefficientew=1, was found to be in good agreement with PEPT experimental measurements for dense fluidized beds[45].
3.2.4. Simulation procedure
Numerical simulations have been carried out on 700 parallelized cores. Classically, to post-treat and analyze results from instantaneous numerical simulation, calculations on long physical times (> 100 s) are needed in order to extract converged temporal averages of simulated physical quantities. But for this simulation, jointly due to the very high fluctuation induced by the crossing of slugs, the tube height and the slug velocity, physical times of more than 500 s would be needed to achieve converged statistic time average, which would represent months of calculation. Consequently, new post-treatments were devel-oped, focusing on their convergence speed. Every calculation hence followed a three-step scheme, where the first 20 seconds account for a transitory regime, including the initial bed destabilization; a 30 seconds of hydrodynamic transition to complete fluidization; and finally, a 50 seconds calculation allows to extract instantaneous variables for each mesh cell at a 20 Hz frequency. This time delay is certainly sufficient, since the axi-symetric slug velocity is around 0.4 m s−1and with a
frequency of ~0.5 to 1 Hz according to Kong et al.[1]. The time step was adaptive and calculated in order to respect a Courant-Friedrish-Levy and a Fourier condition inferior to 1 and 10 respectively. The convergence criterion was calculated through the sum of every volume
Fig. 8. 3D mesh for the numerical simulation 15,000,000 cells.
Table 1
Instantaneous solid volume fraction sat =t 60 s, spatially averaged within a
vertical slice from =z 0to =z 50 cm.
nodes number on the tube diameter 60 70 80 90 spatially averaged solid fraction s 0.282 0.288 0.295 0.297
Table 2
Phases properties used for the numerical simulation (air and powder).
Gas density at = P 101.3 kPa and =T 298 K Gas dynamic viscosity Absolute particle density Particle median volume diameter, d50 Drag diameter, ddrag kS kN Particle-particle restitution coefficient, ec Frictional viscosity activation threshold, s min, Maximal particles compaction, s max, kg m−3 Pa s kg m−3 μm μm 1.1847 1.85 × 10⁻⁵ 2640 73.3 45 1.5 4 0.9 0.55 0.64
< i
max (1 ( ))
i ncel k s vol, where i is a given cell
within the whole domain ncel and volis set to10 8. The partial
differ-ential equations are discretized with a second-order centered scheme and the solution is time-advanced by a first order scheme. The nu-merical methods used by NEPTUNE_CFD are further described by Ha-midouche et al.[29]and Neau et al.[46].
4. Results and discussion 4.1. Experimental results 4.1.1. Slug description
The slug frequency, as determined by high speed camera, varies with the considered level in a bed of given total height, as illustrated in
Fig. 9using the average values obtained by imaging and pressure drop measurements. Combining earlier literature findings [47–49], Kong et al.[1]proposed equations for the slug frequency, fs, the slug length,
Ls, and the slug intervals,Ws. Essential equations are repeated hereafter.
= f U U L s mf s (3) = L U U kD g ( ) (0.35 or 0.7) s mf 1/2 1/2 (4)
Substituting(4)in (3)assumingWs=kD, andUs=0.35(gD)1/2 for
axi-symmetric, or =Us 0.7(gD)1/2for wall slugs[1]gives
= f g kD (0.35 or 0.7) s 1/2 1/2 (5)
The slug frequency is independent of the gas velocity, as confirmed by the experiments, and the constant k must be experimentally de-termined. Average slug frequencies were determined and were illu-strated inFig. 9.
Frequencies level off for bed levels exceeding 100 to 150 cm, and axi-symmetric slugs start to form at heights exceeding approximately 150 cm. For bed levels above~1 m, when wall slugs are completely formed, fsis independent of L and about 1 Hz. The data obtained are
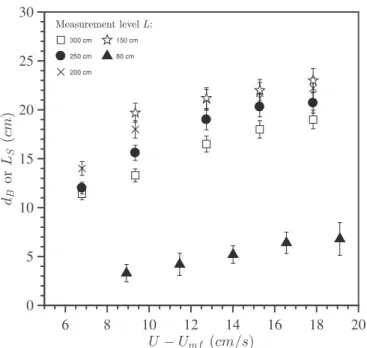
~30%higher than proposed earlier by Baeyens and Geldart[2]. For axi-symmetric slugs, the equilibrium slug frequency is 0.5 Hz. The slug length is a nearly linear function of U Umf, as illustrated for the
ex-perimental measurements in Fig. 10, and corresponds with the pre-diction of Eq.(4). Wall slug lengths of 2 to ~15 cm were imaged at specific levels in the bed and for a given excess air flow rate. Axi-symmetric slugs with length of over 15 cm were imaged at bed levels in excess of 1.5 m and higher values of U Umf.
The level in the bed clearly determines the slug length at a given
U Umf, and slug growth continues along the level in the bed by
fur-ther coalescence. From the image analysis, the slug velocity was also determined and plotted inFig. 11.
The bubble or slug velocities increase slightly with excess gas ve-locity, irrespective of the level in the bed when exceeding 0.8 m. The measured slug velocities correspond with the theoretical prediction of the wall-slugging regime, as indicated in the Figure caption. At lower levels in the bed, wall slugs transform into axi-symmetric slugs with velocities according to the appropriate equation, at higher U Umf
values.
When the level in the bed exceeds 1.5 m, slug velocities dropped to ~0.3 to 0.4 m s−1, corresponding to axi-symmetric slugs, as calculated
from:
= +
Us (U Umf) 0.35 gD (6)
4.1.2. Solids fraction
The bubble fraction B, the bed voidage and the solids fraction
= (1 )
p were calculated from the experimental results and are
presented in Figs. 12 and 13, respectively. The bubble fraction was calculated from the bed expansion data ( =B 1 Hmf/H). The bed
so-lids fraction was determined from the measured pressure drop across the bed ( P=[ (1s )gH]). The bubble fraction in the bed is con-siderably higher than that for group B powders (expected < 0.1), and the expanded bed is characterized by a fairly low solids fraction[1,12]. Both values are important in calculations of e.g. the heat transfer coefficient where a surface renewal model strongly depends upon both
pand B. Heat transfer measurements and its modeling are the subject
of ongoing research.
Fig. 9. Bubble and/or slug frequency, f (s−1) versus level of measurement in
the bed atU Umf=12.7cm s−1. Regimes: freely bubbling, wall slugging and transition to axi-symmetric slugging, axi-symmetric slugging; fwsand fas:
expected frequency limits for wall slugging and for axi-symmetric slugging, respectively.
Fig. 10. Illustration of bubble diameters or slug lengths at different excess gas
velocities for cristobalite, measured at different bed levels in a bed of =
Hmf 300 cm.
fraction according to
4.2. Comparison with simulation results 4.2.1. Pressure gradient along the bed height
In order to validate the simulation results, the pressure drop across the bed was compared with the experimental results at U Umf
0.099 m s−1. It was found to average to solid fraction of s= 0.29, in
fair agreement with experimental results of Fig. 13( s 0.33), sidering the inaccuracy of measuring P across the bed when con-siderable fluctuations occur due to slugging. The slug frequency is shown to be independent of the excess air velocity. Since the volumetric excess gas flow rate equals the product of slug frequency and slug vo-lume, the slug length for a constant frequency and slug diameter (~tube
diameter), will slightly increase from the onset height to the top of the bed: the hydrostatic pressure indeed decreases with bed height, and the
air expands from 1.47 kg m 3at the bottom of the bed to 1.18 kg m 3at
the top. The air superficial velocity hence increases from25× Umf at the
distributor to30× Umf at the top of the bed, meaning that the slug
length will increase by maximum 20% towards the top of the bed.
4.2.2. Bed height fluctuations ( P)/ P
In the same way as for experiments, the pressure fluctuations were monitored just above the distributor and the ratio of pressure fluctua-tion to total pressure drop was determined. This ratio was predicted to be 0.06 against the experimentally measured 0.065 at
U Umf 0.099m s−1(Fig. 5). Pressure fluctuations above 5% meet the criterion of Leva et al.[27]for the onset of slugging.
4.2.3. Spatially averaged instantaneous solid volume fraction along the bed, z t
( , )
s
As explained before, new post-treatments had to be developed to avoid convergence issues as found with standard physical quantities’ horizontal profiles. Thus, the instantaneous solid volume fraction
r z t
( , , , )
s was spatially averaged over cylindrical slices defined along
the vertical z axis, with their diameter equal to the tube I.D. and with a vertical span of about 9.55 mm.Fig. 14illustrates the evolution of this spatially averaged solid fraction s( , )z t along the tube height, at a
given time =t 71.9 s. Similar results have been obtained for several time steps but for clarity only this single simulation time is presented. From the bottom to the top of the tube, two patterns are distinguish-able, an initial unstructured small fluctuation corresponding to bub-bling flow, followed by stronger isolated peaks highlighting the pre-sence of large bubbles or slugs. In order to filter out bubbling flow, a threshold value, based on a simplified bubble-emulsion model and
=
dB 0.66Dwas set as a criterion for the onset of slugging[1], and
de-fined sslugs= 0.22as a maximum solid volume fraction for slug
detec-tion. The calculation leading to the value of sslugsis detailed in Eq.(7), whereVslice and hslice account for the volume and the height of the
considered slice, respectively.
= V h d + h d =
V
( /4) 0.3 /4
0.22
s s slice slice B slice B
slice
2 2
slug (7)
Several peaks under the threshold value highlight the presence of slugs after50 cmbed height and are in good agreement with experi-mental results.
Fig. 11. Slug velocity versus U Umf, measured at different bed levels in a bed
of Hmf =300 cm. Uws=(U Umf)+0.7 gD and
= +
Uas (U Umf) 0.35 gD.
Fig. 12. Illustration of the average bubble fraction Bversus U Umfin a bed of
= Hmf 300 cm.
Fig. 13. Calculated average solids fraction, p= (1 ) in a bed of =
Fig. 15displays the solid volume fraction instantaneous field. Three different views of 70 cm length are represented at different bed levels. The incipient unstructured bubbling at the bottom of the tube ( ) is progressively coalescing along the tube, being replaced by local larger dilute structures ( ), occupying almost the entire tube diameter and therefore related to slugging. Finally , higher up the bed, the dilute structures become longer. Although slugging is clearly predicted, it is yet impossible to distinguish wall and axi-symmetric slugs by the si-mulation.
4.2.4. Spatio-temporal map of the spatially averaged solid volume fraction, z t
( , )
s
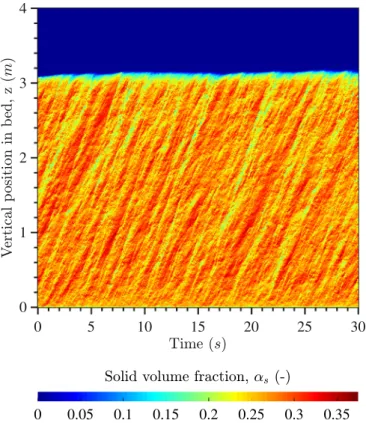
Due to the slugging periodicity, the temporal evolution of the solid fraction in a cylindrical slice was studied. Fig. 16represents the de-pendence of the aforementioned spatially averaged solid fraction
z t ( , )
s , on both vertical position and time.
A clear fringe pattern evolving periodically along the bed is visible. Considering slugs as a progressive wave propagation along the bed, their vertical velocity was measured graphically with a value of 0.4 m s−1, in good agreement with experimental results for
axi-sym-metric slugging. In addition, the fringe pattern only appears after a first random region of 0.3 to 0.5 m at the bottom of the bed corresponding to the experimental height for the onset of slugging.
4.2.5. Temporal Fast Fourier Transform of the spatially averaged solid volume fraction at different heights,FFT[ ( )]( )s t z
Since slugs can be considered as a periodic wave propagation in the
Fig. 14. Instantaneous profile of the spatially averaged solid fraction along the
vertical axis z, at =t 71.9 s.
Fig. 15. Instantaneous field of the solid volume fraction at =t 71.9 s.
Fig. 16. Instantaneous map of the spatially averaged solid fraction along the
•
At the bed bottom (0.1 m), the signal is very random with no dis-tinctive frequency, due to the freely bubbling bed behavior and a wide span of bubble sizes and velocities due to bubble coalescence.•
At 1.0 m height, the amplitude of frequencies below 1.8 Hz is higher than lower in the bed, with a similar superimposed random signal as before: bubbles have coalesced but smaller bubbles continue to co-incide with larger ones.•
At3.0 mheight, the high amplitude frequencies zone is now under 1 Hz, with stronger peaks, however with a background signal of higher frequencies due to the presence of small bubbles in between slugs.After the onset on slugging, a higher amplitude zone emerges due to slugs crossing the studied bed level. Bubbles however remain to form a background signal. In line with the experimental results the frequency tends to decrease between1 mand 3 m height. Furthermore, the tem-poral and spatial 2D Fast Fourier Transform of the spatially averaged solid fraction was performed leading to similar results as aforemen-tioned. In addition, considering slugging as a progressive wave, their vertical velocity was computed multiplying their frequency by their wave number leading once again to a velocity close to 0.4 m s−1, in
good agreement with experimental results for axi-symmetric slugging.
4.2.6. Final assessment of the NEPTUNE_CFD simulation
NEPTUNE_CFD was found to be able to reproduce accurately the bed expansion (pressure drop along the bed and thus the bed height). In addition, large diluted structures related to slugging were successfully predicted, and in good agreement with experimental results concerning their onset height within the bed. Their rise velocity and frequency was found to be of the same order of magnitude as experimental results for axi-symmetric slugs. No wall slugging, with a higher occurrence fre-quency and higher rise velocity, was distinguishable. The discrepancy
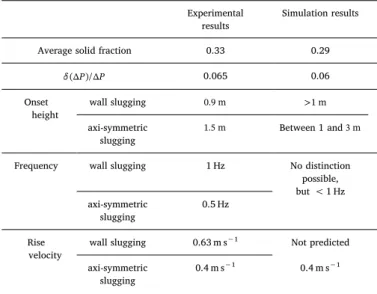
on ( P)/ P (0.06 against 0.065) is also directly linked to the slug shape. Bigger slugs, as found during experiments, would induce larger pressure drop fluctuations when bursting at the top of the bed. The differences and agreements between experiments and simulation results are summarized inTable 3.
Although experimental and simulation results are in fair agreement, additional improvements are required and in order to enhance the slug description in numerical simulation, several numerical parameters were studied. Fede et al.[45], Goldschmidt et al.[50]have shown that a decrease of particle-particle coefficientec trends to increase the
for-mation of bubbles and the suspension heterogeneity. In the present study, a decrease ofec from 0.9 to 0.7 allowed to keep the same slug
velocity and frequency, but did not significantly improve the slugs characteristics, and trends to decrease slightly the total bed height.
Fig. 17. FFT of the spatially averaged solid fraction s( , )z t at three different heights ( =z 0.1 m,z=1 mand =z 3 m).
Table 3
Comparison of experimental and simulation results, at =U 25×Umf.
Experimental
results Simulation results Average solid fraction 0.33 0.29
P P
( )/ 0.065 0.06
Onset
height wall slugging
0.9 m >1 m
axi-symmetric slugging
1.5 m Between 1 and 3 m
Frequency wall slugging 1 Hz No distinction possible, but < 1 Hz axi-symmetric
slugging 0.5 Hz Rise
velocity wall slugging 0.63 m s
−1 Not predicted
axi-symmetric
slugging 0.4 m s
−1 0.4 m s−1
solid fraction value along the vertical axis z, the frequency analysis of the spatially averaged solid fraction value was performed at different levels in the bed by computing its Fast Fourier Transform (FFT). Fig. 17
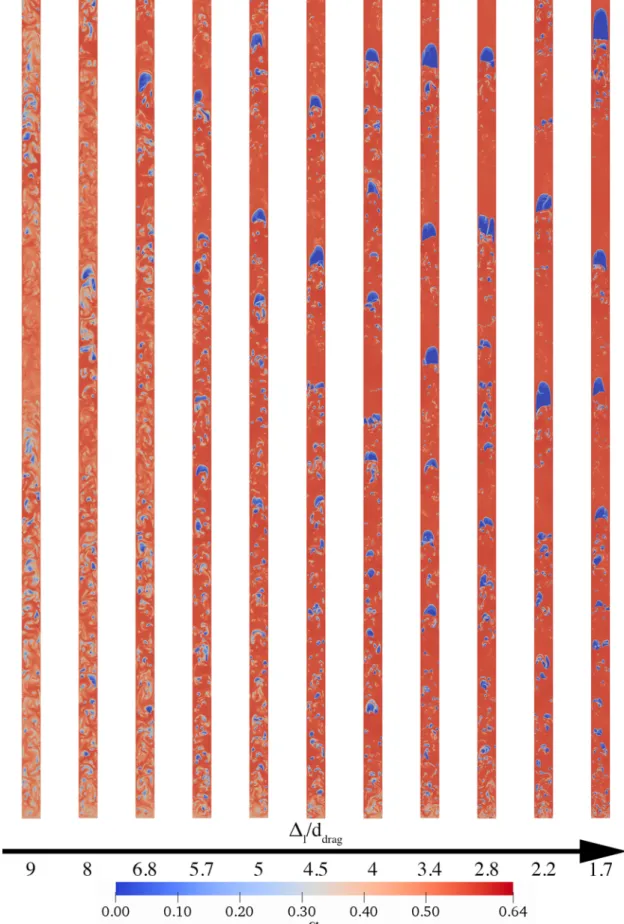
Fig. 18. Study on the impact of the mesh refinement onto slugs description: 2D simulations of a 2 m height geometry, instantaneous field of the solid fraction at the
× d 9 to 1.7 drag × d 14 drag × d 9 up to 5 drag × d 5 and~2 drag 5. Conclusions
Experimental results and simulations implementing an Eulerian n-fluid approach were compared in order to better understand the flow behavior of Geldart group A particles in small I.D. tube within the frame of an Upflow Bubbling Fluidized Bed. Experiments have indicated that the onset height for wall slugs is around1 m, which is then followed for bed height exceeding 1.5 m by axi-symmetric slugs. The slugging fre-quency was found to be independent of the gas velocity. Due to both the low velocity and length of axi-symmetric slugs, it is of paramount im-portance to be able to predict, and thus avoid their formation. Indeed, the presence of axi-symmetric slug has a strong impact on the suspen-sion heat transfer coefficient, in particular within the frame of the solar receiver particle-in-tube concept. 3D simulations were performed using ultra fine mesh of more than 15,000,000 cells. Because of characteristic time of slugging phenomenon, classical post-treatments based time averaged physical quantities have been replaced in favor of new post-treatments necessitating less calculation time to converge. Simulation results were found to be in good agreement with experiments con-cerning the bed average solid volume fraction and successfully reflect the formation of large bubbles structures, hence highlighting the cap-ability of the NEPTUNE_CFD code to simulate such particles flow.
The onset height of slugging was in fairly good agreement with experimental results but simulation was unable to distinct wall slugging from axi-symmetric slugging. In addition, the slug description in nu-merical simulation results is not as obvious as with experimental re-sults.
Preliminary simulations, carried out with NEPTUNE_CFD in 2D, highligted the effect of a strong mesh refinement (beyond the minimum cells size for a converged bed height) over slugs prediction. Slugs with size and shape corresponding to experimental observations were pre-dicted for mesh cell size around × d2 drag for the studied powder.
However, this cells size cannot be suitable for industrial geometries and
thus the development of subgrid models is essential for an accurate representation of slugging regimes of Geldart group A particles.
Finally, Kong et al.[1]tentatively predicted a delay of slugging to deeper bed heights when operating at higher temperatures. Experi-ments and simulations at higher temperatures up to 475 °C are in the process of being examined.
Acknowledgments
This work was supported by the European Union’s Horizon 2020 research and innovation program under Grant Agreement 727762, project Next-CSP. Additional funding was obtained from Beijing Advanced Innovation Center for Soft Matter Science and Engineering of the Beijing University of Chemical Technology. This work was granted access to the HPC resources of CALMIP under the allocation P1132 and of CINES under the allocation gct6938 made by GENCI.
References
[1] W. Kong, T. Tan, J. Baeyens, G. Flamant, H. Zhang, Bubbling and slugging of Geldart Group A powders in small diameter columns, Ind. Eng. Chem. Res. 56 (2017) 4136–4144.
[2] J. Baeyens, D. Geldart, An investigation into slugging fluidized beds, Chem. Eng. Sci. 29 (1974) 255–265.
[3] D. Geldart, Gas Fluidization Technology, John Wiley & Sons Ltd., Chichester, U.K., 1986.
[4] J. Baeyens, D. Geldart, S.Y. Wu, Elutriation of fines from gas fluidized beds of Geldart A-type powders ’ effect of adding superfines, Powder Technol. 71 (1992) 71–80.
[5] D. Kunii, O. Levenspiel, Fluidization Engineering, second ed., Butterworth-Heinemann, Boston, 1991.
[6] W. Kong, B. Wang, J. Baeyens, S. Li, H. Ke, T. Tan, Solids mixing in a shallow cross-flow bubbling fluidized bed, Chem. Eng. Sci. (2018).
[7] Q. Kang, J. Baeyens, H. Zhang, Energy analysis of a particle suspension solar combined cycle power plant, Energy Convers. Manage. 613 (2018) 292–303. [8] H. Zhang, W. Kong, T. Tan, F. Gilles, J. Baeyens, Experiments support an improved
model for particle transport in fluidized beds, Scientific Rep. 7 (2017) 10178. [9] H. Zhang, H. Benoit, I. Perez-Lopez, G. Flamant, T. Tan, J. Baeyens, High-efficiency
solar power towers using particle suspensions as heat carrier and thermal energy storage, Renew. Energy 111 (2017) 438–446.
[10] H.L. Zhang, T. Gowing, J. Degrève, T. Leadbeater, J. Baeyens, The use of particle heat carriers in the Stirling engine concept, Energy Technol. (2016).
[11] H. Zhang, H. Benoit, D. Gauthier, J. Degrève, J. Baeyens, I.P. López, M. Hemati, G. Flamant, Particle circulation loops in solar energy capture and storage: gas-solid flow and heat transfer considerations, Appl. Energy 161 (2016) 206–224. [12] J. Baeyens, S.Y. Wu, Bed expansion and the visible bubble flow rate in gas fluidized
beds, Adv. Powder Technol. 3 (1992) 163–189.
[13] J. Baeyens, D. Geldart, Modelling approach to the effect of equipment scale on fluidized bed heat transfer data, J. Powder Bulk Solids Technol. 4 (1980) 1–9. [14] J.M. Valverde, M.A. Quintanilla, A. Castellanos, D. Lepek, J. Quevedo, R.N. Dave,
R. Pfeffer, Fluidization of fine and ultrafine particles using nitrogen and neon as fluidizing gases, AIChE J. 54 (2008) 86–103.
[15] M. Ye, J. Wang, M.A. van der Hoef, H. Kuipers, Two-fluid modeling of Geldart A particles in gas-fluidized beds, Particuology 6 (2008) 540–548.
[16] H.L. Zhang, J. Degrève, R. Dewil, J. Baeyens, Operation diagram of circulating fluidized beds (CFBs), Proc. Eng. 102 (2015) 1092–1103.
[17] F. Pitie, C.Y. Zhao, J. Baeyens, J. Degrève, H.L. Zhang, Circulating fluidized bed heat recovery/storage and its potential to use coated phase-change-material (PCM) particles, Appl. Energy 109 (2013).
[18] C.W. Chan, J.P.K. Seville, D.J. Parker, J. Baeyens, Particle velocities and their re-sidence time distribution in the riser of a CFB, Powder Technol. 203 (2010) 187–197.
[19] H. Zhang, W. Kong, T. Tan, J. Baeyens, High-efficiency concentrated solar power plants need appropriate materials for high-temperature heat capture, conveying and storage, Energy 139 (2017) 52–64.
[20] G. Flamant, D. Gauthier, H. Benoit, J.L. Sans, R. Garcia, B. Boissière, R. Ansart, M. Hemati, Dense suspension of solid particles as a new heat transfer fluid for concentrated solar thermal plants: on-sun proof of concept, Chem. Eng. Sci. 102 (2013) 567–576.
[21] I. Perez-Lopèz, H. Benoit, D. Gauthier, J.-L. Sans, E. Guillot, G. Mazza, G. Flamant, On-sun operation of a 150kWth pilot solar receiver using dense particle suspension as heat transfer fluid, Sol. Energy 137 (2016) 463–476.
[22] Torresol Energy, Gemasolar, 2015.
[23] R. Ansart, P. García-Triñanes, B. Boissière, H. Benoit, J.P.K. Seville, O. Simonin, Dense gas-particle suspension upward flow used as heat transfer fluid in solar re-ceiver: PEPT experiments and 3D numerical simulations, Powder Technol. 307 (2017) 25–36.
[24] D. Geldart, J. Baeyens, The design of distributors for gas-fluidized beds, Powder Technol. 42 (1985) 67–78.
[25] I. Cavarretta, C. O’Sullivan, M.R. Coop, Applying 2D shape analysis techniques to
Then, various authors have shown that the particles-wall boundary conditions may have an effect o n b ubbles s tructures, b ed h eight and flow i nternal b ehavior [ 51]. R esults d epicted i n t his s tudy h ave been based on a no-slip boundary condition (corresponding to maximum of friction) and elastic particle-wall bouncing. In contrast, the other ex-treme boundary condition, the free-slip wall boundary conditions (pure elastic frictionless rebounds of spherical particles on a flat w all) has been tested, resulting in a strong diminution of bed height as observed by Fede et al. [45], and without any improvement on slug description. A comprehensive study was carried out on extremely refined me-shes, with cells size from . Since 3D simulations with such a fine mesh cell size are currently impossible to be achieved for in an industrial geometry, these tests were performed in 2D over a 2 m height high fluidized bed of 0.03 m I.D., with multiple cartesian grids. The 3D simulation previously performed corresponds to a cell size of about . Within the studied cell size range, the bed height re-mained constant but the local flow structure of the particle suspension was substantially modified, according to Fig. 18. Only the bottom 1.3 m of the beds has been represented for clarity reasons. From a cell size of , the suspension heterogeneity was emphasised, which allowed for the formation of increasingly larger bubbles structures, but without clearly showing the presence of axi-symmetric slugging. For cell size between however, the suspension hetero-geneity kept increasing, showing the formation of slugs with size and shape corresponding to the experimental observations. These extremely refined meshes enabled to capture mesostructures responsible for slug formation. Finally, the transposition of this mesh cell size to the 3D, 4 m high, experimentally studied geometry, would require a ~4,300,000,000 cell mesh. It is noteworthy that more than just in-creasing the cell number, the cell size reduction would also imply a time-step duration reduction in order to respect equations resolution stability criteria.
granular materials with 3D particle geometries, in: AIP Conference Proceedings, vol. 1145, pp. 833–836.
[26] G.-C. Cho, J. Dodds, J.C. Santamarina, Particle shape effects on packing density, stiffness, and strength: natural and crushed sands, J. Geotech. Geoenviron. Eng. 132 (2006) 591–602.
[27] M. Leva, M. Weintraub, M. Grummer, M. Pollchik, H.H. Storch, Fluid Flow Through Packed and Fluidized Systems, (Bulletin. Bureau of Mines), U.S. Government Printing Office, 1951.
[28] J. Xie, W. Zhong, B. Jin, Y. Shao, Y. Huang, Eulerian-Lagrangian method for three-dimensional simulation of fluidized bed coal gasification, Adv. Powder Technol. 24 (2013) 382–392.
[29] Z. Hamidouche, E. Masi, P. Fede, R. Ansart, H. Neau, M. Hemati, O. Simonin, Numerical Simulation of Multiphase Reactive Flows, in: Advances in Chemical Engineering, vol. 52, 2018, pp. 51–124.
[30] H. Benoit, R. Ansart, H. Neau, P. Garcia Triñanes, G. Flamant, O. Simonin, Three-dimensional numerical simulation of upflow bubbling fluidized bed in opaque tube under high flux solar heating, AIChE J. 64 (2018) 3857–3867.
[31] F. Fotovat, R. Ansart, M. Hemati, O. Simonin, J. Chaouki, Sand-assisted fluidization of large cylindrical and spherical biomass particles: experiments and simulation, Chem. Eng. Sci. 126 (2015) 543–559.
[32] P. Fede, O. Simonin, I. Ghouila, 3D Numerical Simulation of Polydisperse Pressurized Gas-Solid Fluidized Bed, in: ASME-JSME-KSME 2011 Joint Fluids Engineering Conference, 44403, pp. 3199–3210.
[33] N. Méchitoua, M. Boucker, J. Laviéville, S. Pigny, G. Serre, An unstructured finite volume solver for two phase water/vapour flows based on an elliptic oriented fractional step method, in: NURETH 10, Seoul, South Korea.
[34] S. Morioka, T. Nakajima, Modeling of gas and solid particles two-phase flow and application to fluidized bed, J. Theor. Appl. Mech. 6 (1987) 77–78.
[35] A. Boelle, G. Balzer, O. Simonin, Second-order prediction of the particle-phase stress tensor of inelastic spheres in simple shear dense suspensions, ASME-Publications-Fed 228 (1995) 9–18.
[36] A. Srivastava, S. Sundaresan, Analysis of a frictional-kinetic model for gas-particle flow, Powder Technol. 129 (2003) 72–85.
[37] C. Wen, Y. Yu, Mechanics of fluidization, Chem. Eng. Symp. Ser. 62 (1965) 100–111.
[38] S. Ergun, Fluid flow through packed columns, Chem. Eng. Prog. 48 (1952) 89–94.
[39] A. Gobin, H. Neau, O. Simonin, J.-R. Llinas, V. Reiling, J.-L. Sélo, Fluid dynamic numerical simulation of a gas phase polymerization reactor, Int. J. Numer. Meth. Fluids 43 (2003) 1199–1220.
[40] O. Simonin, S. Chevrier, F. Audard, P. Fede, Drag force modelling in dilute to dense particle-laden flows with mono-disperse or binary mixture of solid particles, in: 9th International Conference on Multiphase Flow.
[41] F. Sabatier, A. Renaud, W. Kong, H. Zhang, J. Baeyens, G. Flamant, O. Simonin, Bubbling of Geldart Group A Powders in Small Diameter Columns: Experiments and 3D Numerical Simulations focussing on the particle size distribution and non sphericity, in: World Congress on Particle Technology VIII, Orlando, FL. [42] G.H. Bagheri, C. Bonadonna, On the drag of freely falling non-spherical particles,
Powder Technol. 301 (2016) 526–544.
[43] K. Agrawal, P.N. Loezos, M. Syamlal, S. Sundaresan, The role of meso-scale struc-tures in rapid gas-solid flows, J. Fluid Mech. 445 (2001) 151–185.
[44] J.-F. Parmentier, O. Simonin, O. Delsart, A functional subgrid drift velocity model for filtered drag prediction in dense fluidized bed, AIChE J. 58 (2012) 1084–1098. [45] P. Fede, O. Simonin, A. Ingram, 3D numerical simulation of a lab-scale pressurized dense fluidized bed focussing on the effect of the particle-particle restitution coef-ficient and particle-wall boundary conditions, Chem. Eng. Sci. 142 (2016) 215–235. [46] H. Neau, J. Laviéville, O. Simonin, NEPTUNE_CFD High Parallel Computing
Performances for Particle-Laden Reactive Flows, in: 7th International Conference on Multiphase Flow, Tampa, FL.
[47] J. Werther, Hydrodynamics and mass transfer between the bubble and emulsion phases in fluidized beds of sand and cracking catalyst, Proc. 4th Int Conf. On Fluidization (1983) 93–101.
[48] R. Yamazaki, M. Nakajima, N. Ueda, G. Jimbo, Fluidization’85 Science and Technology (1985).
[49] A.W. Weimer, G.J. Quarderer, On dense phase voidage and bubble size in high pressure fluidized beds of fine powders, AIChE J. 31 (1985) 1019–1028. [50] M.J. Goldschmidt, J.A. Kuipers, W.P. Van Swaaij, Hydrodynamic modelling of
dense gas-fluidised beds using the kinetic theory of granular flow: effect of coeffi-cient of restitution on bed dynamics, Chem. Eng. Sci. 56 (2001) 571–578. [51] S. Benyahia, M. Syamlal, T.J. O’Brien, Evaluation of boundary conditions used to
model dilute, turbulent gas/solids flows in a pipe, Powder Technol. 156 (2005) 62–72.

![Fig. 2. Schematics of a solar tower combined cycle generation process [7].](https://thumb-eu.123doks.com/thumbv2/123doknet/14256077.488775/5.892.189.703.699.1090/fig-schematics-solar-tower-combined-cycle-generation-process.webp)