Publisher’s version / Version de l'éditeur:
Noise Control Engineering Journal, 37, 1, pp. 37-44, 1991
READ THESE TERMS AND CONDITIONS CAREFULLY BEFORE USING THIS WEBSITE. https://nrc-publications.canada.ca/eng/copyright
Vous avez des questions? Nous pouvons vous aider. Pour communiquer directement avec un auteur, consultez la première page de la revue dans laquelle son article a été publié afin de trouver ses coordonnées. Si vous n’arrivez pas à les repérer, communiquez avec nous à [email protected].
Questions? Contact the NRC Publications Archive team at
[email protected]. If you wish to email the authors directly, please see the first page of the publication for their contact information.
NRC Publications Archive
Archives des publications du CNRC
This publication could be one of several versions: author’s original, accepted manuscript or the publisher’s version. / La version de cette publication peut être l’une des suivantes : la version prépublication de l’auteur, la version acceptée du manuscrit ou la version de l’éditeur.
Access and use of this website and the material on it are subject to the Terms and Conditions set forth at
Impedance tube measurements : a comparative study of current
practices
Chu, W. T.
https://publications-cnrc.canada.ca/fra/droits
L’accès à ce site Web et l’utilisation de son contenu sont assujettis aux conditions présentées dans le site LISEZ CES CONDITIONS ATTENTIVEMENT AVANT D’UTILISER CE SITE WEB.
NRC Publications Record / Notice d'Archives des publications de CNRC:
https://nrc-publications.canada.ca/eng/view/object/?id=6f6bd8e1-138e-4af3-a04f-9880f60a6def https://publications-cnrc.canada.ca/fra/voir/objet/?id=6f6bd8e1-138e-4af3-a04f-9880f60a6def
Impedance tube measurements: a
comparative study of current
practices
Chu, W.T.
NRCC-33102
A version of this document is published ins :Noise Control Engineering Journal, 37, (1), pp. 37-44, 1991
The material in this document is covered by the provisions of the Copyright Act, by Canadian laws, policies, regulations and international agreements. Such provisions serve to identify the information source and, in specific instances, to prohibit reproduction of materials without written permission. For more information visit http://laws.justice.gc.ca/en/showtdm/cs/C-42
Les renseignements dans ce document sont protégés par la Loi sur le droit d’auteur, par les lois, les politiques et les règlements du Canada et des accords internationaux. Ces dispositions permettent d’identifier la source de l’information et, dans certains cas, d’interdire la copie de documents sans permission écrite. Pour obtenir de plus amples renseignements : http://lois.justice.gc.ca/fr/showtdm/cs/C-42
Impedance Tube Measurements
A Comparative
Study
of Current
Practices*
-WT. Chu
Acoustics Section, Institute for Research in Construction, National Research Council of Canada, Ottawa, Ontario, KlA OR6, Canada
*Received: 28 November 1990; revised: 25 Aprill991
Several methods presently exist for obtaining acoustical measurements of materials using an
impedance tube. Three methods which offer both accuracy and convenience were chosen for
this study. A brief summary of the theories of these methods and a comparative experimental
study of them using the same apparatus and testing materials are presented to show their
relative merits.
Introduction
The tube method based on measuring the standing wave ratio (SWR) for specific acoustic impedance measurements is well known. An account of the different extrapolation proce-dures for the SWR method, including a new proposal, has been given by Kathuriya and MunjaJ.l Although these procedures b:r:ive very accurate results, they are tedious and time-consum-ing. In Ref. 2, the author proposed a faster procedure that uses
an iteration scheme based on the sound pressure
measure-ments at a minimum pressure location and one other point and called it the improved standing wave ratio (ISWR) method.
Another approach to improving the SWR method, as sug-gested by Kathuriya and Munjal, involves measuring the sound pressure at three or more points (not necessarily the minimum or maximum pressure-locations).JA However, the technique had certain .inherent difficulties and weaknesses.' The remedy proposed in Ref. 5 requires locating two minimum pressure points for determining the phase angle of the reflection coeffi-cient. The magnitude is then obtained by sound pressure mea-surements at a few other points. This approach might not seem to be too attractive for measurements in a stationary medium, nonetheless, it remains a convenient. measurement method for duct acoustics involving fluid flow.
A number of alternatives to the SWR method have been proposed and summarized by Singh.' Of particular interest to
absorption and impedance measurements of acoustical materi-als has been the two-microphone transfer function (TF) method introduced by Seybert and Ross and further developed by Chung and Blaser. 7•6 The TF method has now been
stan-dardized as ASTM E 1050 without consideration of the effect of tube attenuation.' In Ref. 10, the author extended the TF formulation to include the tube attenuation.' The TF method has also been extended to include the effect of mean flow for duct and muffler applications by Chung and Blaser and M. Abom and H. Boden.U·" In Ref. 13, M.L. Munjal and A.G. Doige considered both effects simultaneously. The outcome il-lustrates that the TF method is a special case of a more general procedure, the multi-point least-square (LS) method proposed by Fujimori, Sato, and Miura.14 Both methods offer very
signif-icant savings in time if deterministic signals such as a pure tone or a broadband pseudorandom sequence are used.L5- 111 Another advantage is that conventional standing wave tubes with a sin-gle traversing probe-tube microphone can be used without modification since the sound pressures at the different loca-tions can be measured sequentially. Phase matched micro-phones or elaborate calibration procedures are not required.
In Ref. 18, the author found through experiment that for precise measurements with the TF method, a pure-tone excita-tion should be used with properly .chosen microphone
loca-Nセセセ@
tions. His recommendation is that one of the microphone posi-tions should be close to a minimum pressure point of the stand-ing wave pattern and that the choice of the other point is not critical a11 long as the separation is not close to a h3.lf wave-length. However, recent theoretical investigations of Boden and Abom and Banks-Lee and Peng suggest one-quarter wave-length as the optimum separation of the microphones to mini-mize the effect of errors in the measured input data.19·20 VVe will
label this special application of the TF method the improved transfer function (ITF) method.
A brief account of the least-square method, the transfer function methods, and the improved standing wave ratio method for measurements in a stationary medium together with an experimental study of their performances will be pre-sented in this paper. Measurement with flow is outside the scope of this paper and will not be considered here.
Theoretical Background
For the readers' convenience, a short review of the relevant formulas of the methods will be given here. Those who are in-terested in the details can refer to the cited references. At any driving frequency
w,
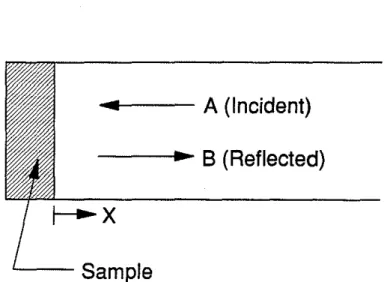
the complex acoustic pressure of the one-dimensional acoustic field vvithin an impedance tube at a loca-tion x can be expressed by:P =(A e1x
+
B e--'fX)e'"" (1)where A and B are the complex amplitudes of the incident and the reflected waves, respectively (Fig. 1). The propagation con-stant is yand for small attenuation, yis given by:
y=iOJ!c+a (2)
where cis the speed of sound and a is the attenuation constant. The procedure proposed by Fujimori and his colleagnes is to cutve fit the complex pressures at a number of locations vvith the standing wave pattern ofEq. (1) using the least-square (LS) method. 1
" The attenuation constant is assumed known and the
complex reflection coefficient, R, is given by:
11:
elY+ r:l'nr.r
eroxn"
B ke(r-r hn kP e-roxn
R =-=
"
(3)A
IEP
eY''1:
e-ir-r'hnI
" "
k p e-r"xn r.e-(}'1-yo)xn
-
"
where (1 signifies complex conjugate and the summations are
performed over the index n of the measurement locations. As pointed out by Pope, the above formulation may be re-duced to that of the transfer function (TF) technique. when only two locations are used." That is, Eq. (3) can be reduced to:
(4)
38
where H12 ::::: P2/P1 is the complex transfer function, sis the ュゥセ@
crophone separation, and L is the distance of the first
micro-phone from the sample according to the convention of Ref. 8. Without the tube attenuation terms, the TF formulation can easily be reduced to that of the conventional standing wave ratio (SWR) method if the two points chosen coincide with the minimum and the maximum pressure points. Otherwise, the exact phase formulation has to be rederived from Eq. (1).
A (Incident)
MMセ@
..
セ@B
(Reflected)
L--Sample
Figure 1. Sound field in the impeda11ce tube
The improved standing wave ratio (ISWR) method proposed
by the author uses an iteration scheme based on the exact plane wave analysis of the standing wave pattern in the t,ube. 2 Starting from Eq. (1), it can be shown that:
and
IP m;,l2
_ e"'d
+
IRI2e-"'"
+
2 IRI cos(2kd-<p)IPj2' -
e"''+
IRI2e-2a.,+
21RI cos ('ikx-<p) (6)where IRI and <p are the magnitude and phase of the complex reflection coefficient, R, respectively, and dis the distance from the surface of the sample to the mth pressure minimum. The wavenumber is
k
= role. Assuming that the tube attenuation is known, two sound pressure measurements (at the minimum and one other point) are all that is required for solving both IRIand <p of Eqs. (5) and (6). A detailed account of the iteration
procedure is given in Ref. 2 or the appendix of Ref. 18. Similar to the improved transfer function (ITF) method, the two points should not be close to a half wavelength.20
Although only pure-tone excitation can be used for the ISWR .and the ITF methods, both pure-tone and broad-band excitation can be used for the TF and the LS methods.
Apparatus and Test Procedures
In this study, both pure-tone and broad-band excitation were used. For the latter, a deterministic broad-band signal was used so that the same sequential sampling technique of sound pres-sure at different locations using a single microphone can be ap-plied for the complete experimental investigation without the requirement of phase matched microphones or other elaborate calibration procedures.16 Although the data acquisition instru-mentations were different for the two types of signals, the same impedance tube apparatus under identical conditions was used. The impedance tube is a 107-cm-long brass tube with an inter-nal diameter, D, of 5. 72 em, giving an upper frequency limit of 2500 Hz. With a wall thickness of 0.47 em, the tube is suffi-ciently massive and rigid. The tube was driven by a hom driver mounted on the side to allow a probe-tube microphone to
tra-verse the center line. The microphone used was a 6.4 mm
Briiel & Kjaer condenser microphone. No unwanted vibra-tional problem was detected when the system was excited by a slowly sweeping sine wave from 100 to 2500 Hz. A thermistor with a digital thermometer was used to monitor the inside tem-perature of the tube for the calculation of the sound speed. The attenuation constant was set at 2.2032
..Jj
I cD, as suggested inRef. 21.
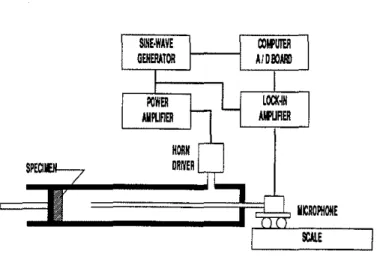
Figure 2 shows the measurement system for pure-tone exci-tation. An HP 3325A function generator was used to provide a very stable sine wave for the experiment. The magnitude and phase of the acoustic pressure at different locations were mea-sured sequentially with an Ithaca Dynatrac 3 lock-in amplifier using the driving signal as the reference. The lock-in amplifier has a 0.1 deg resolution for the phase measurements. The de-outputs that correspond to the magnitude and phase informa-tions from the lock-in amplifier were sampled by a 12 bit AID
converter and the computations were performed with special Fortran programs on an IBM AT-compatible microcomputer.
Figure 3 depicts the arrangement for broad-band excitation. A periodic random sequence was used as a deterministic
broad-band signal so that the complex acoustic pressures at dif-ferent locations could also be measured sequentially with the traversing microphone. In this case, the magnitude and phase of the acoustic pressure as a function of frequency could be de-termined in one single measurement using digital signal analy-sis from one period of the microphone signal. Detailed discus-sion about this signal and the required digital processing technique can be found in Refs. 22 and 23. Although the tech-nique is not sensitive to external electrical or acoustical
back-ground noise because of the cross-correlation procedure
in-volving the driving and the microphone signals in the digital signal processing, ten averages have been used at each micro-phone location to provide additional improvement of the signal to noise ratio. Since the sequential sampling technique used in the present investigation relies on the assumption that the sys-tem remains unchanged during the experiment, it is imporiant that the standing wave field be sampled in the shortest possible time. Thus it is not advisable to take too many unnecessary av-erages. For the present experiments, an IBM AT-compatible microcomputer was used together with an AID board
(Mi-Volume 37/Number 1
croWay A2D-160), which has a built-in sequence generator and a software package written in assembly language for com-puting the magnitude and phase of the complex acoustic pres-sures. The graphic equalizer wa' used to reduce the adverse
ef-fect of the tube resonances and provide a more uniform
response over the frequency range.
Four specimens were used in this comparative study. The first specimen was the hard reflecting surface of a 1.27 ern thick Bakelite disk. it was chosen as a calibrating device for the ex-periment as the reflection coefficient is known to be real and equal to 1. The second specimen was a 4.9 em thick open cell plastic foam. The il1ird specimen was a dense carpet with a 5 mm thick pile. TI1e fourth specimen was a resonant absorber consisting of a 9 mm thick perforated plate backed by a 35 rnm air space. The plate has three 3.2 mm diameter holes arranged at the corners of a 33 mm side equilateral triangle. No particu-lar attention has been paid to the details of the mounting of the specimen in this investigation since we were only interested in the relative repeatability of the results using different tech-niques on the same specimen. However, it is important to fol-low the mounting procedure recommended by the standards for accurate acoustical measurements of absorptive
materi-als. 9,21
セneᄋwave@
GEHERATOR
Figure 2. Apparatus for pure-tone excitation experiments
Figure 3. Apparatus for broad-band excitation experiments
Results and Discussions
Pure-Tone Excitation. Figure 4 summarizes the results of five different investigations with the hard reflecting surface using pure-tone excitation at fifteen 1/3-octave center
frequen-cies. The five cases are:
(1) improved standing wave ratio (ISWR) method;
(2) improved transfer function (ITF) method with one mi-crophone position near a minimum pressure point and the other 0.24 wavelength apart;
(3) fixed least-square (FLS) method using three fixed posi-tions, 6, 9, and 12.1 em from the specimen surface; (4) semi-improved least-square (SILS) method using three
positions, with two positions separated by a half-wave-length and one other position; and
(5) improved least-square (ILS) method using three posi-tions, with two positions separated by a half-wavelength and the third position at the minimum pressure point.
0 . 0 6 l l i
---;:::---;:==::;-]
セ@
O.Mセセ@
i\ (•)
セ@
セ@
0.02I \
L\
j \. .. \···.. .
_1\§_1
0.00MᄋサZセZjL@
.
セ
W@
セZZ@
..
セNMZZZ@
.. -,:;, ... _;,:, ..
セNセセMl@
... ...
:
\.
/
:
··.,.:
....
-...
-0.02 L....:· •• ._· - - ' - - - ' - - - ' - - - - ' - - - - ' - - . . . l 1 00 200 300 500 1000 2000 3000Frequency, Hz
QP[MMセMMMMMMMMMMMMMML@j :,
t'
セ@
:
./
\.
(b)セ@
ᄋセ@ 0 ··•·· ... セ@ 0l ...
'2 MTセMMセMセMNNNャGMMMセMMMGMMMj@ 1 00 200 300 500 1000 2000 3000Frequency, Hz
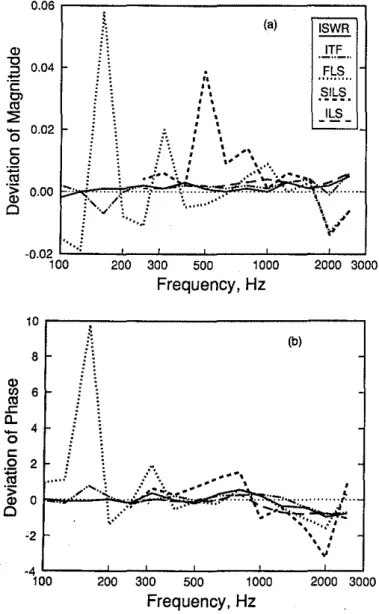
Figure 4. Deviation from theoretical values for the magnitude and
phase of the complex reflection coefficient of o hard reflecting surface measured by different rrwthock using pure-tone excitation
40
In Fig. 4, deviations in both magnitude and phase of the complex reflection coefficient, R, from the known values of the hard reflecting surface were plotted for the five different cases. Results indicate that both the ISWR (solid curve) and ITF (chain-dotted curve) methods give very precise results with pure-tone excitation.
The accuracy of the LS method depends upon the positions chosen, as shown by the results of the three different applica-tions of this method. The worst case involved an arbitrary choice of the microphone positions; see the dotted curve of the FLS case. It is interesting to note that even when two of the po-sitions are separated by a half-wavelength, the results are accu-rate if the third point is chosen at the pressure minimum posi-tion; see the long dashed curve of the ILS method. The length of the tube limits the low frequencies to 250 Hz for both the ILS and the SILS methods. The short dashed curve of the SILS method indicates that the results became less precise if the third point is chosen at a location other than the minimum pressure point.
Without this half-wavelength restriction, the least-square method can perform better than the transfer function method for broad-band excitation applications, as confirmed by results presented in the next section. For pure-tone excitation, it offers no advantage over the improved transfer function method.
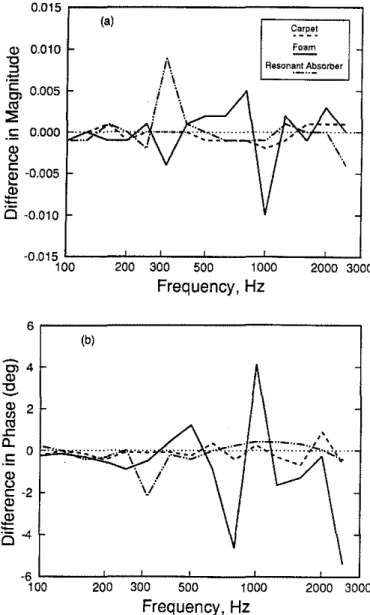
Figure 5 shows the differences in magnitude and phase of the complex reflection coefficients, R, of the other three speci-mens measured by the improved standing wave ratio method and the improved transfer function method. There is very little difference in the measured magnitude and phase of R except at frequencies around the peak resonant absorption of the foam and the resonant absorber specimens; see Figs. 7 and 8 of the next section for the acoustical characteristics of these speci-mens. More than one degree difference in the measured phases of R was observed. However, these phase differences did not translate into significant differences in the computed normal specific acoustic impedance ratios, Z, as shown in Fig. 6 for the foam specimen. In Fig. 6, the solid circles represent re-sults of the ISWR method and the open squares represent those of the ITF method. Also, they have no effect on the com-puted absorption coefficient which depends only on the magni-tude of R.
With our experimental set-up, it would take more than 60 minutes to perform the standard SWR method for fifteen dis-crete frequencies. The time was reduced to about 20 minutes for the improved SWR method and 15 minutes for the im-proved transfer function method.
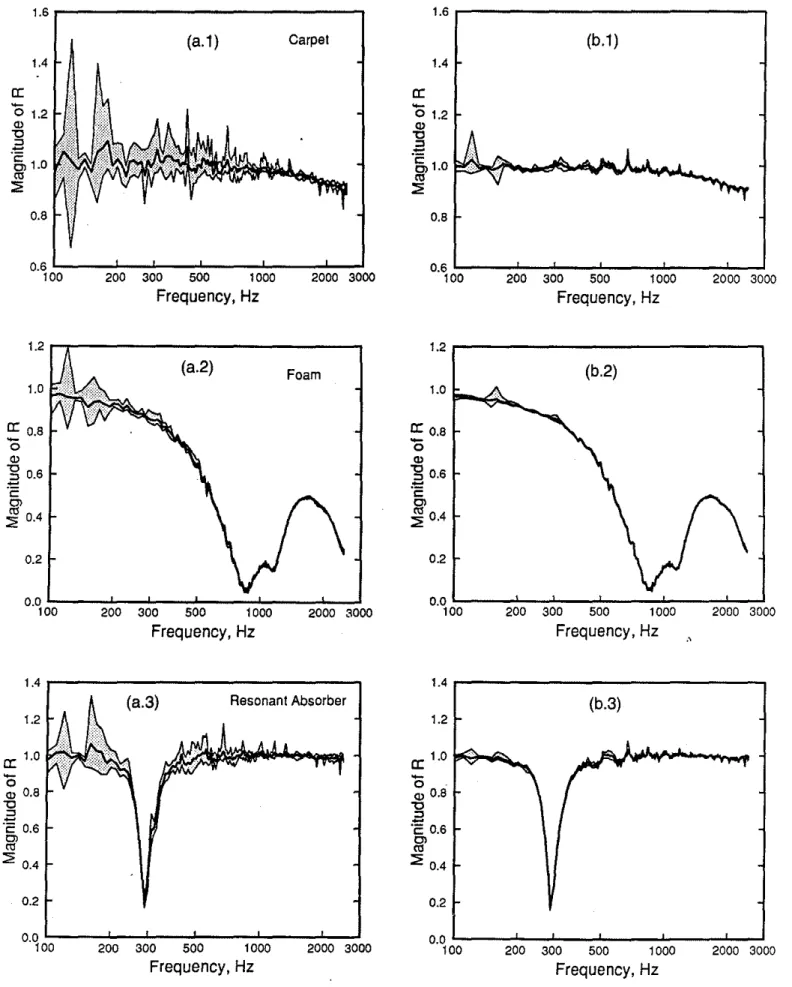
Broad-Band Excitation. Fignre 7(a) shows the magnitude of
the reflection coefficient, R, of three specimens obtained by the two point transfer function method using broad-band exci-tation. The solid curve depicts the average value from seven sets of measurements with different microphone positions and the shaded area shows the range of results at different frequen-cies from 100 to 2500 Hz with a fixed frequency resolution of lO Hz. The choice of the microphone positions was somewhat arbitrary except that the separation of each pair was less than 6.8 em (half-wavelength at 2500Hz). The actual values are tab-ulated in Table I. Theoretical analysis of Refs. 19 and 20 and
perimental results of Refs. 16 and 18 indicate that it is not pos-sible to find a single pair of microphone positions to cover the whole frequency range with the same accuracy. This is certainly an inherent weakness of the ASTM E1050 standard.
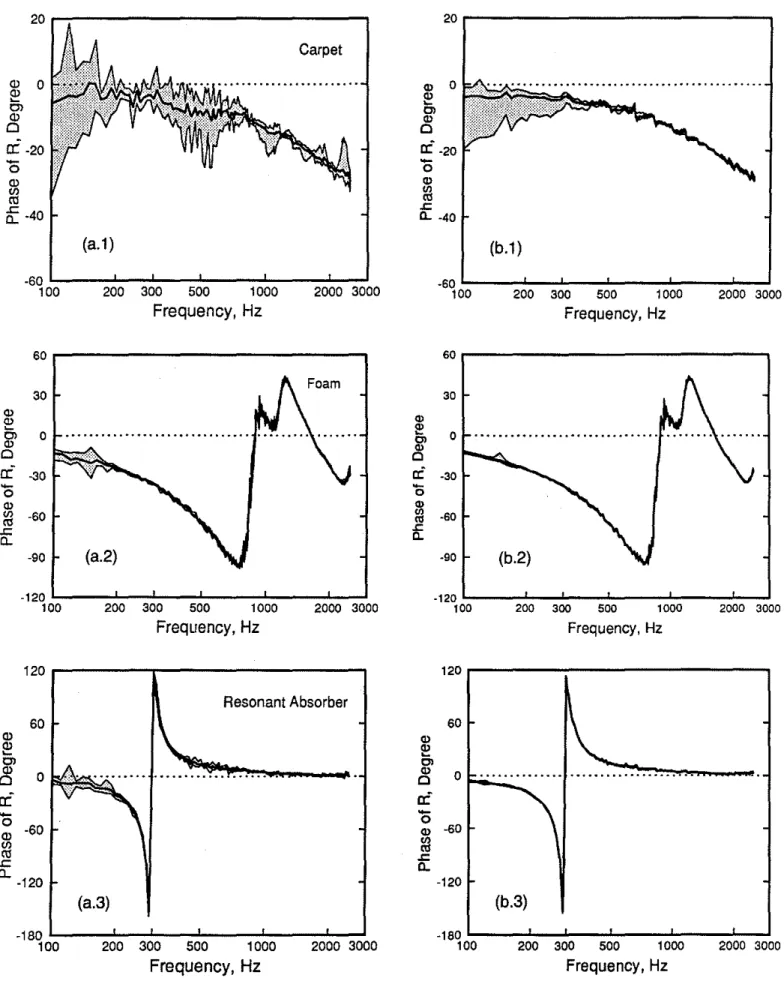
A similar plot of results obtained by the least-square method using seven sets of seven positions each is shown in Fig. 7(b). The choice of the microphone positions was also arbitrary here. However, there is no half-wavelength restriction for this case. The actual positions used are tabulated in Table I. Comparison of these two sets of results shows that, with broad-band excita-tion, the LS method is better than the TF method since the LS results showed less scatter between different runs. This is sup-ported by additional phase results of R shown in Figs. S(a) and (b). Although not presented here, the computed standard devi-ations for both the magnitude and phase from the seven sets of
セ@ 0.015
r--;.;---;====:::::;l
(a) セセ・L・A@ 0.010 Foamil
Resonant Absorber 0.005 I!\
I! \
-0.015 L - - - - ' - - ' - - - ' - - - - ' - - - - ' - - - 1 1 00 200 300 500 1000 2000 3000Frequency, Hz
6,---.
(b) Cl4 Q):s.
Q) 2セ@
.c
a.
.Eセ@
c: -22:
セT@
MウlMMMMMセセMMセセMMMMlMMMMMlMセ@ 1 00 200 300 500 1000 2000 3000Frequency, Hz
Figure 5. Differences in magnitude and phase of the complex reflection coefficient of three different specirnens measured by the improved standing wave ratio method and the improved transfer function method using pure-tone excitation
Volume37/Number 1
measurements show much lower values for the LS method, es-pecially at low frequencies from 100 to 500Hz. With our exper-imental set-up, it took less than 2 minutes to perform one set of the two-point transfer function measurement and slightly more for one set of the seven-point least-square method measure-ment at 241 frequencies.
1n general, results obtained by the least-square method com-pared well with those obtained by the improved standing wave ratio or the improved transfer function methods for acoustical materials with high absorption. For comparison, the computed normal specific acoustic impedance ratios, Z, of the foam spec-imen from the average magnitude and phase of R has been plotted in Fig. 6; see the chain-dotted curve. The agreements with results obtained by the ISWR and ITF methods are good except at frequencies below 200 Hz where the absorption is
セ@
Q)a:
セ@ N'E
3.5 3.0Foam
2.5 2.0 1.5 t-1.0 0.5....
. I/
\
\
(a)セ@
\
|セ@
0.0 L---'---"--'---'---.L-...1 1 00 200 300 500 1000 2000 3000 2.0 0.0 -2.0 -4.0 -6.0 -8.0Frequency, Hz
(b)..
セMMセ@ ... y··· -· '• )i セO@ /J!
,/
/l
/
.•..
_./-·"'
...
'-
..
-· ISWR•
ITF 0 LS -10.0 ' : - - - : - " : : - - : - ' - : : - - - : - ' - - - ' : - - - ' - - ' 1 00 200 300 500 1 000 2000 3000Frequency, Hz
Figure 6. Comparison of normal specific acoustic impedance ratio, Z,
obtained by three different methods: solid circles
=
improved standing wave ratio method with pure·tone excitation; open squares = im· proved transfer function with pure-tone excitation; chain·dotted curve= least-square method with broad-band excitation
1 . 6 . . . - - - . 1.4
a:
0
1.2"'
"C ::J-·c:
CJ1.0"'
:2 0.8(a.1)
Carpet 0.6 L---.l-...J'----'----'---....1...--l 100 200 300 500 I 000 2000 3000Frequency, Hz
1.2 ... - - - .(a.2)
Foam 1.0a:
0.8-
0"'
-g
0.6-·c:
g>
:2 0.4 0.2 200 300 1000 2000 3000Frequency, Hz
1.4 . - - - . 1.2a:
1.0-
0 "' 0.8 "C ::J·2
0.6g>
:2 0.4 0.2 Resonant Absorber 0.0 .._ _ _ NNNNNN⦅⦅NNNNNN⦅⦅NNNNNセ@ _ _ _ .._ _ _ NNNNNN⦅⦅⦅Nセ@ 100 200 300 500 1000 2000 3000Frequency, Hz
1.6 . . - - - ,(b.1)
1.4a:
0.8 0.6 ..._ _ _ .._...J.___.._ _ _ ..._ _ _ ..J...J 100 200 300 500 1000 2000 3000Frequency, Hz
1.2 . - - - ,(b.2)
a:
0.8-
0"'
-g
0.6'"'
c:g>
:2 0.4 0.2 0.0 L_ _ _ ..__...__..._ _ _ _._ _ _ NNNNNN⦅⦅⦅Nセ@ I 00 200 300 500 1000 2000 3000Frequency, Hz
·'
1.4 . - - - , 1.2-
0 "' 0.8 "Ca
·c:
0.6g>
:2 0.4 0.2(b.3)
"" i .•
' 0.0 . _ _ _ ...___...__...__ _ _ _._ _ _ ...___, 1 00 200 300 500 1 000 2000 3000Frequency, Hz
Figure 7. Comparison of the magnitude of the complex reflection coef-ficient of three different specimens detennineil by (a) the transfer func-tion method and (b) the least-square method using broad-band excita-tion; solid curoe =average result; shaded area = range
20 Q) 0 Q) セ@ 0> Q) 0
a:
-200
Q) (/)co
.c a__ -40(a.1)
-60 100 200 60 30 Q) Q) セ@ 0> Q) 0 0a:
-30-
0 Q) (/) -60 ro .c a__ -90 -120 100 200 Carpet...
300 500 1000 2000 3000Frequency, Hz
300 500 1000 2000 3000Frequency, Hz
2 0 r - - - , Q) 0E!
C> Q)c
a:
-20-
0"'
gj
.ca..
-40(b.1)
-60 セMMMZMMGMZMNNNNNjGMMZMMGMZMMMMZMZGZMZMMMMMMZMセMMMG@ 1 00 200 300 500 1 000 2000 3000Frequency, Hz
30.,
!!!l
0a:
-30 -90 -120 L...---'---'---''---'---1.-...1 100 200 300 500 1000 2000 3000 Frequency, Hz QRPイMMMMMMMMNセMMMMMMMMMMMMMMMMMML@ QRPイMMMMMセMMMMMMMMMMMMMMMMMML@ 60 Q) e:?セ@
0lA:....---··
a:
0
Q) -60セ@
.c a__ -120v
(a.3)
Resonant Absorber"'
E!
C>"'
0a:
0
60 0 セ@ -60 .ca..
-120...
セ|セMMMMMMMセ@
...
,...,.,.,.,...-
-(b.3)
-180 L---L---1-.--...1---'---...J..--..J -180 . _ _ _ NNN⦅⦅セNM⦅NNNコ⦅@__ _._ __
_J._...J 1 00 200 300 500 1 000 2000 3000 1 00 200 300 500 1 000 2000 3000 Volume 37/Number IFrequency, Hz
Frequency, Hz
Figure 8. Comparison of the pha.se of the complex reflection coefficient of three different specimens determined by (a) the transfer function m£thod and (b) the lea.st-square m£thod using broad-band
excitation.-solid curve = average result; shaded area = range
TABLE I
MICROPHONE PosmoNS USED IN THE Two-POINT TRANSFER FUNCTION METHOD AND THE SEVEN-POINT,
LEAST-SQUARE METHOD* , . c;,.;', '· '
2Point :- -:-
MMスセ@
Set No. TF Method 7 Point LS Method
1 5.9 9.7 6.0 8.0 9.5 11.0 12.7 15.0 18.5 2 6.7 10.9 6.5 9.0 13.0 16.3 27.0 41.0 55.0 3 7.2 12.4 7.0 10.5 14.5 17.8 32.0 45.0)>7.0 4 20.7 26.0 20.0 22.0 24.4 27.5 29.3 32.6 35:0 5 22.5 27.2 21.0 23.0 26.3 3L5 37.5 42.7 55.0 6 30.5 36.2 30.0 33.0 37.2 40.5 44.0 47.T 51.2 7 41.5 47.0 40.0 43.5 48.0 53.0 58.2 63.5 68.0
*Distances, given in em, were measured from the surface ッヲエセ・」M
.
specimen.
'
-·---·i,
low. Figure 7(b) shows that, for
very
low absorption, themea-sured magnitude of the reflection coefficient, R, incorrectly
ex-ceeded the value of 1 at a number of frequencies for both the
carpet and the resonant absorber specimens.
Conclusion
The comparative study reported here shows that the im-proved transfer function method with pure-tone excitation is a
simple and
very
precise method for impedance tubemeasure-ments provided that the microphone positions are properly chosen for each individual frequency: one close to a pressure minimum point and the other approximately a
quarter-wave-length apart. It is better than the standing wave ratio method or
its improved version because it does not require locating a min-imum pressure point exactly.
With broad-band excitation, the least-square method using a number of positions (around seven) offers a quick but slightly less accurate way of determining the absorption properties of materials at many frequencies. Besides being more accurate, it is superior to the two microphone transfer function method be-cause there is no half-wavelength limitation in choosing the mi-crophone positions. Because of the quarter wavelength re-quirement for optimum microphone separations, the broad-band excitation methods will always be less accurate than the pure-tone excitation techniques.
References
I. M.L. Kathuriya and M.L. Munjal, "Accurate Method for the Ex-perimental Evaluation of the Acoustical Impedance of a Black Box," Journal of the Acoustical Society of America, 58 (2), pp.
TUQMTセT@ (1975).
2. W.T. Chu, "An Improved Tube Method for Acoustic Measure· ment," Division of Building Research, National Research Council of Canada, BRN No. 113, (1977).
3. M.L. Kathuriya and M.L. Munjal, "A Method for the Evaluation
of the Acoustic Impedance of a Black Box at Low Frequencies
44
Using a Shorter Impedance Tube," Journal of the Acoustical sッ」ゥセ@
ety of America, 62 (3), pp. 751-754 (1977).
4. M.L. Kathuriya and M.L. Munjal, "A Method for the Evaluation of the Acoustic Impedance of a Black Box with or without Mean Flow Measuring Pressures at fixed Positions," Journal of the
Acoustical Society of America, 62 (3), pp. 755-759 (1977). 5. V.B. Panicker and M.L. Munjal, "Impedance Tube Technology for
. Flow Acoustics," journal of Sound and Vibration, 77 ( 4), pp. 573-577 (1981).
6. R. Singh, "Acoustic Impedance Measurement Methods," Shock
and Vibration Digest, 14 (2), pp. 3-9 (1982).
7. A.F. Seybert and D.F. Ross, "Experimental Determination of
Acoustic Properties Using a Two-Microphone r。ョ、ッュセ@ Excitation
Technique," Journal of the Acoustical Society of America, 61 (5)
pp. 1362-1310 (1977). .
8. J.Y. Chung and D.A. Blaser, "Transfer Function Method of
Mea-suring In-Duct Acoustic Properties: I. Theory, II. Experiment,"
journal of the Acoustical Society of America, 68 (3), pp. 907-921 (1980).
9. "Standard Test Method for Impedance and Absorption of a」ッオウセ@
tical Materials Using a Tube, Two Microphones, and a Digital Frequency Analysis System," ASTM E1050-90.
10. W.T. Chu, "Extension of the 1\vo-Microphone Transfer Function Method for Impedance Tube Measurements," Journal of the
Acoustical Society of America, 80 (1), pp. 347-348 (1986). 1 L J.Y. Chung and D.A. Blaser, "Transfer Function Method of
Mea-suring Acoustic Intensity in a Duct System with Flow," fournal of
the Acoustical Socieltj of America, 68 (3), 1570-1577 ( !!l80).
12. M. Abom and H. Boden, "Error Analysis of tキッセmゥ」イッーィッョ・@
Measurements in Ducts with Flow," foumal of the Acoustical
So-ciety of America, 83 (6), pp. RTRYMRTNセX@ (1988).
13. M.L. Munjal and A. G. Doige, 'The Two-Microphone Method In-corporating the Effects of-Mean Flow and Acoustic Damping,"
Journal of Sound and Vibration, 137 (!), pp. 135-138 (1990). 14. T. Fujimori, S. Sato and H. Miura, "An Automated Measurement
System of Complex Sound Pressure Reflection Coefficients," pイッセ@
ceedings of the International Conference on Noise Control eョァゥセ@
neering, G.C. Maling, Jr., Ed. (Institute of Noise Control Engi-neering, Poughkeepsie, NY, 1984), pp. 1009-1014.
15. F.J. Fahy, "Rapid Method for the Measurement of Sample Acous-tic Impedance in a Standing Wave Tube," Journal of Sound and
Vibration, 97 (!), pp. 168-170 (1984).
16. W.T. Chu, "Transfer Function Technique for Impedance and a「セ@
sorption Measurements in an Impedance Tube Using a Single mゥセ@
crophone," journal of the Acoustical Society of America, 80 (2), pp. 555-560 (1986).
17.
J.
Pope, "Rapid Measurement of Acoustic Impedance Using aSingle Microphone in a Standing Wave Tube," 12th ICA, Paper M3-3, (1986).
18. W.'f. Chu, "Further Experimental Studies on the tイ。ョウヲ・イMfオョ」セ@
tion Technique for Impedance Tube Measurements," fournal of
the Acoustical Society of America, 83 (6), pp. 2255-2260 (1988). 19. H. Boden and M. Abom, "Influence of Errors on the Two-Microw
phone Method for Measuring Acoustic Properties in Ducts,"
journal of the Acoustical Society of America, 83 (6), pp. 2429-2438 (1988).
20. P. Banks-Lee and H. Peng, Bl・ョセ@ Error Analysis forlmpedance
Tube Measurements," Tournai o the Acoustical Society Of aュ・イセ@
lea, 85 (4), pp.1769-1172 (1989.
21. "Standard Test Method for Impedance and Absor;ption of Acous-tical Materials by the Impedance Tube Method, ASTM C384-90a.
22. W.T. Chu, ''A Detenninistic bイッ。、セ@ Band Signal for Acoustical
Meruurements," Proceedings of the International Conference on
Noise Control Engineering, Li Pei-zi, Ed. (Institute of :Noise cッョセ@ trol Engineering, Poughkeepsie, NY, 1987), pp. 1199-1202 (1987).
23. W.T. Chu, "Impulse Response and Reverberation Decay m・。セ@
surements Made by Using a Periodic Pseudorandom Sequence,"
Applied Acoustics, 29, pp. 193-205 (1990).