HAL Id: hal-02350184
https://hal.archives-ouvertes.fr/hal-02350184
Submitted on 18 Nov 2020HAL is a multi-disciplinary open access archive for the deposit and dissemination of sci-entific research documents, whether they are pub-lished or not. The documents may come from teaching and research institutions in France or abroad, or from public or private research centers.
L’archive ouverte pluridisciplinaire HAL, est destinée au dépôt et à la diffusion de documents scientifiques de niveau recherche, publiés ou non, émanant des établissements d’enseignement et de recherche français ou étrangers, des laboratoires publics ou privés.
Experimental characterization of the dynamics of IDPs
and IDRs by NMR
Nicolas Bolik-coulon, Guillaume Bouvignies, Ludovic Carlier, Fabien Ferrage
To cite this version:
Nicolas Bolik-coulon, Guillaume Bouvignies, Ludovic Carlier, Fabien Ferrage. Experimental charac-terization of the dynamics of IDPs and IDRs by NMR. Intrinsically Disordered Proteins, Elsevier, pp.65-92, 2019, �10.1016/B978-0-12-816348-1.00003-X�. �hal-02350184�
Experimental characterization of the dynamics of IDPs and IDRs by NMR Nicolas Bolik-Coulon, Guillaume Bouvignies,* Ludovic Carlier, Fabien Ferrage*
Laboratoire des biomolécules, LBM, Département de chimie, École normale supérieure, PSL University, Sorbonne Université, CNRS, 75005 Paris, France
Fabien.Ferrage@ens.fr Guillaume.Bouvignies@ens.fr Abstract:
Nuclear Magnetic Resonance is a unique approach to obtain at the same time information on dynamics over a broad range of timescales and high-resolution information in disordered proteins. In this chapter, we will review the different methods available to characterize motions in disordered proteins. We first focus on dynamics in the picosecond-nanosecond range, which is characterized by nuclear spin relaxation measurements. We will focus then on slower processes, mostly in the millisecond range, studied by chemical-exchange NMR, discussing in particular the dynamics of the binding of disordered proteins to their targets and their dynamics in these complexes.
Table of Contents
1. Adapting the toolbox: comparison of NMR investigations of folded and disordered
proteins ... 3
2. Determining motions in IDRs and IDPs in the picosecond-nanosecond range ... 4
2.1. Nuclear spin relaxation to probe ps-ns motions ... 4
2.2. Measurement of longitudinal auto- and cross-relaxation ... 6
2.3. Transverse relaxation measurements ... 8
2.4. Cross-correlated relaxation measurements ... 9
2.5. Models to interpret ps-ns motions in IDRs and IDPs ... 10
2.6. Comparison with molecular dynamics simulations ... 13
3. Microsecond-millisecond motions in IDPs and IDRs: binding ... 14
3.1. Investigating binding of IDPs with titrations. ... 14
3.1.1. Atomic resolution of the interaction and model of binding ... 15
3.1.2. Extracting thermodynamics and kinetics information from NMR titration experiments ... 17
3.2. Investigations of binding mechanisms with chemical-exchange NMR ... 18
3.3. Other methods to characterize ps-ns dynamics in complexes of IDPs and IDRs bound states ... 25
3.4. Amide proton exchange: from false positives to insightful information ... 26
1. Adapting the toolbox: comparison of NMR investigations of folded and
disordered proteins
Nuclear magnetic resonance has proven to be a unique tool to study the dynamics of biological macromolecules at atomic resolution. The entire protein NMR toolbox has been developed over about three decades for applications on folded proteins. We can consider that a folded protein is defined by a representative conformation, while additional conformational states can be represented as perturbations to this representative structure. On the other hand, intrinsically disordered proteins (IDPs) and regions (IDRs) have emerged over the last two decades as proteins with an extremely broad conformational space and detectable structural features are a limited restriction of their conformational space. With little doubt, the dynamics of proteins, defined by the mechanistic paths of exploration of the conformational space and the timescales of this exploration, differ drastically between folded and disordered proteins.
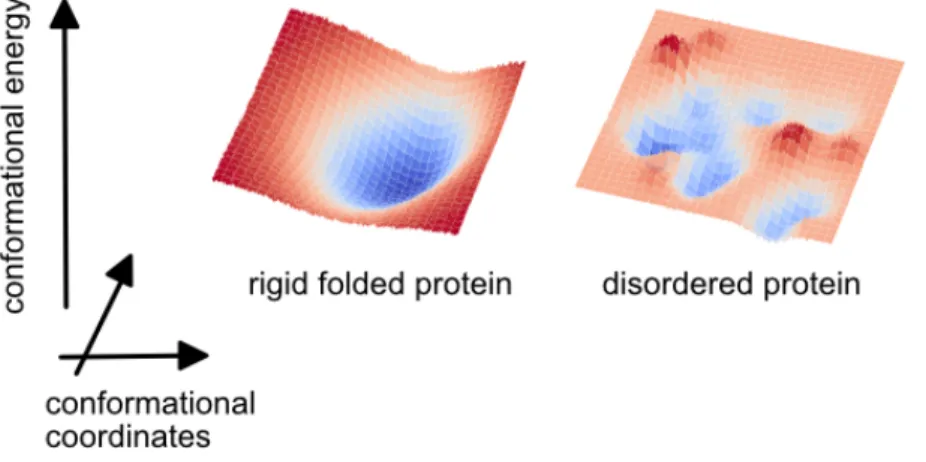
Figure 1. Schematic representation of the conformational energy profiles of a rigid folded protein and an intrinsically disordered protein.
As can be seen in Figure 1, many more conformational states can be populated in disordered proteins and there are many more mechanistic pathways between these conformational states. A first clear consequence is that the models of motions routinely used to interpret NMR experiments in folded proteins are often ill-suited to describe dynamics in disordered proteins. For instance, the measurement and analysis of NMR relaxation rates provides direct information on motions in proteins on picosecond to nanosecond timescales. Yet, with the exception of short disordered regions in mostly folded proteins, it is generally impossible to define an overall rotational diffusion tensor and distinguish overall and internal motions in IDPs. Another clear difference between folded and disordered proteins relates to slower
motions on micro- to second timescales. The conformational energy surface of folded proteins can often be represented to the first order by a single and relatively deep minimum. Very frequently, additional conformational states can be accessed if they are not too far off in energy: hence many methods, based on the exploitation of chemical exchange, have been developed over the years to characterize such excited states of proteins, as well as the kinetics and thermodynamics of their exploration. Interestingly, the exploration of the main conformational space of IDPs is generally faster than the microsecond and slower timescales that give rise to chemical exchange. In the presence of many states accessible with such low barriers and similar energies, these systems are associated with a very large partition function. Thus, excited states in IDPs, with an energy higher by a few kT, are expected to have a relative population at a low level, well below detection limits. Thus, chemical- exchange methods have not been successful at exploring intrinsic excited states in IDPs. On the other hand, these methods are of utmost importance to study engineered excited states of proteins: the state of a disordered protein bound to a partner (often a folded domain), in exchange with a dominant free state.
Another important difference of disordered proteins, as compared to folded proteins, is the constant solvent accessibility of all sites in the protein. In particular, labile amide protons from the backbone in IDPs are accessible to the solvent and hydrogen bonded to water molecules. Thus, amide proton exchange is much more prevalent in IDPs than in folded proteins. Although this is an insightful property, this exchange is often degrading the accuracy and precision of experiments that were designed for folded proteins with limited exchange of amide protons with the solvent.
2. Determining motions in IDRs and IDPs in the picosecond-nanosecond range
2.1. Nuclear spin relaxation to probe ps-ns motionsThe irreversible evolution of the spin system towards equilibrium originates in the fluctuation of interactions at the molecular scale. Thus, relaxation rates open a rich window on molecular motions through the measurement of macroscopic properties. Three main interactions lead to spin relaxation in proteins: the dipole-dipole (DD) interactions between two spins (nucleus and/or electron), the Chemical Shift Anisotropy (CSA) and the quadrupolar interaction 1. With
so that only the DD and CSA relaxation mechanisms need to be considered. The theory of nuclear spin relaxation by these interactions is well understood and has been presented extensively in a number of textbooks and reviews 3-5.
The fluctuations of nuclear spin interactions are described by correlation functions: either with an auto-correlation function (an interaction with itself) or a cross-correlation function (the correlation of an interaction with another interaction). The molecular origin of fluctuations of internal interactions in disordered proteins are reorientation motions: local librations, dihedral angle jumps between rotamers, rotational diffusion of segments of the polypeptide chain. The correlation function will typically decay to zero within a few nanoseconds or a few tens of nanoseconds. Thus, relaxation can be used to probe motions that occur between low picoseconds and low tens of nanoseconds.
The Fourier transform of the correlation function is the spectral density function. Relaxation rates are expressed as linear combination of the spectral density function taken at eigenfrequencies of the spin system. For example, the nitrogen-15 transverse relaxation rate in an isolated 15N-1H pair, R2, depends on the spectral density function evaluated at the
following frequencies: 0, wH, wN, wH-wN and wH+wN:
𝑅! =𝑑"#
8 (4𝐽(0) + 𝐽(𝜔#− 𝜔") + 3𝐽(𝜔") + 6𝐽(𝜔#) + 6𝐽(𝜔#+ 𝜔")) +𝑐"!
6 (4𝐽(0) + 3𝐽(𝜔"))
with J(w) the spectral density function, 𝜔$ = 𝛾$𝐵% the Larmor frequency at magnetic field B0
of nucleus i of gyromagnetic ratio gi, dNH the dipolar coefficient for the 15N-1H spin pair 𝑑"# = &!ℏ"(#"($"
)*+$#% , µ0 the permeability of vacuum, ℏ the Plank constant divided by 2p and rNH the
inter-nuclear distance between the nitrogen and proton nuclei, and 𝑐" =,-√0$.$ the nitrogen CSA
constant with Δ𝜎"= 𝜎",∥− 𝜎",3 defined using the longitudinal and orthogonal CSA tensor
components.
Overall, for a 15N-1H pair on a protein, the measurement of sets of relaxation rates allows the
sampling of the spectral density function in 0 and at frequencies ranging from 40 MHz to 1.1 GHz (corresponding to magnetic field from 400 MHz to 1 GHz), corresponding to motions on the ps-ns timescale, which corresponds in large part to the decay timescales of the correlation function.
Quantitative descriptions of dynamics require the definition of a model of motion, i.e. an expression for the correlation function. In its most simple form, the correlation function only accounts for the isotropic reorientation of a molecule in solution, with no internal degree of freedom, a process often referred to as global tumbling and takes the form:
𝐶(𝑡) = 1 5𝑒45/7&
where tc is the global tumbling correlation time, on the order of few nanoseconds for small
molecules to few hundreds for large proteins. The Fourier transform of this correlation function leads to the following form of the spectral density function:
𝐽(𝜔) =25(1 + 𝜔𝜏8!𝜏
8!)
Motions in proteins can rarely be described with a single correlation time. In IDPs and IDRs, several reorientation motions are superimposed and lead to multiexponential decays of correlation functions. The measurement and analysis of large sets of relaxation rates allow for the description of motions over two to three orders of magnitude of correlation times as will be illustrated in the following sections.
Ample motions around 1 ns (very fast for a protein) lead to small values of the correlation function J(w) over the entire range of frequencies probed by relaxation in IDPs and IDRs. In particular, the spectral density J(0), which typically dominates the contributions to transverse relaxation, is particularly small. The resulting low relaxation rates allow for a significant amount of polarization to be preserved in long experiments, opening the way to the development of complex experiments in IDPs and IDRs 6. In the case of IDPs and IDRs, specific
pulse sequences have been developed to improve the resolution and efficiency of relaxation measurements 7,8
2.2. Measurement of longitudinal auto- and cross-relaxation
Steady-state 15N-{1H} nuclear Overhauser effects (NOEs) are often employed as a single
relaxation-based experimental evidence of the disordered nature of a protein region. The method consists in measuring the nitrogen-15 polarization at the steady-state under the effective saturation of protons 9. Methods to measure NOEs have been recently improved to
with the solvent. Steady-state NOEs are remarkably resilient to this effect, as long as the frequency of saturation of the protons is significantly higher than the kinetic constant of exchange.
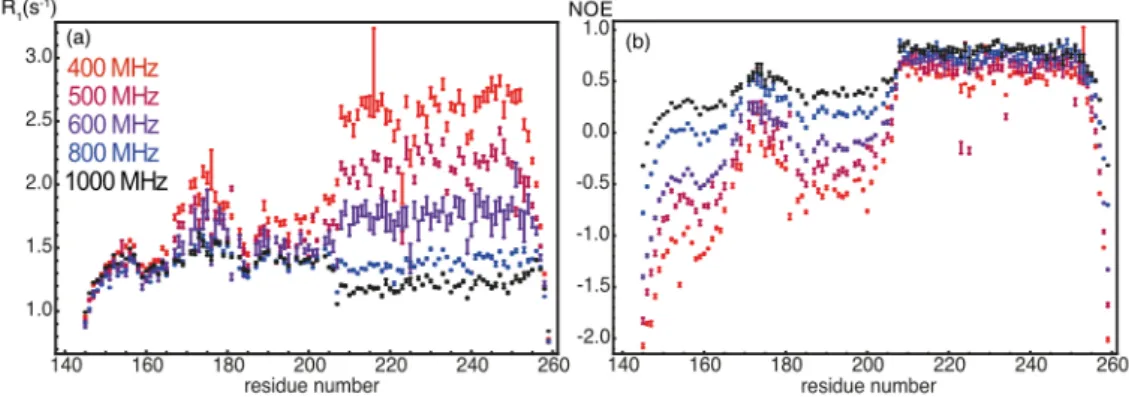
Figure 2. (a) Nitrogen-15 longitudinal relaxation rates and (b) steady-state 15N-{1H} nuclear
Overhauser effects recorded on the protein Engrailed 2 at magnetic fields ranging between 400 MHz (9.4 T) and 1 GHz (23.5 T). This construction includes the homeodomain (residues 205-259), which comprises three a-helices and a disordered N-terminal extension that features a hydrophobic cluster around residue 175. Adapted from 12.
Steady-state 15N-{1H} NOEs arise from cross-relaxation between proton and nitrogen-15
longitudinal polarizations. This cross-relaxation rate sNH is proportional to the spectral density
function near the Larmor frequency of the proton, to a good approximation: 𝜎"# ∝
𝐽(0.87𝜔#), where wH is the Larmor frequency of the proton 13. Note that steady-state NOEs
estimate the ratio between this cross-relaxation rate and the longitudinal relaxation rate of the nitrogen-15 nucleus. One measures the following ratio of intensities:
𝑁𝑂𝐸 = 𝐼99 𝐼:; = 1 + 𝛾# 𝛾" 𝜎"# 𝑅<
where Iss is the intensity measured at the steady-state under proton saturation, and Ieq the intensity measured at equilibrium, with no perturbation of the spin system. gN,H are the
gyromagnetic ratios of the nitrogen-15 and hydrogen nuclei, R1 is the longitudinal relaxation
rate of the nitrogen-15 nucleus. Most often, the longitudinal relaxation rate of nitrogen-15 is dominated by the spectral density at the Larmor frequency of the nitrogen-15 nucleus, 𝐽(𝜔").
Thus, NOEs give a measure of the ratio 𝐽(0.87𝜔#) 𝐽(𝜔⁄ "). As can be seen in Figure 2, in the
case of the protein Engrailed-2, which comprises an N-terminal disordered region followed by a folded homeodomain, NOEs are strongly field-dependent while R1 are weakly
field-dependent in the IDR 12. Indeed, the spectral density at high frequency 𝐽(0.87𝜔
significantly in the range of high magnetic fields currently accessible, while the spectral density 𝐽(𝜔") varies much less with the field. By contrast, steady-state NOEs vary weakly with the field in the folded domain, due to similar variations of the spectral densities 𝐽(0.87𝜔#) and
𝐽(𝜔"). An important lesson of this study is that steady-state 15N-{1H} NOEs are strongly
field-dependent in IDPs. A ratio equal to 0.3 at a moderate field (e.g. 500 MHz) highlights the presence of slow tumbling structured elements. The same ratio of 0.3 at 1 GHz corresponds to a fully disordered region. Hence, one should always indicate the magnetic field at which steady-state 15N-{1H} NOEs are recorded, this is an important piece of information.
Longitudinal relaxation rates R1 are necessary for the analysis of pico- to nanosecond motions
in disordered proteins. Yet, as can be seen from Figure 2.a, nitrogen-15 longitudinal relaxation rates are not those with the most striking variations in IDPs. The main reason is that longitudinal relaxation rates depend on linear combinations of the spectral density function at the Larmor frequency of nitrogen-15 and close to the proton Larmor frequency. As we will see below, motions with correlation times around tc = 1 ns dominate the reorientation
dynamics of the backbone in IDPs. The reciprocal frequency is w = 109 rad.s-1 or w/2p = 160
MHz. This frequency seats just in between the range of Larmor frequencies for nitrogen-15 and the proton for all high magnetic fields currently accessible. Hence, small variations of dynamics from site to site will lead to an increase (resp. decrease) of the spectral density 𝐽(𝜔"), compensated by a decrease (resp. increase) of the spectral densities 𝐽(𝜔"+ 𝜔#) and
𝐽(𝜔"− 𝜔#), reducing variations of the longitudinal relaxation rate R1. Note that the exact
same trends enhance the site-to-site variations of the NOE ratio.
2.3. Transverse relaxation measurements
Transverse relaxation measurements usually open a rich window on the dynamics of proteins over many timescales: the rates are dominated by the spectral density function at zero frequency, 𝐽(0), which is proportional to a weighted average of the correlation times that define reorientation motions in the pico- to nanosecond range. In addition, contributions due to chemical exchange (see below) lead to higher transverse relaxation rates in the presence of micro- and millisecond dynamics. Unfortunately, transverse nitrogen-15 relaxation rates in disordered proteins are quite difficult to evaluate accurately. The main reason is the sensitivity of the rates measured to the exchange of labile amide protons with the solvent. This process
leads to apparent increase of transverse relaxation rates due to the chemical exchange between hydrogen-bound and deuterium bound nitrogen-15 14. In addition, the starting
polarization of amide proton is strongly dependent on the partial saturation of water protons, which is relaxation-delay dependent. In addition, nitrogen-15 transverse relaxation times in IDPs are usually much longer than the maximum duration of the relaxation delay that is permitted on most high-resolution probes. Thus, only the beginning of the relaxation decay can be sampled, reducing the accuracy of the measurements. Several schemes have been proposed to improve the precision and accuracy of transverse relaxation rate measurements. In particular, the proton-decoupled Carr-Purcell-Meiboom-Gill sequence, introduced by Yuwen and Skrynnikov 15 is an efficient alternative to conventional sequences developed for
folded proteins.
2.4. Cross-correlated relaxation measurements
Relaxation may occur from the interference of two different relaxation mechanisms. Such cross-correlated relaxation rates often depend solely on the spectral density at zero frequency 𝐽(0). Importantly, these rates are very weakly dependent on the presence of chemical exchange. They are thus an interesting alternative to tedious measurements of transverse relaxation rates. In particular, cross-relaxation rates hxy due to the cross-correlation of the
nitrogen-15 chemical shift anisotropy (CSA) and the dipole-dipole (DD) coupling with the amide proton are insightful. The experiment developed to measure this rate is very robust 16
and has been applied to several IDPs 12,17. The only drawback of this experiment is the
necessary measurement of relaxation to and from a nitrogen-15 polarization antiphase with the amide proton. Amide exchange with the solvent leads to a fast decay of this polarization, altering the precision of measurements, particularly if carried out at high temperature and/or high pH (higher than 6.5). In the case of Engrailed-2 homeoprotein (Figure 3), sharp variations of hxy transverse cross-relaxation rates were observed at all fields in both the ordered and
disordered regions. As these variations were strongly correlated with the secondary structure propensities (SSP) of the protein, hxy were considered as the most relevant relaxation rates
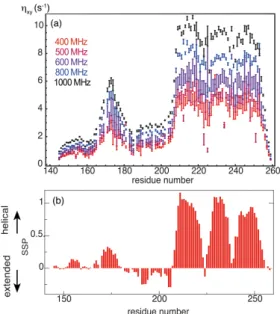
Figure 3. (a) CSA/DD cross-correlated cross-relaxation rates recorded on the protein Engrailed-2 at magnetic fields ranging between 400 MHz (9.4 T) and 1 GHz (23.5 T). (b) Secondary structure propensities18 calculated from carbon-13 chemical shifts. This
construction includes the homeodomain (residues 205-259), which comprises three a helices and a disordered N-terminal extension that features a hydrophobic cluster around residue 175. Adapted from 12.
Other cross-correlated relaxation rates can be measured in principle in disordered proteins. For instance DD/DD cross-correlated relaxation measurements have been carried out to sample the dynamics of methylene side chain groups in an unfolded protein 19. However,
cross-correlated relaxation rates depend on the dynamics as well as the relative orientation of the two interactions. Note that the examples discussed above describe interactions with a mostly rigid relative orientation (CSA and DD in 15N-1H pairs or the two 13C-1H DD interactions
in a methylene group). The broad conformational space of IDPs makes the wide variety of cross-correlated relaxation methods developed for folded proteins difficult to interpret in disordered proteins as the effects of average relative orientations (structure) and correlation times (dynamics) are difficult to deconvolute.
2.5. Models to interpret ps-ns motions in IDRs and IDPs
As mentioned in the introduction to this chapter, most models at hand to interpret nitrogen-15 relaxation in intrinsically disordered proteins were developed and tested in folded proteins and are poorly adapted. In particular, the widely used model-free approach 20,21 relies on a
separation of two types of motions: a global motion, which is the rotational diffusion of the entire molecule, and internal motions. In IDPs, the lifetime of the overall conformation of the
protein is comparable to its typical overall diffusion correlation time, defying the definition of an overall diffusion tensor. In the absence of a well-defined overall motion, a series of alternate approaches has been developed.
A simple way to analyze relaxation rates is to retrieve the values of the spectral density function from relaxation rates without trying to extract correlation times. The first step is quantitative 13,22,23 and the exploitation of the spectral density values is rather qualitative 24.
A related approach consists in determining a distribution of correlation times from an ensemble of relaxation rates. This ill-posed problem is best approached with regularization methods and provides quantitative distributions of relaxation rates with few assumptions 12.
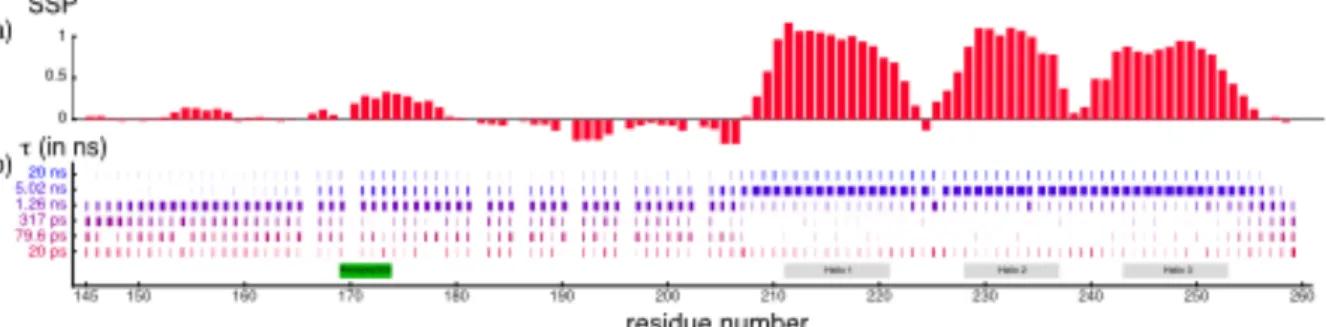
A good example is the Interpretation of Motions by a Projection onto an Array of Correlation Times (IMPACT). The range of correlation times characterized is defined by the range of eigenfrequencies covered in the relaxation dataset, which is defined by the types of nuclei and the range of magnetic fields. Then, an array of correlation times, equally spaced on a logarithmic scale is globally optimized. Finally, a discrete distribution of correlation times is obtained for each residue in the protein. In the protein Engrailed-2, motions in the disordered concentrate around 1 ns, with significant contribution of slower motions in the hydrophobic core around residue 175 and broader distributions of sub-ns motions at both the N-terminus and the C-terminus (Fig.4 ). By contrast, relaxation mostly characterizes overall rotational diffusion in the folded homeodomain (residues 205-259).
Figure 4. Dynamic characterization of Engrailed-2, a partially disordered protein by the IMPACT approach. (a) Secondary structure propensity of Engrailed-2. (b) Residue-specific distribution of correlation times. This graph should be read as vertical histograms representing the relative weight of each correlation time in the distribution. The height of each bar in the histogram Is also reflected in the color-coding for enhanced visibility. Reproduced with permission from 12.
Another efficient approach for the analysis of relaxation rates in disordered proteins is the use of a series of correlation times for motions covering different orders of magnitude of timescales 17,25. Although the individual correlation times may only be effective correlation
times and may not represent a single motion 20,26, a careful analysis can be extremely
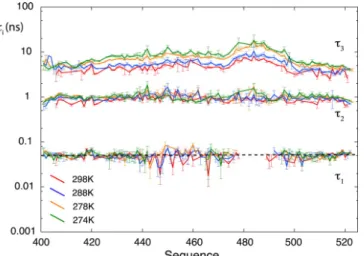
insightful, identifying clearly different classes of motions (Fig. 5). In particular, a study at multiple magnetic fields over a broad range of temperatures has shown that three effective modes could be defined and analyzed together 17:
• Fast motions, likely librations of the hydrated peptide plans, with correlation times close to 50 ps and weakly temperature dependent.
• Intermediate motions, due to jumps of backbone dihedral angles leading to an effective correlation time close to 1 ns.
• Slower motions with correlation times in the 3-10 ns range, corresponding to the rotational diffusion of segments of the peptide chain.
Figure 5. Analysis of a broad set of relaxation rates in the disordered protein N-Tail, using three discrete correlation times. Longitudinal and transverse relaxation rates were measured alongside transverse CSA/DD cross-correlated cross-relaxation rates and steady-state 15N-{1H}
nuclear Overhauser effects at four temperatures and four magnetic fields. Motions covering more than two orders of magnitude of correlation times can be analyzed from nitrogen-15 relaxation. Adapted with permission from 17. Copyright 2016 American Chemical Society.
As disordered proteins explore a broad set of conformations, it is legitimate to hypothesize that its motions cover a continuous distribution of correlation times. Early studies by Buevich and Baum 27,28 suggested the use of the Cole-Cole distribution 29. Unfortunately, this empirical
distribution, introduced to describe dielectric dispersion and absorption provides unphysical parameters when NMR relaxation is considered, as the spectral density function 𝐽(𝜔) diverges
as 𝜔 → 0. More recently, Palmer and co-workers introduced another type of distribution, inverse Gaussian distributions, which are based on the principle of maximum entropy and lead to a defined value of the spectral density function at zero frequency 30. Note that the later
approach has been implemented on the IDR of a small, partially folded protein: GCN4. Hence, an overall diffusion tensor was defined from relaxation of the folded domain and only internal dynamics where described with the inverse Gaussian approach. Finally, as the conformation energy surface of IDPs can be rightly described as rugged, one could use physical models of motions designed to describe diffusion on a rugged surface, such as fractional diffusion 31.
Unfortunately, this model leads to divergent spectral density function in zero and could only be used in favorable cases where an overall diffusion tensor can be defined, such as GCN4.
2.6. Comparison with molecular dynamics simulations
NMR relaxation provides unique information about the amplitude and timescales of motions in proteins in the pico- to nanosecond range with atomic resolution. Yet, this information is not a movie of conformational fluctuations and transitions. NMR is not sufficient to determine a description of the kinetic pathways between conformations. On the other hand, such a description can be achieved by molecular dynamics (MD) simulations, provided MD simulations are in good agreement with experiments. As force fields for molecular dynamics simulations have been developed, historically, to reproduce the properties of folded proteins, agreements between experimental and simulated relaxation rates remain difficult to obtain for IDPs and IDRs.
Yet, MD simulations of the yeast transcription factor GCN4 32 have shown semi-quantitative
agreement with experiments. This agreement was obtained in part, through a general scaling of order parameters and facilitated by the fact that variations of order parameters in the disordered region are dominated by the natural evolution with the distance to the folded domain. More recently, MD simulations of the disordered protein NTail were performed with state-of-the-art force fields 33. Relaxation rates were poorly reproduced from the raw
trajectories, in particular with simulated transverse relaxation rates higher than experimental rates. Such discrepancies were assigned to the over representation of contacts in the polypeptide chain due to rare encounters over the course of the simulation. Hence a procedure called Average Block Selection Using Relaxation Data (ABSURD) was designed to select ensembles of blocks of the MD trajectory that together reproduced well relaxation rates
used as a constraint, all simulated rates at all magnetic fields were in better agreement with experimental relaxation rates, demonstrating that the ABSURD procedure corrects for a particular flaw of MD simulations and not for a general failure to simulate properly motions in disordered proteins. An analysis of ABSURD ensembles of sub-trajectories has given a better mechanistic description of the motions that lead to nitrogen-15 relaxation in disordered proteins. This analysis has confirmed the initial interpretation of relaxation datasets, identifying fast librations of the peptide plane, backbone dihedral angle dynamics and rotational diffusion of segments as the main types of motions in the picosecond range, around 1 ns and in the low nanosecond range, respectively 34.
The weaknesses of molecular dynamics force fields for their application to the simulation of disordered protein were assigned a few years ago mainly to the interaction between water and the polypeptide chain 35. Recently, Robustelli et al. 36 introduced a modified force field,
with small changes in the van der Walls interaction terms for both water and proteins. This force field described properly conformational properties of both folded and disordered proteins. Accurate unbiased MD simulations of picosecond-nanosecond dynamics of disordered proteins may arise in the near future.
3. Microsecond-millisecond motions in IDPs and IDRs: binding
3.1. Investigating binding of IDPs with titrations.
Chemical shifts are direct probes of the electronic environment surrounding nuclei. This property can be used to monitor the interaction between a protein and a partner (protein, nucleic acid, or small organic molecules for example) as the later will introduce changes in the electronic cloud of nearby nuclei 37. A change in the chemical shift of a given nucleus can be
due to two distinct effects: participation in the binding for which the chemical shift change is a direct effect of the proximity with a ligand, or wide conformational rearrangement, in which case the partner has long-range effects on the protein and the change in chemical shift of the corresponding nuclei mainly accounts for a new conformational ensemble. The later effects are essentials in the case of allosteric regulation of proteins and can involve folded as well as unfolded proteins or regions 38.
- An atomic resolution of the interaction. This type of information can also be obtained, at least partially, from X-ray crystallography and Cryo-Electron Microscopy;
- The thermodynamics and kinetics of the binding. Isothermal Titration Calorimetry (ITC), Surface Plasmon Resonance (SPR) and Micro-Scale Thermophoresis (MST) are nowadays other reliable instrumentations that can provide this type of information, but it must be pointed out that among these three alternative techniques, only SPR can report on both kinetics and thermodynamics of binding39;
All this information can be potentially gathered all at once from a NMR titration experiment, depending on the range of timescales, chemical shift differences and relative populations.
3.1.1. Atomic resolution of the interaction and model of binding
NMR is a particularly well-suited tool to study IDPs and IDRs in their complex forms without any prior knowledge of the binding region. This information is absolutely required for X-ray crystallography before any crystallization attempts to design the suitable constructs that first will not prevent crystal formation and second will not lower the quality of the electron density map. Monitoring NMR resonances affected by addition of a partner gives indication on regions that participate in the binding, or that are indirectly affected by the binding and undergo a conformational change. Chemical shifts changes and/or intensity decreases are two clear and easily assessed indicators for binding of IDPs and IDRs (Fig.6). It was for example recently shown that the binding region of Artemis to the DNA binding domain of Ligase-IV has 6 residues contributing significantly to the interaction 40 that were not present in the electron
density map of the complex. It was suggested that these residues are forming fuzzy electrostatic interactions on a large surface area of the Ligase-IV. The residues involved in these poorly-specific electrostatic interactions have a more restrained conformational ensemble compared to the unbound state, but still span a large amount of possible conformations, making the formation of a well-ordered crystal very unlikely. Still, NMR titrations can probe such dynamic contacts.
Moreover, the chemical shift evolution is a clear indication of the number of binding sites using Singular Value Decomposition (SVD) 41. In this example, 1H-15N cross-peaks of the TAZ2
the authors concluded on a two-site binding model for the interaction, with low and high affinity sites for the binding of p53. Another example from the same group shows that NMR titrations can be used to reveal an intermediate bound state stabilized through non-specific intermolecular interactions that evolve to the bound state 42. In this example, the NMR
titration shows an initial fast exchange regime, giving information about the initial non-specific interaction, and evolves to the slow exchange regime for which the intermediate state interconverts with the final bound state that is stabilized by specific intermolecular interactions. These two works show how NMR titrations can be used to study potentially complex binding modes involving sequential events.
Once bound to the folded partner, the high-molecular-weight complex that is formed can dramatically increase transverse relaxation rates of the IDP or IDR at the binding region, leading to line broadening that prevent direct observation of the bound state 40. Deuteration
of IDPs has proven to be efficient to recover cross-peak intensities of regions involved in the interaction with large protein domains 43. In this study, the spectrum of 2D-labeled PNUTS
bound to the 38 kDa protein PP1 shows a clear increase in the proton chemical shift dispersion, suggesting a folding-upon-binding transition further confirmed by X-ray crystallography. Interestingly, this example also reveals another aspect of the NMR titration as a way to determine a minimal construct of PNUTS that further led the authors to solve the crystal structure of PP1 bound to the interacting region of the IDR.
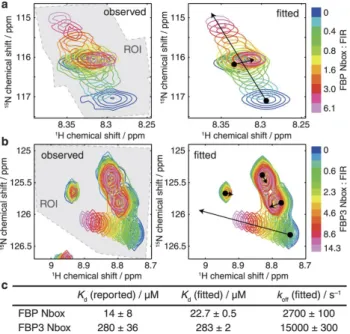
Figure 6. Titration of Artemis (residue 480-675) with the DNA binding domain of Ligase-IV followed by 2D [1H-15N]-HSQC spectra. Residues essential for the binding (485-495, light green
rectangle in (b) and present in the crystal structure) disappear upon binding while residues located on the C-terminus side show significant Chemical Shift Perturbation (CSP). Half of
these residues are negatively charged and interact with the positively charged surface of Ligase-IV. Reprinted with permission from 40. Copyright 2017 American Chemical Society.
3.1.2. Extracting thermodynamics and kinetics information from NMR titration experiments
As pointed out in a recent review focusing on IDP complexes 44, NMR titrations can be used to
probe a wide range of affinities from picomolar to millimolar. Dissociation constant Kd can be
obtained in the fast exchange regime (Δ𝜔 ≪ 𝑘:=) by chemical shift analysis, and in the slow
exchange regime (Δ𝜔 ≫ 𝑘:=) by intensity analysis. However, in all the intermediate
situations, neglecting the chemical exchange process leads to systematic error 37. One way to
take into account the effect of the exchange regime on the thermodynamic parameters is to perform lineshape analysis on the recorded spectrum. In protein NMR, and particularly in the case of IDPs and IDRs, two-dimensional lineshape analysis is essential as peak overlaps would prevent the extraction of any reliable information out of one-dimensional spectra. Recently, Waudby et al released an open-source software for the analysis of NMR titrations recorded using different types of experiments (HSQC and HMQC) and isotopic labelling schemes, that considers a selection of two- and three-state binding models (two states, induced fit,…) 45.
This software, called TITAN, relies on the simulation of the two-dimensional spectra, throughout the titration, by using a Liouvillian considering the chemical shift in the free and bound states, the transverse relaxation rates in both states, the dissociation constant(s) and the kinetic constant(s). The NMR experiment is then simulated and the parameters of binding are adjusted to reproduce the recorded spectra (Fig.7). For instance, the Liouvillian used to calculate the density operator in the direct dimension is 45:
𝑑 𝑑𝑡I 𝑀>(𝑡) 𝑀?(𝑡) 𝑀8(𝑡) K = − LM 𝑅!,>+ 𝑖𝜔> 0 0 0 𝑅!,?+ 𝑖𝜔? 0 0 0 𝑅!,8 + 𝑖𝜔8 O − P −𝑘>?− 𝑘>8 𝑘?> 𝑘8> 𝑘>? −𝑘?>− 𝑘?8 𝑘8? 𝑘>8 𝑘?8 −𝑘8>− 𝑘8?QR I 𝑀>(𝑡) 𝑀?(𝑡) 𝑀8(𝑡)K
where R2,i refers to the transverse relaxation rate of state i, wi is the frequency of state i, Mi is
the magnetization of state i and kij are rate constants from state i to state j.
Lineshape analysis provides not only information about the thermodynamics of binding (like chemical shift or intensity analysis would provide), but also kinetics and NMR relevant
information (i.e. transverse relaxation rates) that can further be used to characterize the bound state in terms of dynamics. This relatively large amount of information is obtained from combined analysis of chemical shift, intensity and line broadening evolution.
Titrations analysis requires that both free and bound states (saturated) are observable on the NMR spectra. As discussed earlier, slow tumbling encountered in high-molecular-weight complexes might lead to line-broadening of the peaks of the bound form. In this case, deuteration may solve this issue. Other types of experiments to detect so called “NMR invisible” states can also be used to extract the chemical shifts of the population in the bound state as shown in 40 and are discussed below.
Figure 7. Two-dimensional lineshape analysis. (a) and (b) show two regions of HMQC titrations spectrum of FIR RRM1-RRM2 with FBP box on the left and the corresponding fitted spectrum using TITAN analysis on the right. Extracted thermodynamics values agree with the literature as shown in (c). Reproduced from 45.
3.2. Investigations of binding mechanisms with chemical-exchange NMR
The study of the interaction of an IDP with its partner by NMR is sometimes hindered by the progressive disappearance of NMR signals of key sites from the interacting regions upon addition of the binding partner. In some cases, these disappearing resonances are not recovered even under saturating conditions, where the bound form of the IDP is the only one populated, severely precluding the detailed characterization of the complex using standard NMR techniques. Loss of signal in the course of the titration can be a manifestation of line broadening stemming from conformational exchange on the micro- to millisecond timescale
between the free and the bound states as well as intermediates along the binding trajectory, or from an increased transverse relaxation rate of the bound state resonance either arising from micro- to millisecond structural dynamics in the complex or simply slow tumbling of the bound parts of the protein in case the complex is of high molecular weight.
NMR techniques designed to study exchange processes in proteins, such as Carr-Purcell-Meiboom-Gill (CPMG) relaxation dispersion and chemical exchange saturation transfer (CEST) experiments, allow the characterization of states that are not visible in the spectra, so long as they interconvert with a major, observable state on micro- to millisecond time-scales. Thus, analysis of the NMR-invisible bound form can be achieved by analyzing the relaxation dispersion 46 or CEST 47 profiles of resonances from the free protein measured for a sample
containing the protein of interest and sub-stoichiometric amounts of the protein partner, so that the bound state is lowly populated.
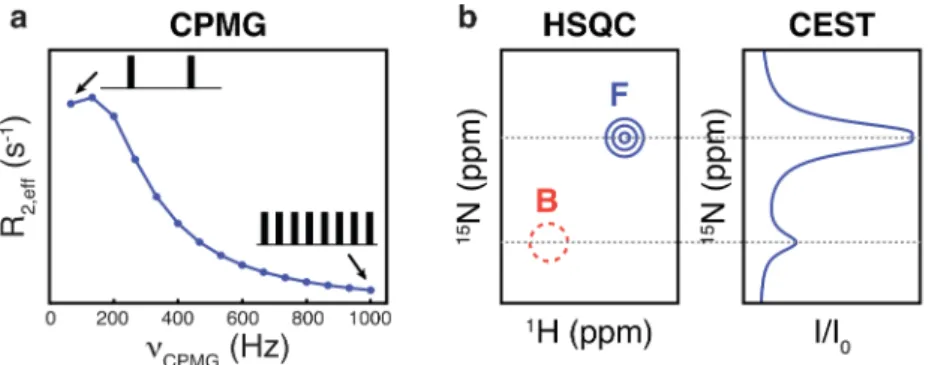
Figure 8. (a) CPMG relaxation dispersion profile. Here, the effective transverse relaxation, R2,eff, of a spin such as 15N is monitored as a function of the repetition frequency uCPMG of a
train of refocusing pulses. Higher repetition frequencies attenuate the dephasing of the transverse magnetization due to exchange and thereby leads to a decrease in R2,eff rates. (b)
Schematic representation of a small portion of a standard 1H-15N two-dimensional correlation
spectrum (left), where the peak corresponding to the weakly populated bound state (in red) cannot be observed directly and is only sketched for clarity. The corresponding 15N CEST
profile (right) is obtained by varying the carrier frequency of a weak radio-frequency field. The intensity ratio I/I0 of the signal of the major state is attenuated when irradiation frequency
corresponds to either the free (F) or bound (B) states, thus revealing the position of the ‘invisible’ B resonance.
The CPMG relaxation dispersion class of experiments 48-50 builds upon the fact that chemical
magnetization dephasing, which manifests in increased effective transverse relaxation rates (R2,eff). In practice a variable number of chemical shift refocusing pulses is applied during a
constant-time period 51 to modulate the exchange contribution to transverse relaxation rates.
Increasing the number of pulses results in a diminution of magnetization dephasing due to exchange and thereby induces a decrease in measured R2,eff values (Fig. 8a). Subsequent
analysis of the variation of R2,eff as a function of pulsing frequency (𝜐@ABC), so-called relaxation
dispersion (RD) profiles, not only provides information about thermodynamics (binding affinity) and kinetics of the binding reaction, but also site-specific information about the exchanging states in the form of chemical shifts (structural information) and in some favorable cases transverse relaxation rates (dynamic information). Over the last two decades, new pulse sequences along with new spin labeling strategies 52 have greatly increased the number of
nuclear probes that are amenable to study by CPMG RD, including 15N 53,54 , 1HN55, 13C’ 56, 13Cα 57 and 1Hα58 spin probes.
In CEST experiments 59-62, a series of spectra are recorded as a function of the position of a
weak radio-frequency (rf) field that is applied during a delay where the magnetization of interest is longitudinal. The effect of irradiation is then monitored by plotting the major (observable) state peak intensities (I), normalized to the case where the irradiation delay is absent (I0), against the rf field offsets. When the irradiation is applied nearby the resonance
of a major state, the signal intensity is greatly attenuated due to both spin saturation and “dephasing” induced by rf inhomogeneity. Similarly, when the weak rf field is positioned proximal to a minor (“invisible”) state resonance, the perturbation induced by the rf field gets transferred to the major state bulk magnetization via chemical exchange, which again leads to a loss of intensity of the major-state peak. Thus, a typical CEST profile contains a main intensity dip at the frequency of the major state resonance (free form) and a smaller dip at the position corresponding to the minor state resonance (“invisible” bound form) (Fig. 8b). CEST profiles reports on the same exchange parameters as the CPMG relaxation dispersion data. However, the two techniques remain highly complementary when combined together as each depends differently on binding affinity, kinetic model, structure and dynamics of the different states of the binding reaction. While CPMG relaxation dispersion approaches work best for systems with exchange rates that fall roughly into the range 200 s−1 < kex < 2000 s−1,
kex < 500 s−1. Importantly, unlike CPMG relaxation dispersion, CEST is relatively insensitive to
the presence of 13C–13C couplings, thereby enabling measurement of NMR-invisible state
side-chain 13C chemical shifts in uniformly 13C labeled proteins 63,64.
In a pioneering study, Sugase, Dyson, and Wright used CPMG relaxation dispersion experiments to decipher the binding mechanism of the disordered phosphorylated kinase inducible activation domain (pKID) of the transcription factor CREB that folds as a pair of helices upon binding onto the KIX domain of the CREB binding protein 42. NMR titration of
pKID with KIX showed that exchange between the free and fully bound states is slow on the chemical shift timescale, but evidence of fast exchange shifts at the early stage of the titration clearly indicated that the binding mechanism is more complex than a simple two-state process. Using 15N CPMG relaxation dispersion experiments measured at different
sub-stoichiometric concentrations of KIX, Wright and co-workers demonstrated that coupled folding and binding of pKID to KIX proceeds through multiple steps with initial diffusional encounter complexes evolving by way of a partially folded intermediate to the final fully folded bound state. Interestingly, in a later study using similar experiments, the same group established that the transcription factor c-Myb interacts with KIX at the same site than pKID but according to different binding mechanism 65. Here all the data could be analyzed using a
simple two-state binding mechanism where no complex intermediates needed to be invoked. Unlike pKID which remain fully disorder in its pre-recognition state, c-Myb exhibits significant helical propensity in its free state reminiscent to the bound state conformation. The authors therefore suggested that the binding mechanisms whereby IDPs interact with their partner strongly depends on their intrinsic secondary structure propensity. In another study 66,
Blackledge and co-workers investigated the binding reaction of the disordered NTAIL domain with its folded, binding partner PX using 15N, 13Cʹ and 1HN CPMG relaxation dispersion
experiments recorded at 5 different molar ratios ranging from 2 to 15 % of PX and 2 magnetic field strengths, 14.1 and 18.7 T. The use of multiple spin probes is interesting as different nuclei can potentially “sense” different processes. For example, 13Cʹ resonances are highly
dependent on secondary structure and are excellent reporters of folding events while 1HN and 15N resonances might also be affected by other molecular processes, such as the formation of
form a non-specific dynamic encounter complex, in which a preformed helical state of free NTAIL is stabilized. This step is followed by the formation of native intermolecular contacts between NTAIL and PX, with NTAIL progressively adopting its final conformation on the surface of PX. In total, these three studies nicely exemplify how CPMG relaxation dispersion approaches can be used to obtain atomic resolution information about complex binding mechanisms involving IDPs and, as such, represent an interesting complement to other kinetic techniques.
As mentioned previously, IDPs can form highly dynamic complexes exhibiting large differences in flexibility along the sequence of the protein, including non- or transiently interacting regions retaining a large amount of disorder as well as segments that fold upon binding or become rigid because tightly bound to the partner. In the NMR spectra, the most flexible parts in rapid exchange between multiple conformers will produce very intense and sharp peaks while folded and tightly bound regions will behave as part of a larger molecule with less favorable relaxation properties, leading to weaker and broader peaks and even full signal disappearance when the complex reaches a certain size (MW > 50 kDa). Bound state resonances can also be broadened out due to conformational dynamics on microsecond–millisecond time scales in the complex. CPMG RD and CEST experiments provide unique opportunities to probe the structure and dynamics of such NMR-challenging complexes as the bound-state resonances do not need to be visible in the spectra to be studied.
One such example studied by Jensen and co-workers is the dynamic complex comprising the 100 amino-acid disordered domain of MKK7, and JNK1, whose interaction is essential to activate the JNK signaling pathway 67. MKK7 contains three JNK1 docking sites (interaction
sites) within its disordered domain but upon addition of JNK1, the resonances from the three docking sites (D1, D2 and D3) of MKK7 progressively disappear providing no insight into the binding mechanism. CPMG relaxation dispersion and CEST experiments were recorded on MKK7 in the presence of 10% (molar ratio) of JNK1 to obtain structural information about the complex. Both CEST and CPMG experiments reveal exchange on the micro- to millisecond time scale for residues located in and around the docking sites D2 and D3. Interestingly, the analysis of CEST data displays large difference in transverse relaxation rate values between the free and bound states of MKK7 in particular for residues within the D2 docking site. For example,
a satisfactory fit of the CEST data for T42 requires a R2 value larger than 850 s-1 that largely
exceeds the expected R2 rate for the JNK1-MKK7 complex. This suggests that MKK7 undergoes
conformational exchange within the complex and forms a so-called fuzzy complex that is characterized by a number of conformational states. Interestingly, the crystal structure of JNK1 in complex with the second docking site of MKK7 (a 12-residue long peptide) exhibit two different binding conformations of D2 on the surface of JNK1, which supports this view. More recently, Ferrage and co-workers 40 have employed CPMG and CEST experiments to
characterize the structure and dynamics of a 96-residue long construct from the disordered C-terminal region of the protein Artemis bound to the DNA-binding domain (DBD) of Ligase IV, for which most signals from the interaction site of Artemis could not be detected in the spectra. 15N CPMG relaxation dispersion experiments on samples of Artemis with increasing
amounts of unlabeled Ligase IV (Fig. 9a), complemented with 15N CEST experiments performed
with 10 % molar ratio of Ligase IV (Fig. 9b) were carried out. The combined analysis of the profiles provided accurate 15N chemical shifts as well as 15N effective transverse relaxation
rates R2(15N) for all residues of the bound state of Artemis (Fig. 9f). Intriguingly, R2(15N)
relaxation rates within the interaction region vary drastically upon binding. While the highest rates were observed at the core of the interaction site (residues 488-494), as expected due to folding and slow molecular tumbling of Ligase IV within the complex, the bound state R2(15N)
rates for the 495–510 region are lower than in the core of the complex but larger than in the free state. This region spans about twice the persistence length in disordered or unfolded proteins, suggesting a partly restricted conformational space explored on picosecond– nanosecond time scales, possibly due to transient interactions with Ligase IV. 13C chemical
shifts of Artemis in the bound form were obtained from CEST experiments recorded on 13C’ 68
(Fig. 9c), 13Cα 69 (Fig. 9d), and 13Cβ 70, using a uniformly 15N,13C-labeled sample of Artemis with
10% molar ratio of unlabelled Ligase IV. These chemical shifts were then used to derive dihedral angles for the backbone and a few side chains of the bound form of Artemis using the program Talos-N, which were subsequently used as structural restraints in the program CNS to produce a structural model of the bound form of Artemis. NMR titrations of the DBD of Ligase IV with Artemis were then performed to collect relevant structural information on the binding surface of Ligase IV. These data were used alongside the structure of free Ligase
the complex with lowest energy is remarkably similar to the structures deduced from previous crystallographic studies that used a short 11-amino-acid Artemis peptide, thereby confirming the validity of the approach (Fig. 9e,g).
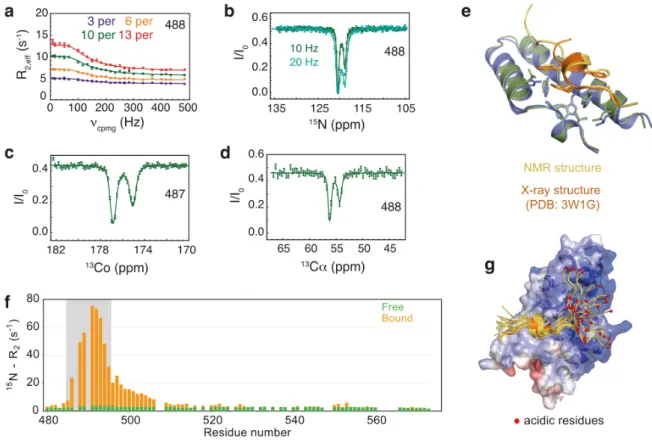
Figure 9. (a) 15N CPMG dispersion profiles for representative residues of Artemis at the
interface with Ligase IV. The concentration of Ligase IV was varied from 0.03 (purple) to 0.06 (orange), 0.10 (green), and 0.13 equiv. (red). (b) 15N CEST profiles obtained for three
representative residues of Artemis. Two different rf field amplitudes were used: 10.4 Hz (green) and 20.8 Hz (light green). Representative 13Cʹ (c), and 13Cα (d) CEST profiles of nuclei
of Artemis at the interface with Ligase IV. Experimental data are shown as small circles. Fitted curves are shown as solid lines in all panels. All CEST experiments were recorded in the presence of 0.1 mol equiv. of unlabeled Ligase IV. (e) Comparison of the contacts at the interface of the complex in the crystal structure (Artemis in orange and Ligase IV in blue, PDB 3W1G) and in the lowest-energy HADDOCK model of the top cluster (Artemis in yellow and Ligase IV in green). (f) Transverse relaxation rates R2(15N) for the free (orange) and bound
(green) states of Artemis. (g) The 16 models of HADDOCK top cluster are superimposed onto the crystal structure of the complex as in panel (f). The electrostatic surface potential map of Ligase IV is shown in blue, white, and red to indicate positive, neutral, and negative electrostatic surface potentials, respectively. Residues of Artemis with acidic side-chains (D497, E498, and D501) are represented by small red spheres. Adapted with permission from
In a following study, Jensen and co-workers 71 applied a very similar approach to decipher the
dynamic interaction profile of the intrinsically disordered regulatory domain of the MAPK kinase MKK4 with the MAPK p38α. Here a set of 15N CEST and CPMG relaxation dispersion
experiments recorded on MKK4 at multiple substoichiometric ratios of p38α was conjointly analyzed to accurately estimate the 15N transverse relaxation rate values of MKK4 bound to
p38α. The results show highly heterogeneous R2 values of the bound state along the sequence,
which is consistent with the presence of multiple dynamic binding modes. The largest values were found at docking site indicating that the motif interacts with p38α in a stable, persistent manner. Interestingly, lower rates were observed for the KIS domain, suggesting a more dynamic interaction of these residues resembling the one of a fuzzy complex. This study offers a nice illustration of how IDPs can utilize a combination of different interaction modes to bind their partner.
3.3. Other methods to characterize ps-ns dynamics in complexes of IDPs and IDRs bound states
In the case of high affinity complexes (Kd on the nanomolar range or tighter), reaching
complete saturation is possible from a 1:1 mixture of the two partners. In this case, directly recording relaxation rates on the bound state is possible. For example, Wright and coworkers recently characterized a competition binding event using, among other techniques, the measurement of steady-state {1H}-15N NOE for two different IDRs (HIF-1a776-826 and CITED2 216-269) bound to the TAZ1340-439 domain 72. Interestingly, these two IDRs bind to the same region
of TAZ1 with the same nanomolar affinity. Yet, a 1:1:1 ternary mixture leads exclusively to 100% of the TAZ1:CITED2 complex. Heteronuclear {1H}-15N NOE allowed a semi-quantitative
comparison of ps-ns dynamics of the IDRs in the bound form. The authors found that helix aA
in HIF-1a was still highly dynamic on ps-ns timescales in the bound state, whereas most ps-ns motions were quenched in the analog helix of CITED2. The authors concluded that the helix aA of HIF-1a was not tightly bound to TAZ1 in the complex, allowing CITED2 helix aA to bind,
even if HIF-1a is already bound (mostly thanks to the interactions of helices aB and aC) thus
forming a transient ternary complex. Further interactions of CITED2 displace HIF-1a helices aB
and aC from TAZ1 to release HIF-1a.
cross-relaxation rates (CCCR) are insensitive to chemical exchange while providing an estimate of the spectral density at zero frequency J(0). The use of adiabatic pulses during the relaxation period allows one to improve the sensitivity of the measurements, even in the presence of chemical exchange 73. This has allowed the characterization of the dynamics of low-populated
disordered excited states in the KIX domain of the protein CBP 73. This method should be
readily applicable to the reverse case, where the protein is mostly disordered and the engineered excited state is partly folded in a protein complex.
3.4. Amide proton exchange: from false positives to insightful information
Hydrogen/deuterium (H/D) exchange is an indirect way to probe the dynamics and conformational properties of biomolecules in NMR and mass spectrometry, providing information about the solvent accessibility of labile protons. In NMR, it is possible to detect not only H/D exchange in real-time experiments but also to detect exchange of protons with either deuterons or protons from the solvent at the steady state. A very popular experiment used in protein NMR is the Phase-Modulated CLEAN chemical EXchange (CLEANEX-PM) experiment 74. This experiment was developed for folded proteins, where relaxation is in a
regime where the spectral density in zero dominates (slow tumbling regime). This is not the case for IDPs and IDRs, which leads to potential inaccuracies. A series of alternatives have thus been developed.
Nitrogen-15 relaxation rates depend strongly on the dipole-dipole coupling with the bond proton, or deuteron. Thus, longitudinal nitrogen-15 relaxation rates in 15N-1H pairs and 15N-2H
pairs differ significantly. If exchange takes place with a characteristic time comparable to the longitudinal relaxation time, then, H/D exchange rates can be determined from longitudinal relaxation decays measured in a series of samples with different proportions of H2O and D2O 75. A more straightforward difference between 15N-1H and 15N-2H pairs is the nitrogen-15
isotropic chemical shift, which differs due to an isotope effect between -0.6 and -0.7 ppm 76.
The SOLvent EXchange SpectroscopY (SOLEXSY) experiment is performed in a mixture of H2O
and D2O (50/50) 76. The evolution of signals arising from 15N-1H and 15N-2H pairs is monitored
in an experiment that selects as an initial state the magnetization of proton-bound nitrogen-15 nuclei. Nitrogen-nitrogen-15 signals are monitored in the highly-resolved indirect dimension of a-proton detected experiments in 13C/15N labeled proteins. Isotope shifts were also recently
on nitrogen-15 samples 77,78. In mixture of H2O and D2O (90/10), D-CEST experiment allow for
the characterization of the exchange between 15N-1H and 15N-2H pairs. This experiment
observes exclusively 15N-1H pairs but saturation transfer is observed when the nitrogen-15
chemical shift of 15N-2H pairs is irradiated. This experiment should allow for the determination
of exchange rates up to 100 s-1, with a main limitation being the resolution of the minor dip in
CEST profiles. Note that the chemical shift modulation due to the exchange between the hydrogen- and deuterium-bound states may also lead to contributions in the measurement of nitrogen-15 transverse relaxation rates. This has been discussed recently 14 and may explain
many weak dispersions observed in nitrogen-15 CPMG relaxation dispersion experiments in disordered proteins. If such uniform weak dispersions are observed, it is strongly advisable to record the experiment with a different proportion of D2O in the sample. If the proportion of
the minor species varies accordingly, the effect observed is simply H/D exchange and not conformational exchange.
Finally, in some cases, proton exchange can be too fast to detect either a nitrogen or proton resonance. Such fast exchange is often encountered in physiological conditions: at 37 ºC and pH ~ 7. In such cases detection on aliphatic protons and triple-resonance methods are necessary, but this is not enough: different physical phenomena have to be used for the detection of exchange. A decade ago, Pelupessy and co-workers introduced the idea that proton exchange could lead to scalar relaxation of the second kind for directly attached nuclei
79,80. This experiment has been successfully adapted lately for the measurement of amide
proton exchange 81, where exchange rates up to 600 s-1 could be measured at high
temperature on a folded protein. In principle exchange rates up to 104 s-1 can be determined.
The application to IDPs and IDRs is expected to be straightforward.
4. References
(1) Charlier, C.; Cousin, S. F.; Ferrage, F. Protein Dynamics from Nuclear Magnetic Relaxation;
Chem. Soc. Rev. 2016, 45, 2410.
(2) Houben, K.; Blanchard, L.; Blackledge, M.; Marion, D. Intrinsic dynamics of the partly unstructured PX domain from the Sendai virus RNA polymerase cofactor P; Biophys. J. 2007,
93, 2830.
(3) Abragam, A. Principles of Nuclear Magnetism; Oxford University Press: Oxford, 1961. (4) Kowalewski, J. In Nuclear Magnetic Resonance, Vol 40; KamienskaTrela, K., Ed. 2011; Vol. 40, p 205.
(5) Nicholas, M. P.; Eryilmaz, E.; Ferrage, F.; Cowburn, D.; Ghose, R. Nuclear Spin Relaxation in Isotropic and Anisotropic Media; Prog. Nucl. Magn. Reson. Spectrosc. 2010, in press.
(6) Nowakowski, M.; Saxena, S.; Stanek, J.; Zerko, S.; Kozminski, W. Applications of high dimensionality experiments to biomolecular NMR; Prog. Nucl. Magn. Reson. Spectrosc. 2015,
90-91, 49.
(7) Srb, P.; Nováček, J.; Kadeřávek, P.; Rabatinová, A.; Krásný, L.; Žídková, J.; Bobálová, J.; Sklenář, V.; Žídek, L. Triple resonance 15N NMR relaxation experiments for studies of intrinsically disordered proteins; J. Biomol. NMR 2017, 69, 133.
(8) Lawrence, C. W.; Showalter, S. A. Carbon-Detected 15N NMR Spin Relaxation of an Intrinsically Disordered Protein: FCP1 Dynamics Unbound and in Complex with RAP74; The
Journal of Physical Chemistry Letters 2012, 3, 1409.
(9) Neuhaus, D.; Williamson, M. P. The Nuclear Overhauser Effect in Structural and
Conformational Analysis; 2nd ed.; John Wiley & Sons: New York, 2000.
(10) Ferrage, F.; Reichel, A.; Battacharya, S.; Cowburn, D.; Ghose, R. On the measurement of N-15-{H-1} nuclear Overhauser effects. 2. Effects of the saturation scheme and water signal suppression; J. Magn. Reson. 2010, 207, 294.
(11) Lakomek, N.-A.; Ying, J.; Bax, A. Measurement of N-15 relaxation rates in perdeuterated proteins by TROSY-based methods; J. Biomol. NMR 2012, 53, 209.
(12) Khan, S. N.; Charlier, C.; Augustyniak, R.; Salvi, N.; Déjean, V.; Bodenhausen, G.; Lequin, O.; Pelupessy, P.; Ferrage, F. Distribution of pico- and nanosecond motions in disordered proteins from nuclear spin relaxation: a simple array of correlation times; Biophys. J. 2015,
109, 988.
(13) Farrow, N. A.; Zhang, O. W.; Szabo, A.; Torchia, D. A.; Kay, L. E. Spectral Density-Function Mapping Using N-15 Relaxation Data Exclusively; J. Biomol. NMR 1995, 6, 153.
(14) Kumari, P.; Frey, L.; Sobol, A.; Lakomek, N.-A.; Riek, R. 15N transverse relaxation measurements for the characterization of µs–ms dynamics are deteriorated by the deuterium isotope effect on 15N resulting from solvent exchange; J. Biomol. NMR 2018, 72, 125.
(15) Yuwen, T.; Skrynnikov, N. R. Proton-decoupled CPMG: A better experiment for measuring 15N R2 relaxation in disordered proteins; J. Magn. Reson. 2014, 241, 155.
(16) Pelupessy, P.; Espallargas, G. M.; Bodenhausen, G. Symmetrical reconversion: measuring cross-correlation rates with enhanced accuracy; J. Magn. Reson. 2003, 161, 258.
(17) Abyzov, A.; Salvi, N.; Schneider, R.; Maurin, D.; Ruigrok, R. W. H.; Jensen, M. R.; Blackledge, M. Identification of Dynamic Modes in an Intrinsically Disordered Protein Using Temperature-Dependent NMR Relaxation; J. Am. Chem. Soc. 2016, 138, 6240.
(18) Marsh, J. A.; Singh, V. K.; Jia, Z. C.; Forman-Kay, J. D. Sensitivity of secondary structure propensities to sequence differences between alpha- and gamma-synuclein: Implications for fibrillation; Protein Sci. 2006, 15, 2795.
(19) Yang, D. W.; Mok, Y. K.; Muhandiram, D. R.; Forman-Kay, J. D.; Kay, L. E. H-1-C-13 dipole-dipole cross-correlated spin relaxation as a probe of dynamics in unfolded proteins: Application to the DrkN SH3 domain; J. Am. Chem. Soc. 1999, 121, 3555.
(20) Lipari, G.; Szabo, A. Model-Free Approach to the Interpretation of Nuclear Magnetic Resonance Relaxation In Macromolecules 1. Theory and Range of Validity; J. Am. Chem. Soc. 1982, 104, 4546.
(21) Halle, B. The physical basis of model-free analysis of NMR relaxation data from proteins and complex fluids; J. Chem. Phys. 2009, 131.
(22) Ishima, R.; Nagayama, K. Quasi-spectral-density function-analysis for n-15 nuclei in proteins; J. Magn. Reson., Ser B 1995, 108, 73.
![Figure 6. Titration of Artemis (residue 480-675) with the DNA binding domain of Ligase-IV followed by 2D [ 1 H- 15 N]-HSQC spectra](https://thumb-eu.123doks.com/thumbv2/123doknet/14218087.483125/17.892.309.584.766.1019/figure-titration-artemis-residue-binding-ligase-followed-spectra.webp)