HAL Id: hal-02002732
https://hal.archives-ouvertes.fr/hal-02002732
Submitted on 31 Jan 2019
HAL is a multi-disciplinary open access
archive for the deposit and dissemination of
sci-entific research documents, whether they are
pub-lished or not. The documents may come from
teaching and research institutions in France or
abroad, or from public or private research centers.
L’archive ouverte pluridisciplinaire HAL, est
destinée au dépôt et à la diffusion de documents
scientifiques de niveau recherche, publiés ou non,
émanant des établissements d’enseignement et de
recherche français ou étrangers, des laboratoires
publics ou privés.
Chagas’ Disease
Alex Chaves Alberto, Gabriel Azevedo Limeira, Roberto Coury Pedrosa,
Vicente Zarzoso, Jurandir Nadal
To cite this version:
Alex Chaves Alberto, Gabriel Azevedo Limeira, Roberto Coury Pedrosa, Vicente Zarzoso, Jurandir
Nadal. ECG-Based Predictors of Sudden Cardiac Death in Chagas’ Disease. Computing in Cardiology,
Sep 2017, Rennes, France. �10.22489/cinc.2017.087-324�. �hal-02002732�
ECG-Based Predictors of Sudden Cardiac Death in Chagas’ Disease
Alex C. Alberto
1,2, Gabriel A. Limeira
2, Roberto C. Pedrosa
3, Vicente Zarzoso
4, Jurandir Nadal
21
Centro Federal de Educação Tecnológica Celso Suckow da Fonseca, Rio de Janeiro, Brazil
2
Universidade Federal do Rio de Janeiro, Rio de Janeiro, Brazil
3
Hospital Clementino Fraga Filho, Universidade Federal do Rio de Janeiro, Rio de Janeiro, Brazil
4
Université Côte d’Azur, CNRS, I3S Laboratory, Sophia Antipolis, France
Abstract
With nearly six million infected subjects, Chagas’ disease is becoming an alarming public health problem, especially in Latin America where it is endemic. This disease is caused by a parasite infecting heart tissue, which can degenerate into serious rhythm disturbances and high risk of sudden cardiac death (SCD). This study aims at stratifying the SCD risk in patients with Chagas’ heart disease (CHD). A database composed by 22 Holter ECG recordings from CHD patients with 11 alive and 11 SCD cases was studied. Classical heart rate turbulence (HRT) and heart rate variability (HRV) parameters in time domain were extracted from the signals divided in two 12 h periods (day and night). These parameters were used as input for two multivariate linear models – logistic regression (LR) and linear Fisher discriminant (LDA). When computed separately, HRT and HRV indices cannot properly discriminate alive from SCD patients with CHD. Their discrimination capability increases when HRT is combined with standard HRV indices and they are computed in night recordings, where vagal tonus is increased. Indeed, both resulting models included three parameters from the night period: turbulence slope, standard deviation of all NN intervals and the proportion of successive normal RR intervals with more than 50 ms. The best model (LDA) provided 82.4% accuracy, 87.5% sensitivity and 77.8% specificity.
1.
Introduction
Chagas’ disease is a parasitic disease caused by Trypanossoma cruzi, which is endemic in Latin America with nearly six million infected subjects, becoming an alarming public health problem. Due to immigration, it spreads to other regions and about 300,000 people are estimated to be infected only in the United States [1]. The parasite infects the heart tissues and causes an immune response, which affects myocardial contractile cells and nerve endings of the autonomic nervous system (ANS). The Chagas’ heart disease (CHD) is associated with
arrhythmias and high risk of sudden cardiac death (SCD). The early stages of the disease are characterized by the presence of multifocal premature ventricular contractions (PVC). The occurrence of SCD in early and intermediate stages of Chagas disease doubles or triples that observed in the most advanced stage, when ventricular dysfunction occurs [2].
Heart rate variability (HRV) is useful for assessing ANS action over the heart. The control of heart rate is due to balance of sympathetic and parasympathetic nervous system branches of the ANS. The degree of variability provides information about the autonomic control of the heart rate, and a significant relationship between ANS control and cardiovascular mortality including SCD is observed [3].
Developed by Schmidt et al. [4], heart rate turbulence (HRT) focuses on heartbeat’s response to a PVC. This technique describes the biological phenomenon of spontaneous short-term fluctuations in sinus cycle length that follow the occurrence of the PVC. The expected response is an immediate cardiac rhythm increase followed by a progressive decrease in subjects without abnormalities or disease. HRT mechanisms have not been fully identified, and have been attributed to the baroreflex response to hemodynamic changes caused by the PVC [5]. The turbulence trigger is the lower systolic blood pressure pulse related to the PVC, which is followed by an increased pulse due to the compensatory pause. This abnormal pressure variation is expected to trigger a baroreflex response. If ANS is intact, the HRT corresponds to its immediate response in the sinus node. However, in impaired autonomic heart rate control the reaction is weak or does not occur.
The HRT technique consists in the coherent average of tachogram segments using as anchors the short RR intervals due to each isolated PVC detected along the 24 h Holter ECG record. From this averaged tachogram, two indices are obtained: the turbulence onset (TO), that measures the immediate increase in heart rate; and the turbulence slope (TS), which measures the compensatory and progressive decrease in heart rate [4].
TO and TS are powerful indicators of SCD, particularly
when combined to other established parameters [4]. Some studies [5] show TS as an independent mortality predictor for subjects after post-infarction. Particularly in subjects with left ventricular ejection fraction (LVEF) below 30%, HRT indices showed to be powerful to stratify the risk of death [10]. Although HRT was proposed and validated for the assessment of patients after acute myocardial infarction, some studies point to TO and TS as useful parameters for risk stratification also in other cardiac diseases [7], including Chagas cardiomyopathy [5]. A possible limitation of the HRT approach is the use of the average response from Holter recordings over 24 h, which may neglect information of circadian rhythm variability [4].
This study aims at retrospectively analyzing 24 h Holter recordings from Chagas disease patients by HRT and HRV parameters. The respective parameters were obtained from 12 h periods corresponding to day and night, and evaluated by multivariate analysis to assess the risk of SCD.
2.
Material and methods
2.1.
Database
Seventy five Holter ECG records from patients with acute and chronic Chagas' heart disease were selected for the study, from a set of 410 recordings of the Hospital Universitário Clementino Fraga Filho, Rio de Janeiro, Brazil.
Table 1. Clinical stages of Chagas’ heart disease
Stage ECG Echocardiogram Heart Failure
A Abnormal Normal Absent
B1 Abnormal Abnormal, LVEF ≥45% Absent B2 Abnormal Abnormal, LVEF <45% Absent
C Abnormal Abnormal Compensable
D Abnormal Abnormal Refractory
Table 2. Studied Sample
Group Alive SCD Number of Patients 11 11 Male sex 4 7 Mean age 50.4 ± 14.3 60.5 ± 10.6 LVEF 54.5 ± 16.1 40 ± 13.2 Follow up (months) 141.3 ± 78.7
The resulting database contains 24 h records of ECG signals from patients with CHD (two channels, 128 Hz sample rate), including 49 survival subjects and 26 deaths (all causes), being only 11 of them caused by SCD. Such
patients were classified in a scale of disease evolution (Table 1), following the Brazilian Consensus on Chagas’ Disease [10] by three different tests: serology, Holter ECG, and echocardiography. The diagnosis of Chagas disease was based on Machado-Guerrero serology, in accordance with the World Health Organization guidelines [1].
For the present study, patients were grouped according to outcome as survivals (Alive) or SCD. To avoid bias in statistical analysis due to unpaired number of cases between the groups, the number of alive patients was reduced to 11 by random selection (Table 2).
2.2.
Heart Rate Turbulence
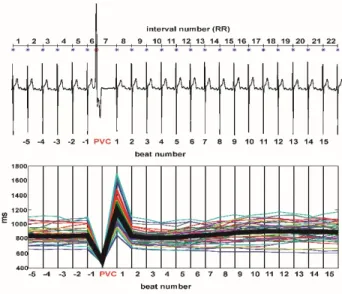
HRT analysis was performed with the original software developed by Schmidt et al. [4]. Each accepted tachogram (Figure 1) consisted of 22 RR intervals comprising a short one related to a PVC, preceded by five normal intervals, and the respective compensatory pause followed by 15 post-PVC intervals after the compensatory pause. The select tachograms from the same patient record were aligned around the PVC interval to produce coherent averaged segments used to measure
TO and TS parameters.
Figure 1 – (Top) ECG with isolated PVC and the TRC method. (Bottom) The coherent average tachogram used to calculate HRT indices is in thick black line.
TO was measured as the ratio between the first two
intervals after the PVC and the two ones just before the PVC, while TS is retrieved from the maximum slope of the regression line obtained over any five consecutive RR intervals within the 15 intervals after the PVC in the coherent average [4].
To take into account circadian changes in autonomic control, these parameters were also computed from the
first 12h (day) and the last 12h (night) of the 24h Holter recordings.
2.3.
Heart Rate Variability
The HRV analysis was assessed over the longest segment of RR intervals without ectopic beats (NN intervals) in each of the 12 h period considered. The analysis was performed in the time-domain following standard guidelines [3]. The following parameters were computed: mean heart rate (HR); standard deviation of all NN intervals (SDNN); the root mean square of the successive differences in NN intervals (RMSSD); number of NN intervals higher than 50 ms (NN50) and the ratio between the count of NN intervals higher than 50 ms divided by the total number of NN intervals (pNN50).
2
.4.
Statistical Analysis
All signal processing and statistical analysis were performed using MATLAB (The Mathworks, USA). Seven different parameters (TO, TS, HR, SDNN, RMSSD,
NN50 and pNN50) were obtained for two different
conditions (day and night), yielding a total of 14 features. The gaussianity of the predictors was verified using Kolmogorov-Smirnov test.
For feature selection, it was performed both univariate and bivariate analysis, which was performed on all combinations of predictor pairs. Multivariate analysis including more than two predictors was not considered to avoid overfitting due to limited sample size.
To find a linear combination of features between two chosen predictors logistic regression (LR) and Fisher linear discriminant (LDA) were applied. LR model was developed using a multinomial logistic regression from the Statistical Toolbox Package of MATLAB. For LDA model, Statistical Pattern Recognition Toolbox was used. Both models were evaluated in terms of sensitivity, specificity and overall accuracy.
3.
Results
The HRT parameters showed different prognostic outcome for a same patient over 24 h and 12 h recordings when considering abnormal values (TO > 0 and TS < 2.5), following the original criteria. Not all the available signals were useful to the analysis due to the need of at least one isolated PVC occurrence in the analyzed segment. Just nine Alive and eight SCD patients presented HRT results after the signal fractionation in day and night. The univariate analysis showed that all predictors had normal distribution, and no simple feature could discriminate between Alive and SCD groups.
The bivariate analysis led to three independent parameters retained in the resulting bivariate prognostic
models: TS, SDNN and pNN50, all at night period. These predictors appeared in the two best combinations: SDNN vs TS (Comb1) and pNN50 vs TS (Comb2).
The best result of the all six possible combinations of
TO and TS including day and night periods didn’t exceed
70.6% accuracy.
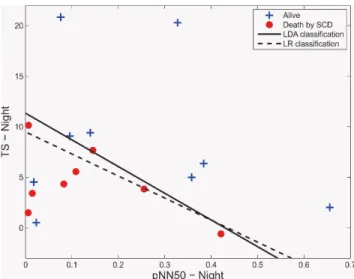
Figure 2 – Classification thresholds between Alive and SCD using LDA (line) and LR (line dashed). Predictors are SDNN and TS, both from night data.
Figure 3 – Classification thresholds between Alive and SCD using LDA (line) and LR (line dashed). Predictors are pNN50 and TS, both from night data.
The LDA model performed 20,000 iterations with 0.01 margin of error to separate the groups. Further, a logistic regression (LR) model was developed for the same parameters, considering the binomial distribution.
In the bivariate analysis, the two types of linear separation models were applied to find fitted outcomes in early stages of Chagas disease (Figures 2 and 3). The LDA model showed better performance indices than LR, when using pNN50 as a predictor (Table 3).
Table 3 – Performance indices of the two models used for separating Alive and SCD subjects
LR LDA SDNN vs TS (Comb 1) Sensitivity 87.5% 87.5% Specificity 77.8% 77.8% Accuracy 82.4% 82.4% pNN50 vs TS (Comb 2) Sensitivity 75.0% 87.5% Specificity 77.8% 77.8% Accuracy 76.5% 82.4%
4.
Discussion
The results obtained for 12 h data from day or night periods show changes in both TO and TS values. This suggests that the conventional estimation of these parameters as an average result from a 24 h period could cover different turbulence responses for diverse conditions in the circadian cycle, as originally suggested by Schmidt et al. [4]. On the other hand, shortening the period of analysis increases the chance of lack of results in CHD patients. Independent of the analyzed period, TO and TS parameters were not adequate for separating subjects according the clinical outcome after follow-up, since most of SCD subjects presented low risk HRT parameters.
The combination of HRT and HRV parameters yielded reasonable results, with both LR and LDA models using combinations of parameters SDNN, pNN50 and TS, in all cases measured in the night period. All these parameters are related to vagal activity. Particularly, pNN50 measures fast changes in HR and TS estimates the rate of HR deceleration after stimulus. Additionally, all parameters came from the night period of signals, when the vagal tonus is expected to increase. However, these parameters may not be considered as independent predictors of SCD.
The reduced sample size and the retrospective analysis could be considered as study limitations. The discriminant power of these models was tested in the same data used for model estimation. Further analysis over an increased sample is required to confirm the reproducibility of this study and the prediction capability of the selected features and models.
5.
Conclusion
When computed separately, HRT and HRV indices cannot discriminate Alive from SCD patients with Chagas disease. Their discrimination ability increases when HRT
is combined with standard HRV indices and they are computed in night recordings, when vagal tonus is increased. A novel approach that considers the segmentation of Holter signals in periods of day and night and combines HRT and HRV analysis in multivariate linear models allows risk stratification of sudden cardiac dead in Chagas’ heart disease.
Acknowledgements
This work received financial support from a Brazil/France cooperation CAPES/COFECUB, and the
Brazilian agencies CAPES, CNPq and FINEP. V. Zarzoso is a member of the Institut Universitaire de
France.
References
[1] Centers for Disease Control and Prevention. Chagas Disease. Available on line in CDC website accessed in 05/04/2017:http://www.cdc.gov/parasites/chagas/epi.html. [2] Rassi A Jr, Dias JC et al. Challenges and opportunities for
primary, secondary, and tertiary prevention of Chagas’ disease. Heart 2009; 95: 524–34.
[3] Task Force of the European Society of Cardiology and the North American Society of Pacing and Electrophysiology (1996) Heart rate variability: standards of measurement, physiological interpretation and clinical use. Circulation 93:1043–1065.
[4] Schmidt G, Malik M et al. Heart-rate turbulence after ventricular premature beats as a predictor of mortality after acute myocardial infarction. Lancet 1999:353:1390-1396. [5] Watanabe MA, Schmidt G. Heart rate turbulence: A 5-year
review. Heart Rhythm 2004:1:732-738.
[6] Barthel P, Schneider R et al. Risk stratification after acute myocardial infarction by heart rate turbulence. Circulation 2003: 108:1221.
[7] Savelieva I, Wichterle D et al. Heart Hate Turbulence After Atrial and Ventricular Premature Beats – Relation to Left Ventricular Function and Coupling Interval. PACE 2003:26:401-405.
[8] Ribeiro AL, Schmidt G et al. Heart Rate Turbulence in Chagas Disease, PACE 2003:26:406–410.
[9] Tundo F, Lombardi F et al. Heart rate turbulence and left ventricular ejection fraction in Chagas disease. Europace. 2005;7(3):197–203.
[10] Dias JCP, Ramos Jr. AN et al. Brazilian Consensus on Chagas Disease, 2015. Epidemiol. Serv. Saúde 2016:25:7-86.
Address for correspondence. Jurandir Nadal
Biomedical Engineering Program - COPPE Universidade Federal do Rio de Janeiro
PO Box 68510 - 21941-972 - Rio de Janeiro, RJ - Brasil. E-mail: jn@peb.ufrj.br