HAL Id: hal-02743339
https://hal.inrae.fr/hal-02743339
Submitted on 3 Jun 2020HAL is a multi-disciplinary open access archive for the deposit and dissemination of sci-entific research documents, whether they are pub-lished or not. The documents may come from teaching and research institutions in France or abroad, or from public or private research centers.
L’archive ouverte pluridisciplinaire HAL, est destinée au dépôt et à la diffusion de documents scientifiques de niveau recherche, publiés ou non, émanant des établissements d’enseignement et de recherche français ou étrangers, des laboratoires publics ou privés.
CFD study of climate conditions under greenhouses
equipped with photovoltaic panel
Hicham Fatnassi, Christine Poncet, Richard Brun, Marie Madeleine Muller,
Nadia Bertin
To cite this version:
Hicham Fatnassi, Christine Poncet, Richard Brun, Marie Madeleine Muller, Nadia Bertin. CFD study of climate conditions under greenhouses equipped with photovoltaic panel. International Conference on Agriculture Engineering ”New Technologies for Sustainable Agricultural Production and Food Security”, Feb 2013, Muscat, Oman. �10.17660/ActaHortic.2014.1054.6�. �hal-02743339�
1
CFD Study of Climate Conditions in Greenhouses Equipped with Photovoltaic Panels.
H. Fatnassi, C. Poncet, R. Brun, M. M. Muller
1
INRA- UMR ISA 1355 TEAPEA 400 Route des Chappes, BP167
06903, Sophia Antipolis Cedex, France
N. Bertin
2
INRA UR PSH 1115)
Domaine St Paul, Site Agroparc 84914 Avignon Cedex 9, France
Abstract
Predicting accurately the microclimate distributed inside greenhouse equipped with photovoltaic panels is a prerequisite for sustainable energy-saving greenhouse management. It can also help to improve designers in improving the design of these kinds of greenhouse while enhancing the radiation transmission inside.
This study is an essential prerequisite for research on crop namely those adapted to specific conditions in greenhouses equipped with photovoltaic panels.
With this mind, the solar radiation distribution, thermal air, water vapour and dynamics fields were simulated using the CFD model in two types of greenhouses (Asymmetric and Venlo) equipped with photovoltaic panels on their roof, as well as crop cover characteristics and the interactions between crops and airflow.
A detailed description of the thermal, dynamic and radiation fields inside the greenhouse were obtained and the analysis of data collected during this study show that (i) the solar radiation is more evenly distributed in the Venlo greenhouse than in the Asymmetric greenhouse. On an average, the solar radiation transmission in the Asymmetric greenhouse is 41.6% whereas that of the Venlo greenhouse is 46%. These luminosity values are not well adapted to plant requirements. (ii) For the same boundary conditions, the Venlo greenhouse has a cooler climate than the Asymmetrical greenhouse (-3°C in summer and -3°C in winter). This effect is beneficial in summer, but not interesting in winter. The various different openings in the Venlo greenhouse help to maintain temperature control and a homogeneous climate (temperature variation of 5°C in summer and 3.3°C in winter).
Keywords: CFD, Photovoltaic panels, climate, solar radiation
Introduction
The greenhouses are used to control the crop climate while protecting them from the various external factors i.e. weather, pests. Climate control involves the use of heating, ventilation and possibly cooling equipment which consume more energy.
With the current economic crisis in the field of greenhouses, which has seen energy prices soaring +56% for natural gas, + 86% for oil and 60% for butane-propane, energy-saving initiatives have increased [ADEME, 2007].
Many projects incorporating photovoltaic panels on the roofs have emerged in recent years, including agricultural projects such as "photovoltaic greenhouses" which can produce all their energy needs (Cossu et al., 2009).
Rather than opposing conventional agriculture greenhouse to those equipped with photovoltaic panels, it would appear more appropriate to look for ways to combine both
2
systems. Bearing this in mind, research has been carried out by INRA in order to design a viable photovoltaic greenhouse prototype by:
¬ Optimizing the geometry of the greenhouses with photovoltaic panels on roofs. ¬ Selecting innovative photovoltaic panels adapted to the agricultural system. ¬ Selecting crops that are best suited to this production system.
In this paper we have presented a CFD study of two different greenhouse geometries, Asymmetric and Venlo, with integrated photovoltaic panels on their roofs in order to choose which structures is less hostile to the plant.
Materials and methods
Two types of glass greenhouses have been studied:
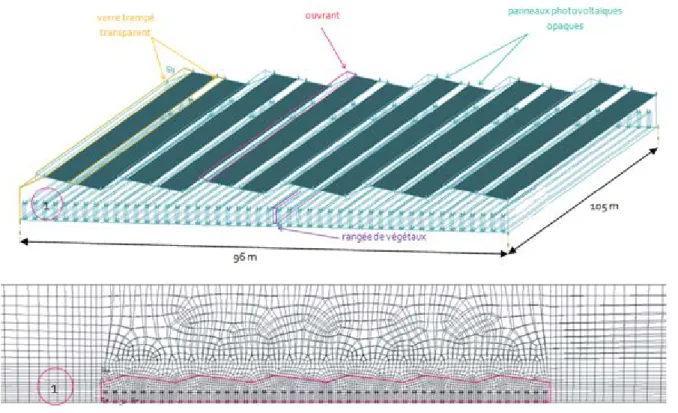
- An Asymmetric greenhouse that covers an area of 1 ha and is composed of six asymmetrical modules equipped with a continuous opening on the roof with a total of 6 continuous openings for the entire greenhouse. The photovoltaic panels are installed on the roof on the side where there is no opening (Figure 1).
- The other greenhouse is the same size and is a 10 Venlo type module, equipped with three continuous openings in the roof with a total of 30 continuous openings (Figure 2). The crop in both greenhouses is a mature tomato, two meters high placed in spaced rows. The physical properties of the different materials used in this study are summarized in table 1. Regarding the optical properties, we have assumed that the photovoltaic panels would be totally opaque to solar radiation and light transmission of the glass is 80%. This hypothesis is pessimistic, because we know that double glass panels have 10% of light transmission. On the other hand, we have not taken into account the structures of the greenhouses inducing shadows which in turn reduce the overall light transmission there in by 10%.
Boundary conditions
Our calculations were carried out on two typical days: summer and winter and on two wind directions: north-south and east-west.
For the typical summer day, 21st June, the solstice was chosen. The outside temperature of the air is assumed to be constant and equal to 33 °C and the external radiation is supposed to be direct: clear and cloudless weather.
For the typical winter day, January 10 was decided upon. The outside temperature of the air is assumed to be constant and equal to 10 ° C and external radiation is supposed to be direct. These boundary conditions are not very realistic, but they can be a basis to test the modeling of climate in extreme conditions.
Distributed micro-climate investigations such as solar radiation, temperature and air velocity inside the greenhouse are based on numerical simulations to solve the mass, momentum and energy conservation equations of the heat and mass transfers. Detailed equations have been more fully discussed in the paper of Fatnassi et al. (2003 & 2006).
The radiative exchanges were taken account by using the Solar Load Model available in Fluent which is the combination of a solar ray tracing algorithm and a radiation model called surface to surface (S2S).
The two illumination parameters used to describe the intensity of the solar load consist of two radiation terms, direct and diffused solar radiation.
The value of direct solar radiation was set to 860 W/m² for the summer day and 446 W/m² for the winter day. When the weather is clear and cloudless, diffused solar radiation is slight. Absorptivity and transmissivity are specified for direct visible and direct IR.
The computational domain corresponds to the greenhouse volume with its openings together with its immediate surrounding as described in Figures 1 and 2. The domain was meshed
3
according to an irregular Cartesian grid with a finer resolution imposed in the critical portions of the flow subject to a strong gradient.
The numerical resolution was carried out using the computer code based on a finite volume method (Fluent) which resolves the flow by integrating equations over the meshed studied domain. In addition, this CFD code was customized to simulate, the sensible and latent heat exchanges between the air and the crop, assimilated to the solid matrix of the porous medium, within each mesh of the crop canopy.
Results and discussions
Distribution of the solar radiation
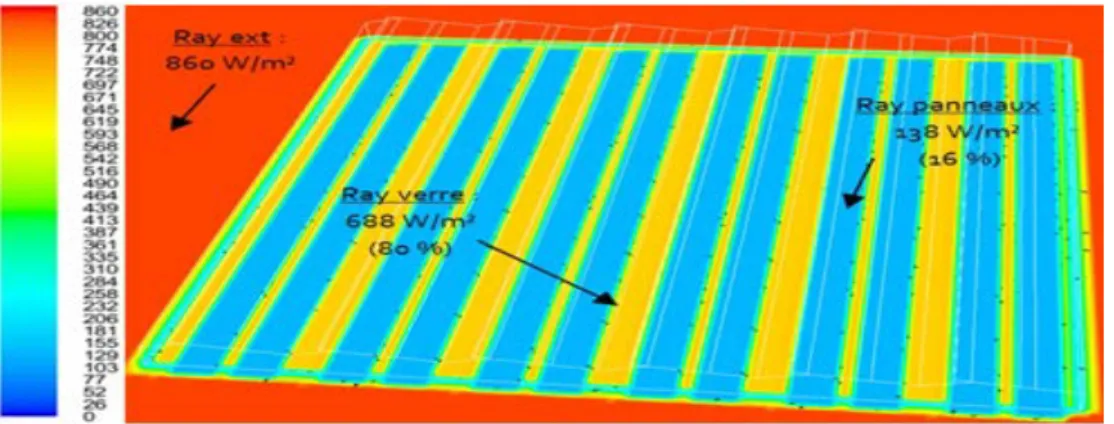
Figures 3 to 6 show the distribution of solar radiation in both types of greenhouses (Asymmetric and Venlo) and the environment at ground level. Rate of light transmission values are specified between brackets in the figures.
These figures show that the distribution of solar radiation inside the greenhouse is identical to the distribution pattern of the photovoltaic panels on the roof. There are bright bands separated by shaded bands. The transmission rate of the external solar radiation is about 80 % in the glass section and 16 % in the photovoltaic panels for the symmetric greenhouse.
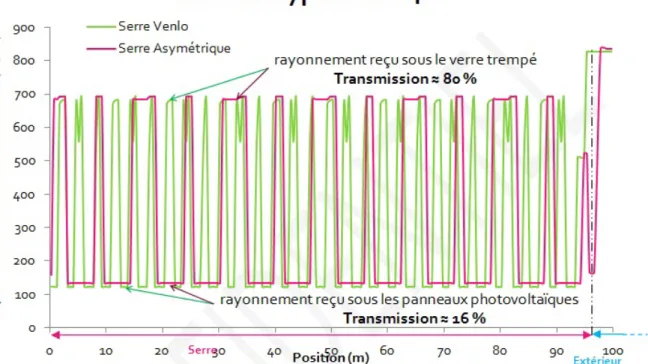
If we compare the distribution of solar radiation in the Asymmetric and Venlo greenhouses at 2 p.m on a typical summer day (Figure 7) and at noon on a the typical winter day (Figure 8), we found that:
- Despite the fact that photovoltaic panels are completely opaque to light, we obtained about 16% solar radiation below. This light is the radiation diffused by the glass and soil. Glass transmits 80% of outside solar radiation.
- On an average light transmission in the Asymmetric greenhouse is 41.6% while that in the Venlo greenhouse is 46%. This difference can be put down by the fact there are fewer opaque photovoltaic panels covering the roof in the Venlo greenhouse (50%) than in the asymmetric one (60%). The solar radiation is more evenly distributed in the Venlo greenhouse than in the asymmetric one.
These radiation values are not well adapted for most plants. They lead to crop yield loss and a pathogen development due to the effect of shade/light alternation (Minuto et al., 2009). Hence, there is a great need to develop either innovative solar panels capable of boosting the transmission of useful wavelengths for the crops or to seek vegetal species adapted to these specific abiotic conditions (Poncet et al, 2012).
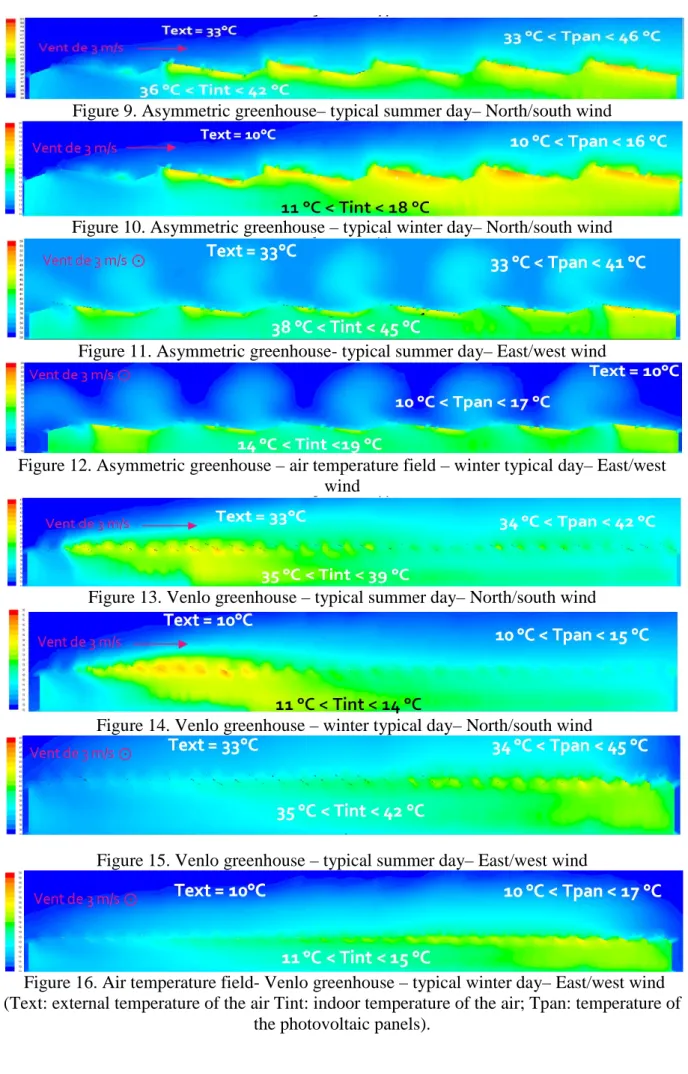
Distribution of temperature
Figures 9 to 16 present the temperature field of the Asymmetric and Venlo greenhouses and their environment on a vertical section in the center of the greenhouse, parallel to the prevailing wind direction in the first case, perpendicular to the dominant wind direction in the second case.
If we compare the temperature distribution in the Venlo and Asymmetric greenhouses over two typical days: summer and winter, and for two different prevailing winds (north/south and east/west), we observe that for the same boundary conditions, the average climate in the Venlo greenhouse is cooler than in the Asymmetrical one i.e. - 3 ° C in summer and - 3 ° C in winter compared to external temperature. This effect is beneficial in summer, but not in winter. The Venlo greenhouse openings facilitate temperature control and help to obtain a more homogeneous climate: temperature variation 5°C in summer and 3.3 ° C in winter. On the contrary, in the Asymmetric greenhouse, there is a confinement effect, but observed only on a typical summer day: variation of temperature 8.6 ° C in summer and 2.2 ° C in winter). The warm air does not exit easily from the greenhouse, thus causing a rise in
4
temperature in summer as well as overheating the photovoltaic panels, located at the southwards.
Moreover, we observed also that the climate in summer is cooler with an east/west prevailing wind than with a north/south one, whereas in winter the climate is warmer.
We also note the climate is more homogeneous in the Asymmetric greenhouse with an East/West prevailing wind than with a north/south prevailing wind.
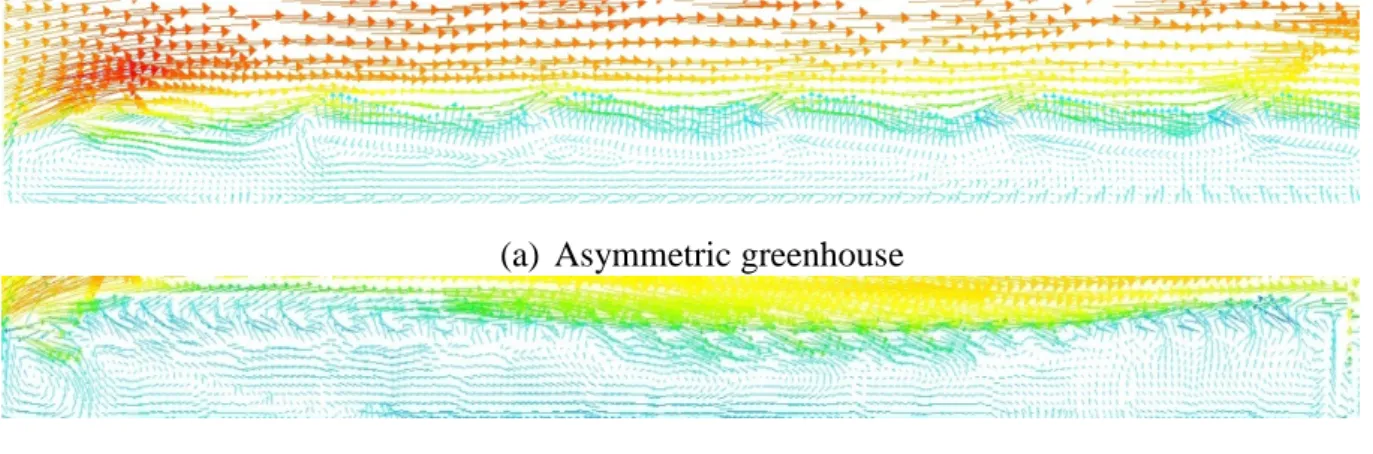
Dynamic Field
Figures 17 and 18 present the dynamic field in the Asymmetric and Venlo greenhouses and their environment in a vertical section in the center of the greenhouse, parallel to the prevailing wind direction in the first case, perpendicular to the prevailing wind direction in the second case. These results illustrate the general circulation of air inside the greenhouses and their surroundings.
In the case of a north/south prevailing wind (Figure XX), air enters through the north opening; which then heated inside the crop cover and then gradually through the south opening.
The general circulation of the air is different in the two greenhouses. The flow in the asymmetric greenhouse is predictable: air enters through the north opening and does not exit easily by the south opening due to the confinement effect. Six convective cells can be observed in each greenhouse module.
The flow in the Venlo greenhouse is a little surprising: air enters through the two openings located in the windward, through many openings located in the remaining three quarters of the greenhouse. It exits through the leeward openings in the first quarter of the greenhouse. The convective cells are more stretched and difficult to observe.
From the ground, up to 1 m above ground level, we noted that the air velocities were much lower. This high resistance to airflow was due to the high density of plants on this level. We also observed that the air moves from south to north i.e. in the opposite direction to the outside wind. This phenomenon has also been reported by Haxaire (1999) for a 400 m² two-span greenhouse equipped with roof opening and Wang and Deltour (1999) for a 1800 m² Venlo type greenhouse, equipped with leeward opening and Fatnassi et al. (2002-2006) for Canarien type and multi-span greenhouses .
In the case of a wind coming from east to west (Figure YY), the wind does not directly rush into the opening, but each opening receives the same amount of air.
Comparing the two types of greenhouses, Venlo and asymmetric, we observed that the air flow did not circulate in the same way in the two structures.
These figures also highlighted the decrease of the air velocity due to the effect of pressure loss induced by plants inside the crop cover, and the inversion of flow located in the leeward part of the greenhouse.
We also noted that the roof openings alternate as air inlets and outlets in the both greenhouses concerned.
Conclusion
In this study, we addressed the modeling of climate in greenhouses equipped with photovoltaic panels on their roof. To that end, we have considered a climate model based on energy, continuity and momentum equations.
Two types of greenhouses were studied: asymmetric and Venlo type greenhouses, photovoltaic panels with equal electric power were installed on their roofs.
A detailed description of the thermal, dynamic and radiation fields inside the greenhouses were obtained.
Analysis of data collected during this study shows that the solar radiation is more evenly distributed in the Venlo greenhouse than in the asymmetric one.
5
The distribution of solar radiation inside Venlo and asymmetric greenhouses is identical to the available pattern of photovoltaic panels on the roof. There are bright bands separated by shaded bands in both cases. The rate of transmission of external radiation is 41.6% in the Asymmetric greenhouse while it is 46% in the Venlo greenhouse. These values are not adapted to plant requirements.
Therefore the next step should focus on the use of Computational Fluid Dynamic tools to study strategies in order to increase solar radiation transmission within the greenhouses equipped with solar panels. A combination of changes in the design of the greenhouse and new photovoltaic panel technology: panels more transparent to solar radiation, should be undertaken and further research carried out thereafter.
References:
- [ADEME, 2007]
- Cossu, M., Murgia, L., Sanna, A., Caria, M. and Pazzona, A. 2009. Ecologically sustainable greenhouse using solar energy. Cloture 38(10): 90-95.
- Fatnassi H; Boulard T; Bouirden L (2003). Simulation of climatic conditions in full-scale greenhouse fitted with insect-proof screens. Agricultural and Forest Meteorology, Volume 118, , Pages 97-111.
- Fatnassi H.; Boulard T.; Poncet C. ; Chave M. (2006). Optimisation of greenhouse insect screening with Computational Fluid Dynamics. Biosystems Engineering 93 (3), 301-312
- Haxaire, R., 1999. Caractérisation et modèlisation des écoulements d’air dans une serre. Thèse de Doctorat, Université de Nice, Nice, p. 149.
- Minuto, G., Bruzzone, C., Tinivella, F., Delfino, G. and Minuto, A. 2009. Photovoltaics on greenhouse roofs to produce more enrgy. Informaore Arario Supplemento 65 (10): 16-19.
- Poncet, C., Muller, M.M., Brun , R. and Fatnassi, H. 2012. Photovoltaic greenhouses, non-sense or a real opportunity for the greenhouse systems?. Acta Hort. (ISHS) 927:75-79
- Wang, S., Deltour, J., 1999. Lee side ventilation induced air movements in a large multi-span greenhouse. J. Agric. Eng. Res. 74, 103–110.
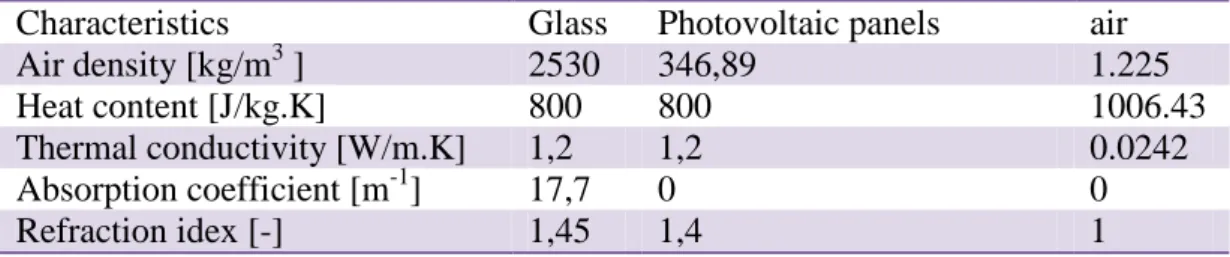
Table 1. Physical properties of materials
Characteristics Glass Photovoltaic panels air
Air density [kg/m3 ] 2530 346,89 1.225
Heat content [J/kg.K] 800 800 1006.43
Thermal conductivity [W/m.K] 1,2 1,2 0.0242 Absorption coefficient [m-1] 17,7 0 0
6
Figure 1 Geometry and mesh of the asymmetric greenhouse and its environment
7
Figure 3. Asymmetric greenhouse – solar radiation – typical summer day
Figure 4. Asymmetric greenhouse – solar radiation – typical winter day
Figure 5. Venlo greenhouse– solar radiation– typical summer day
8
Figure 7. Comparison of solar radiation on a typical summer day in both greenhouses
9
Figure 9. Asymmetric greenhouse– typical summer day– North/south wind
Figure 10. Asymmetric greenhouse – typical winter day– North/south wind
Figure 11. Asymmetric greenhouse- typical summer day– East/west wind
Figure 12. Asymmetric greenhouse – air temperature field – winter typical day– East/west wind
Figure 13. Venlo greenhouse – typical summer day– North/south wind
Figure 14. Venlo greenhouse – winter typical day– North/south wind
Figure 15. Venlo greenhouse – typical summer day– East/west wind
Figure 16. Air temperature field- Venlo greenhouse – typical winter day– East/west wind (Text: external temperature of the air Tint: indoor temperature of the air; Tpan: temperature of
10
(a) Asymmetric greenhouse
(b) Venlo greenhouse
Figure 17. Dynamic field –typical summer day– North/South wind
(b) Asymmetric greenhouse
(b) Venlo greenhouse