A. Della Martina and J.G. Hilborna),b)
Polymers Laboratory, Materials Department, Swiss Federal Institute of Technology, CH-1015 Lausanne, Switzerland
(Received 27 December 2000; accepted 2 May 2001)
This article describes the preparation of gradient porosity thermoset polymers. The technique used is based on polymerizing a solution of cross-linkable dicyclopentadiene and 2-propanol. The forming polymer being insoluble in 2-propanol, phase separation occurs. Subsequent drying of the 2-propanol gives porosities up to 80%. An apparatus was built to produce a gradient in 2-propanol concentration in a flask, resulting in polymerized gradient porosity rods. The resulting materials have been characterized by scanning electron microscopy (SEM) and density measurements. A mathematical model which allows prediction of the gradient produced is also presented.
I. INTRODUCTION
Functional graded materials are materials engineered with gradual transitions in microstructure and /or compo-sition. The motivation for producing gradient materials comes from functional performance requirements vary-ing with position within the element.1,2 Graded metals
and metal–ceramic composites have been widely studied for extremely demanding structural applications, such as aerospace or internal parts of high performance engines.3
Indeed such materials were mainly designed for in-creased resistance to thermal stresses. The different methods known to produce gradient materials can be classified in two categories: constructive processes and transport based processes.2 The first type consists in building the gradient, layer by layer, with the appropriate distribution of constituents. The second relies on natural transport phenomena such as diffusion or heat transfer to create the gradient. Gradient porosity materials have been produced mainly using spray coating4 or powder technology.5–7 Other reported techniques include self-propagating high-temperature synthesis8 or electro-chemical modification of porous preforms.9
Functionally gradient composites containing polymers have also been investigated. For example an epoxy/ carbon fiber gradient composite has been produced using a centrifugal method,10 and polyimide/aluminum and polyimide/copper gradient composites have been made by powder technology.11,12 For polymer/polymer
sys-tems the most important application is gradient refractive index optical fibers.13However, very little work has been
published in this area, and attention must be paid to ter-minology. The expression gradient polymers designates either a gradient in concentration of one monomer along a single chain of copolymer (also more adequately termed gradient copolymers),14 –16or functionally graded polymeric materials ( FGPM). The main techniques for producing FGPM are diffusion polymerization14 –17 and powder technology combined with compression mold-ing.18The first is limited to thin parts, and the second is difficult to apply to polymers and limited, for compaction reasons, to symmetrical shapes. Graded porosities are nevertheless quite common in polymers, density gradi-ents often being induced, more or less intentionally, by foaming processes such as reaction injection molding19
or phase inversion techniques.20 The porosity gradients
obtained with these two techniques arise from transport-based processes. To our knowledge no engineered gra-dient porosity polymers, produced via a constructive process, have been reported.
Recently we produced macroporous poly(dicyclopen-tadiene) ( PDCPD) via chemically induced phase separa-tion (CIPS).21 This technique consists of mixing a
polymerizable monomer with a nonreacting liquid sub-stance, which can be a low molecular weight liquid, a polymer, etc. The enthalpic and entropic changes of the system due to the polymerization of the monomer induce a change in solubility. If this substance is carefully cho-sen, the solubility change can be large enough for this substance to be soluble with the monomer but nonsoluble with the polymer. Such a substance will thus separate from a resulting polymer-rich phase generating a two-phase morphology. This principle has been described earlier as chemical cooling,22 polymerization-induced phase separation,23 reaction-induced phase separa-tion.24 –27Epoxy and cyanate systems with well-defined porosity have been produced after extraction of the a)
Address all correspondence to this author.
b)
Present address: The Ångstrom Laboratory, Uppsala University, S-75121 Uppsala, Sweden.
separated substance (low molecular weight liquids can be extracted by drying for example).28–31This substance is, in such cases, often referred to as a porogen, as it will template the final porosity.
In the case of highly cross-linked polymers such as divinylbenzene and PDCPD, the enthalpic and entropic changes induced by polymerization are large enough to induce phase separation over a wide range of initial po-rogen concentrations. This allows the preparation of ma-terials with closed porosity for low initial porogen concentrations and up to 80% open porosity for high porogen concentrations.21Thus, by creation of a gradient
in porogen concentration in the initial mixture, a full range of porosities can be envisaged in a single sample. To create this gradient, a technique similar to that used to produce gradient density columns has been adapted. The aim of the present work is to study the feasibility of this novel approach. The resulting gradient porosity bars are also anticipated to be helpful in understanding the phase separation mechanisms occurring with CIPS. In-deed, the concentration gradient produced along the sample allows monitoring of all the possible phase sepa-ration behaviors for the chosen polymerization condi-tions. The resulting materials will be characterized by density measurements and scanning electron micros-copy (SEM).
II. EXPERIMENTAL A. Materials
Dicyclopentadiene (DCPD: “Petroplast 94%” from Shell, 94% pure, mainly endo and containing stabilizer, trimers, and other products) was degassed (5 min under 1 mbar pressure and then purged with N2) and stored over 5-Å molecular sieves. 2-Propanol, dichloromethane, and 1,1⬘,2,2⬘-tetrachloroethane (purum) were used as re-ceived. The catalyst, RuCl2(p-MeC6H4CHMe2)( PCy3),
where Cy ⳱ cyclohexyl and abbreviated Ru-cat, was synthesized, according to Bennett and Smith32 and kindly supplied by A. Mu¨hlebach (Ciba Specialty Chemicals).
B. Preparation of the samples
On the basis of the general procedures for building liquid–liquid gradients,33 the samples were produced as
follows:
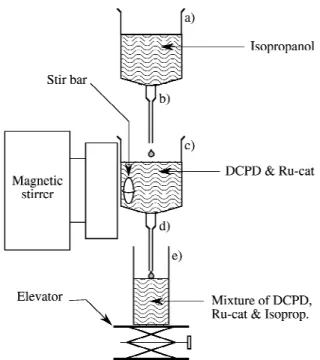
First the setup shown in Fig. 1 was prepared. This setup consisted of two stacked 30 ml Luer Syringes, the top one directly pouring into the bottom one. A 90°-tilted magnetic stirrer was mounted against the bottom syringe to induce the spinning of the magnetic stir bar immersed in it. The bottom syringe poured in a disposable 45 ml screw cap flask. Initially, the syringe needles were plugged.
Solutions of 10 wt% Ru-cat in either dichloromethane (for samples 1, 3, and 4) or 1,1 ⬘,2,2⬘-tetrachloroeth-ane (for sample 2) were prepared. A 20-ml volume of DCPD was then added to 2 ml of catalyst solution. For samples 3 and 4 only, after solubilization of the Ru-cat in the DCPD, the dichloromethane was evaporated by plac-ing the mixture under vacuum until no more boilplac-ing was observed. The mixtures were added into the bottom sy-ringe, and 20 ml of 2-propanol was added into the top syringe. The stirrer was then switched on and the needle stoppers removed. To avoid mixing in the receiving flask, the tip of the bottom needle was kept against the surface of the mixture by lowering the flask with the elevator.
After formation of the gradient, the flasks were sealed and placed for polymerization in a preheated oven at 80 °C for 20 h. The flasks were then broken and the samples dried under vacuum in an oven at 84 °C, for 3 days.
C. Characterization techniques
Samples 1 and 4 were sawed using a disk saw (0.5 mm thick) to obtain regular disks of 2-mm thickness. The density of the disks was obtained either by weighing them and determining their volume with a caliper (open porosity disks) or by using a Mettler Density Measure-ment Kit adapted to an AT261 DeltaRange balance (closed porosity disks). Sample 3 was notched along the axis and fractured at liquid-nitrogen temperature. FIG. 1. Schematic representation of the experimental setup used to produce gradient porosity poly(dicyclopentadiene) bars: (a) top sy-ringe; (b) top needle; (c) bottom sysy-ringe; (d) bottom needle; (e) flask.
The fracture surfaces were gold sputtered with a BIO-RAD Polar Division SEM Coating System, Sputter Coated E5400, operated at 1 kV with 20 mA current for 60 s to obtain a gold layer of 20 nm approximately. The gold-sputtered fracture surfaces were observed by SEM using a Phillips XLF-30 microscope equipped with a field emission gun operated at 2 kV.
III. RESULTS AND DISCUSSION A. Preparation of the samples
The experimental setup was first tested with pure DCPD (i.e., without catalyst) to match the flows of the top and bottom syringe, to produce the desired concen-tration gradient in the receiving flask. To empty the two syringes simultaneously, the flow through the bottom needle has to be approximately twice the flow through the top one. Ideally, the bottom syringe should empty just before the top one. Thus, at the end of the mixing, some pure 2-propanol is present at the top of the flask, indi-cating that the whole range of concentrations is obtained. This was achieved using smaller needles for the top sy-ringe as the 2-propanol is also less viscous than the DCPD + Ru-cat + CH2Cl2mixture. After trying different needle sizes, the best conditions for our setup were ob-tained with a 40 × 0.8 mm top needle and a 40 × 0.9 mm bottom needle.
Ruthenium-based catalysts are known to possess re-markable tolerance toward most functional groups,34 –36 including protic compounds, which would make them suitable candidates when using porogens such as 2-propanol. Previous work37–39 has shown that ruthenium arene phosphine complexes {of type [Ru(arene)Cl2(PR3)],
where R can be cyclohexyl, as used in this work, or isopropyl} are very efficient catalysts for the ring-opening metathesis polymerization ( ROMP) of technical grade DCPD, providing it contains acetylenic impurities. This catalyst is efficient at temperatures of 80 °C and higher, and the system possesses an excellent latency at room temperature (gelation takes several hours). This latency allows for the mixing and processing (production of the gradient in the flask) necessary before polymeri-zation. The flasks in which the gradient solution has been prepared must be carefully handled when sealed and dur-ing placement in the oven for polymerization. It is also important to close the flasks hermetically to allow po-lymerization temperatures above the boiling point of 2-propanol, thus avoiding solvent loss or bubble forma-tion inside the samples. For this work, the lowest effi-cient temperature, 80 °C, giving slow polymerization and allowing ample time for phase separation during po-lymerization, has been chosen.
The final porous samples were obtained after drying in a vacuum oven at 80 °C for 3 days. This temperature was
chosen to be well below the glass transition of the PDCPD matrix, thus avoiding softening which could re-sult in collapse of the foam structures.
The polymerization along with the accompanying phase separation (CIPS technique) of the gradient con-centration DCPD –2-propanol system resulted in gradient porosity bars, after removal of the 2-propanol. These measured approximately 25 mm in diameter and 60 mm in length. Other dimensions are feasible using other set-ups and different amounts of products, but attention must be paid in adjusting the flow conditions to obtain reason-able processing times. Processing times should not be too fast to allow for good mixing. On the other end, proc-essing times are not limited, except for the operator’s comfort, as the latency of the catalyst should allow for even hours-long processing. Large gradient pieces, for ex-ample, should be feasible with scaled equipment, and particularly larger needles, to avoid too long processing times. Equation (9) of Appendix A gives the initial volu-metric concentration of 2-propanol along the sample for a setup similar to the one used in this work ( Fig. 1). With the matching of the parameters of this equation to the final desired material, any monotonic gradient can be designed. Moreover, if the desired gradient should start with a fixed 2-propanol concentration⫽ 0 (i.e. a final bar starting with a desired non-null porosity), Eq. (9) can be recalculated with different initial conditions when solving Eq. (4).
When sample 1 was sawed for density measurements, macroscopic holes were observed inside the bar, result-ing from the boilresult-ing of dichloromethane durresult-ing the polymerization of the DCPD. To avoid this, tetrachloro-ethane, which has a higher boiling point, was used for sample 2. However, sample 2 remained soft after po-lymerization, owing to plasticization of the matrix by the tetrachloroethane. In this case, the plasticized matrix was not rigid enough to support the surface tensions produced by drying. These induced a collapse of the microstruc-tures formed by phase separation, resulting in macro-scopic shrinkage of the bar. Finally, it was decided to use dichloromethane to solubilize the catalyst in the DCPD, and when a homogeneous solution was obtained, the di-chloromethane was evaporated before using the mixture to build the gradient. After complete evaporation of the dichloromethane, i.e., when no more boiling was ob-served under vacuum, no precipitation of the catalyst in the DCPD was observed.
Samples 3 and 4 were not perfectly regular, the cross-section being slightly different along the axis of the bars. These variations arise from the different phase separation mechanisms and the different final morphologies pro-duced in the sample, depending on the initial local 2-propanol concentration. At the bottom of the bars, i.e., at low 2-propanol concentrations, precipitation of 2-propanol droplets into a PDCPD matrix occurs. In this
dynamic process which is in competition with the po-lymerization of the matrix, some 2-propanol is trapped into the matrix and then extracted during the drying step, resulting in shrinkage of the matrix. Higher in the bar, at higher 2-propanol concentrations, PDCPD droplets pre-cipitate into liquid 2-propanol. Since the diffusion of the precipitating substance is not limited, the phase separa-tion is almost complete. In this case, the final PDCPD contains very little 2-propanol and the shrinkage on dry-ing is therefore negligible. As the limit between these different parts of the bars might not be always perfectly perpendicular to the axis (presumably due to some con-vection inside the flask), the different shrinkage of the different parts of the bars might induce some slight tilting of the bars, as could be seen with sample 1.
B. Density of the gradient rod
One of the goals of this work was to be able to design the final gradient. Therefore, the gradient porosity mate-rials will be compared with an expected density esti-mated as follows. Using density results obtained earlier with bulk samples of fixed 2-propanol concentration,21a theoretical porosity gradient can be deduced from the calculated 2-propanol concentration gradient Fig. 2.
First the 2-propanol volumetric concentration profile set in the flask can be plotted using Eq. (9) (Appendix A) with the measured top and bottom flow rates, the initial volume in the bottom syringe, and the real dimensions of the flask: Qb⳱ 2.1168 ml/min ⳱ 35.28 l/s; Qt ⳱ 1 ml /min ⳱ 16.67 l/s; V0 ⳱ 19.8 ml ⳱ 19⬘800 l; rf⳱ 12.7 mm.
The density obtained earlier with bulk samples is plot-ted in Fig. 3 as a function of the initial 2-propanol con-centration. Two linear functions have been fitted to these results, one for each of the two mechanisms of phase separation, namely the precipitation of 2-propanol
droplets into a PDCPD matrix and the precipitation and agglomeration of PDCPD particles into the 2-propanol. These two mechanisms have different kinetics, so that the final densities produced by CIPS show different lin-ear dependence on composition.
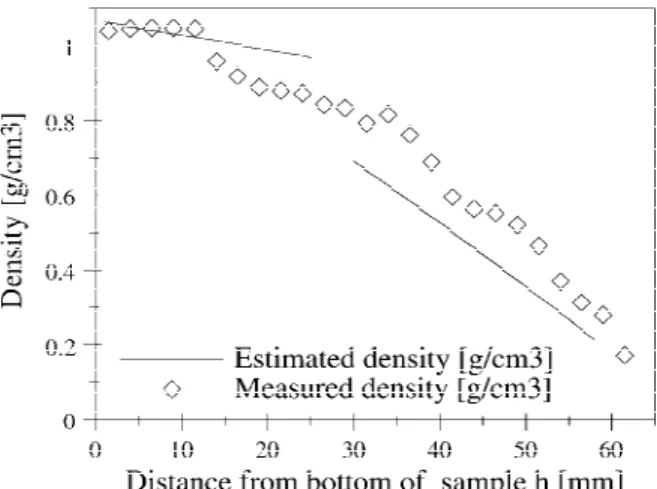
Applying the fitted linear dependences form in Fig. 3 to the concentration profile given in Fig. 2 gives an es-timation of the density that should be found along the samples. This estimated density profile and the density measurements performed on the slices of sample 4 are given in Fig. 4.
The functions in Figs. 3 and 4 are shown for the con-centration domains for which bulk samples were made, without extrapolation.
The measured density along the sample roughly fol-lows the predicted gradient. The first 10 mm of the bar, however, does not show measurable decrease in density
FIG. 3. Densities measured and linear fitting for the bulk samples. The linear functions are the following: for the low 2-propanol contents, density⳱ 1.0654 − 0.0031558(vol% 2-propanol), R ⳱ 0.99249; for the high 2-propanol contents, density⳱ 1.1653 − 0.012782(vol% 2-propanol), R⳱ 0.996.
FIG. 2. Predicted volumetric concentration of 2-propanol along the axis of the samples.
FIG. 4. Estimated density profile along the axis of the samples (con-tinuous line) and density of sample 4 (lozenges).
(result confirmed by the lack of pores observed by SEM ). This suggests that the initial stages of the mixing in the bottom syringe, when a large volume of mixture is processed, are not very efficient. If the 2-propanol that has poured form the beginning of the mixing has not formed porosity in the produced gradient, it must have accumulated in the bottom syringe and the concentra-tion of 2-propanol must have increased in a certain fraction of the volume of the mixture (very likely the top one). When that higher 2-propanol concentration fraction of mixture pours in the flask, a jump in porosity is ex-pected. This density drop is shown by Fig. 4, at h≈13 mm. The measured density then decreases as pre-dicted. For the same reasons, the transition between the two regimes of phase separation (2-propanol droplets precipitation and PDCPD particles precipitation) is also shifted higher in the flasks than expected. According to the densities measured for the slices of sample 4, this transition occurs just above h⳱ 30 mm, an observation confirmed by SEM. Nevertheless, the first bulk sample with an agglomerated particles morphology was obtained for 36.5 vol% 2-propanol. According to the predicted 2-propanol gradient, this concentration should have been found at around h⳱ 29.5 mm. This implies that this transition should have occurred before h⳱ 29.5 mm. Moreover, this transition was expected to be accompa-nied by a drop in density, whereas the measured density profile for the bar is continuous. Higher in the bar the measured densities again decrease roughly according to the prediction.
Some of the discrepancy between the predicted density gradient and the measured density profile might also arise from convection, which mixes fractions of solution of different concentration, in the flask during the early stages of the polymerization, when the viscosity is low.
This convection can probably be avoided by adding a nonreacting polymer in the mixture, thus increasing the viscosity of the system. Attention must be paid to the final microstructure, however, as the increase in viscosity might slightly change the phase separation behavior. Of course if the viscosity is increased too much, the setup used in the present work, which takes advantage of grav-ity for mixing the initial components and filling the re-ceiving flask, might not work. In this case, as well as for industrial scale up, a system with pumps to feed the mixer and to fill the mold can be envisaged. Better mix-ing conditions should also probably allow better fit of the resulting gradient to the prediction given by the model.
C. Microstructure of the gradient rod
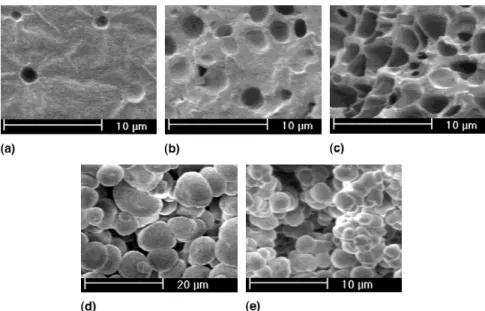
Five SEM pictures of the morphology along sample 3 are given in Fig. 5. The observed microstructures suggest nucleation and growth phase separation mechanisms. At low 2-propanol concentration, i.e., at short distances from the bottom of the sample, the precipitation of 2-propanol droplets in a continuous PDCPD matrix can be deduced. As the concentration of 2-propanol increases, together with distance from the bottom of the sample, the fraction of porosity increases. The estimated 2-propanol concen-tration for h⳱ 26 mm [Fig. 5(c)] corresponds to a con-centration for which no result could be deduced from the bulk samples (blank region in the middle of the graph shown in Fig. 4). The critical point, i.e., the point separating the two nucleation and growth regimes (2-propanol droplets into a polymer-rich phase and PDCPD droplets into 2-propanol-rich solution) was ex-pected to be in this region. It can be seen that as the concentration of 2-propanol approaches this critical point, the porosity increases dramatically. Higher in the bar and above the critical point, the reversed precipitation
mechanism apparently occurs. Precipitation of PDCPD droplets in 2-propanol leads to the formation of a mor-phology consisting of agglomerated particles.
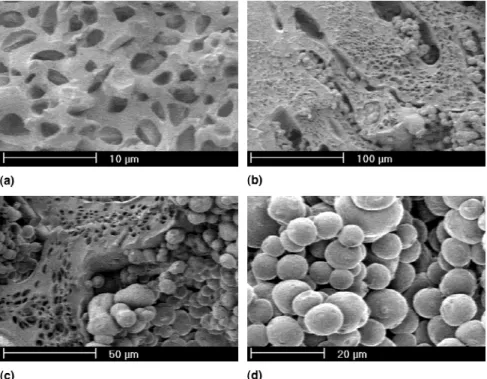
However, the cocontinuous morphology which might result from spinodal decomposition was never observed. For the 2-propanol composition of 30.9 vol%, the bulk sample showed precipitated 2-propanol droplets in PDCPD. Our calculated model predicted that this con-centration should have been found at h⳱25 mm in the gradient bar. In the bulk sample with 36.5 vol% 2-propanol, concentration expected at h⳱ 30 mm in the bar, agglomeration of PDCPD particles was observed. This suggested that eventual spinodal decomposi-tion should have occurred between these heights in the gradient bar. Figure 6 shows four SEM pictures of that region.
In the region where spinodal decomposition was ex-pected, an interpenetration of the two morphologies re-sulting from nucleation and growth can be observed. The commonly accepted generic phase diagram of chemically induced phase separation for this system21suggests that, with equilibrium conditions, spinodal decomposition should occur for at least one composition. Spinodal de-composition is a phase separation mechanism that does not proceed via nucleation and growth and, thus, does not have to overcome a nucleation energy to start. Polymer-rich and porogen-Polymer-rich regions are formed by local fluc-tuations of the concentration. The low polymerization temperature used here gives a slow polymerization rate, and when the spinodal decomposition starts, time enough is given to the system to promote nucleation within these
regions in which the porogen concentration is shifted away from the critical composition. Then, as the nucle-ated droplets/particles have a higher growth rate than the spinodal morphology, they overcome it and finally oc-cupy all the volume. The higher growth rate of the nucle-ated droplets/particles arises from the diffusion rates of the 2-propanol with respect to PDCPD, which are higher in the case of the formation of the morphology arising from nucleation and growth than for the building of the spinodal morphology. In the first case, diffusion follows the concentration gradient as in the second; the diffusion must go against the concentration gradient.40
IV. CONCLUSION
A novel technique to prepare gradient porosity mate-rials has been described. This technique is based on chemically induced phase separation of a gradient con-centration mixture obtained using an own-developed ap-paratus, based on a technique similar to that used to produce gradient columns. This apparatus consists of two syringes one pouring 2-propanol in the one contain-ing the precursors of the PDCPD, a stir bar becontain-ing set in the latter, pouring the mixture into a sealable flask. The key requirements to the success of this technique are the choice of the porogen, which has to be soluble with the monomer but insoluble with the polymer, the resistance of the catalyst to the porogen, and the adjustments of the flow conditions to give the desired final gradient. The final porosities produced ranged from 0 up to 83%, with open morphologies for total porosities of 20% and up. A
model is presented describing the gradient formation in the bar. This model allows an approximation of the final densities along the bar. The SEM study showed that, with the system and conditions used, microstructures arising directly from spinodal decomposition could not be observed.
ACKNOWLEDGMENTS
A. Mu¨hlebach, A. Hafner, and P.A. van der Schaaf (Ciba Specialty Chemicals Inc., Additives Research Dept., Basel, Switzerland) are gratefully acknowledged for synthesizing and kindly supplying the catalyst. The Swiss National Science Foundation Project No. 2000-53872.98 is gratefully acknowledged for financial support.
REFERENCES
1. A. Neubrand and J. Ro¨del, Z. Metallk. 88, 358 (1997). 2. A. Mortensen and S. Suresh, Int. Mater. Rev. 40, 239 (1995). 3. B.H. Rabin and I. Shiota, MRS Bull. 20, 32 (1995).
4. D. Prinz, V. Arnold, H-P. Buchkremer, A. Kuhstoss, P. Neumann, and D. Sto¨ver, in Functionally Graded Materials 1998, confer-ence held in New Town Hall, Dresden, Germany, Oct. 26 –29, 1988, edited by W.A. Kaysser (Trans Tech Publications Ltd., Uetikon-Zuerich, Switzerland, 1999), p. 59.
5. W.A. Kaysser and B. Ilschner, MRS Bull. 20, 22 (1995). 6. R. Watanabe, MRS Bull. 20, 32 (1995).
7. C-W. Hong, in Functionally Graded Materials 1996, conference held in AIST Tsukuba Research Center, Tsukuba, Japan, Oct. 21–24, 1996, edited by I. Shiota and Y. Miyamoto (Elsevier Sci-ence B.V., Amsterdam, The Netherlands, 1997), p. 29.
8. I.P. Borovinskaya, A.G. Merzhanov, and V.I. Uvarov, in
Func-tionally Graded Materials 1998, conference held in New Town
Hall, Dresden, Germany, Oct. 26–29, 1998, edited by W.A. Kaysser (Trans Tech Publications Ltd., 1999), p. 151. 9. A. Neubrand, R. Jedamzik and J. Ro¨del, in Functionally Graded
Materials 1996, conference held in AIST Tsukuba Research
Cen-ter, Tsukuba, Japan, Oct. 21–24, 1996, edited by I. Shiota and Y. Miyamoto ( Elsevier Science B.V., Amsterdam, The Nether-lands, 1997), p. 233.
10. C.R. Choe, M. Park, and N-J. Lee, in Proc. Int. Conf. Comp.
Mater. Energy (Technomic, Lancaster, Pa., 1995), p. 293.
11. M. Omori, H. Sakai, A. Okubo, and T. Hirai, in FGM ’94
Sympo-sium, edited by B. Ilschner and N. Cherradi, conference held in
Lausanne, Switzerland, Oct. 1994 ( Presses Polytechniques et Uni-versitaires Romandes, Lausanne, Switzerland, 1994), p. 667. 12. M. Omori, A. Okubo, G.H. Kang, and T. Hirai, in Functionally
Graded Materials 1996, edited by I. Shiota and Y. Miyamoto,
conference held in AIST Tsukuba Research Center, Tsukuba, Japan, Oct. 21–24, 1996, (Elsevier Science B.V., Amsterdam, The Netherlands, 1997), p. 767.
13. T. Ishigure, E. Nihei, and Y. Koike, Appl. Opt. 33, 4261 (1994). 14. M. Kryszewski, Polym. Adv. Technol. 9, 244 (1998).
15. J-H. Liu and H-T. Liu, Polymer 38, 1251 (1997).
16. C.F. Jasso, J.J. Martinez, E. Mendizabal, and O. Laguna, J. Appl. Polym. Sci. 58, 2207 (1995).
17. G. Akovali, K. Biliyar, and M. Shen, J. Appl. Polym. Sci. 20, 2419 (1976).
18. K. Schulte and A. Poeppel, in Functionally Graded Materials
1998, edited by W.A. Kaysser, conference held in New Town
Hall, Dresden, Germany, Oct. 26–29, 1998 ( Trans Tech Publica-tions Ltd., Uetikon-Zuerich, Switzerland, 1999), p. 101.
19. H. Ehbing and W. Michaeli, in Functionally Graded Materials
1998, edited by W.A. Kaysser, conference held in New Town
Hall, Dresden, Germany, Oct. 26 –29, 1998 (Trans Tech Publica-tions Ltd., Uetikon-Zuerich, Switzerland, 1999), p. 107. 20. S. Pereira Nunes, Trends Polym. Sci. 5, 187 (1997).
21. A. Della Martina, J.G. Hilborn, and A. Mu¨hlebach, Macromol-ecules 33, 2916 (2000).
22. K. Nakanishi, J. Porous Mater. 4, 67 (1997).
23. G.E. Elicabe, H.A. Larrondo and R.J.J. Williams, Macromol-ecules 31, 8173 (1998).
24. J. Borrajo, C.C. Riccardi, R.J.J. Williams, H.M. Siddiqi, M. Dumon, and J.P. Pascault, Polymer 39, 845 (1998).
25. E. Girard-Reydet, H. Sautereau, J.P. Pascault, P. Keates, P. Navard, G. Thollet, and G. Vigier, Polymer 39, 2269 (1998).
26. D. Chen, J.P. Pascault, H. Sautereau, and G. Vigier, Polym. Int. 32, 369 (1993).
27. P.A. Oyanguren, P.M. Frontini, R.J.J. Williams, G. Vigier, and J.P. Pascault, Polymer 37, 3087 (1996).
28. J. Kiefer, J.G. Hilborn, and J.L. Hedrick, Polymer 37, 5715 (1996).
29. J. Kiefer, J.G. Hilborn, J-A.E. Manson, Y. Leterrier, and J.L. Hedrick, Macromolecules 29, 4158 (1996).
30. J. Kiefer, J.G. Hilborn, J.L. Hedrick, H.J. Cha, D.Y. Yoon, and J.C. Hedrick, Macromolecules 29, 8546 (1996).
31. J. Kiefer, J.L. Hedrick and J.G. Hilborn, in Macromolecular
Ar-chitectures, edited by J.G. Hilborn (Adv. Polym Sci. 147, Springer
Verlag, Berlin, Germany, 1999), p. 161.
32. M.A. Bennett and A.K. Smith, J. Chem. Soc., Dalton Trans. 233 (1974).
33. ASTM standard D 1505– 68.
34. W.J. Feast and D.B. Harrison, J. Mol. Catal. 65, 63 (1991). 35. B.M. Novak and R.H. Grubbs, J. Am. Chem. Soc. 110, 960
(1988).
36. B.M. Novak and R.H. Grubbs, J. Am. Chem. Soc. 110, 7542 (1988).
37. A. Mu¨hlebach, P.A. Vanderschaaf, A. Hafner, and F. Setiabudi, J. Mol. Catal. A: Chem. 132, 181 (1998).
38. A. Hafner, A. Mu¨hlebach, and P.A. Vanderschaaf, Angew. Chem., Int. Ed. Engl. 36, 2121 (1997).
39. A. Hafner, P.A. van der Schaaf, A. Mu¨hlebach, P. Bernhard, U. Schaedeli, T. Karlen, and A. Ludi, Prog. Org. Coat. 32, 89 (1997).
40. D.A. Porter and K.E. Esterling, Phase Transformation in Metals
and Alloys (Chapman & Hall, London, U.K., 1992).
APPENDIX A
The gradient of 2-propanol concentration that should build up in the receiving flask can be predicted using the following approach.
In the system depicted by Fig. 1, let us consider that the concentration of the mixture poured in the flask at a certain time t is the same as the one in bottom syringe at the same time t, neglecting the transit through the bottom needle. Let us also consider that the flows in and out of the bottom syringe, respectively named top and the bot-tom flows, are constant. In such a case, to obtain the concentration along the height of the bottle, it is suffi-cient to calculate the concentration variation with time in the bottom syringe and transform this result using the bottom flow and the dimensions of the flask. Consider-ing Fig. 1 again, it can be observed that, in the bottom
syringe, the only variation of volume of DCPD is due to the bottom flow. Thus the variation of volume of DCPD in the bottom syringe is given by
dVD= −CD(t)Qbdt , (1)
where dVDis the increment of volume of DCPD in the bottom syringe, CD(t), the volumetric concentration of
DCPD in the bottom syringe at time t, Qb, the bottom
volume flow rate, and dt, the increment of time. In the present case
CD共t兲= VD共t)
Vtot共t兲 , (2)
where VD(t) is the volume of DCPD in the bottom sy-ringe at time t and Vtot(t) is the total volume in the bottom
syringe at time t and
Vtot(t)⳱ V0+ (Qt − Qb)t , (3)
where VI(t) is the volume of 2-propanol in the bottom syringe at time t, V0, the initial volume in the bottom syringe, and Qt, the top volume flow rate.
Replacing Eqs. (2) and (3) into Eq. (1) gives dVD
dt =ⳮ
Qb
V0+共Qt −Qb兲t
VD共t兲 . (4)
Solving this first-order differential equation, with ini-tial condition VD(t⳱ 0) ⳱ V0, gives
VD共t兲=V0
冉
Qb Qt−Qb +1冊
关V0+共Qt−Qb兲t兴冉
− Qb Qt−Qb冊
. (5)Introducing this result, together with Eq. (3), into Eq. (2) renders the volumetric concentration of DCPD in the bottom syringe: CD共t兲 =
冋
V0 V0+共Qt−Qb兲t册
冉
Qb Qt−Qb+ 1冊
, (6)and obviously the volumetric concentration of 2-propanol in the bottom syringe, CI(t), is
Ct共t兲 =1 −
冋
V0 V0+共Qt−Qb兲t册
冉
Qb Qt−Qb +1冊
. (7) Now the concentration of 2-propanol should be calcu-lated versus the height in the sample. This can be done by correlating the level of mixture in the flask h and time t:rf 2 h=Qbt⬍=⬎ t= rf 2 h Qb , (8)
where rfis the radius of the base of the flask and h is the height in the sample level of mixture.
Injecting this Eq. (8) into Eq. (7) gives
CI共h兲=1−