Publisher’s version / Version de l'éditeur:
Vous avez des questions? Nous pouvons vous aider. Pour communiquer directement avec un auteur, consultez la Questions? Contact the NRC Publications Archive team at
[email protected]. If you wish to email the authors directly, please see the first page of the publication for their contact information.
https://publications-cnrc.canada.ca/fra/droits
L’accès à ce site Web et l’utilisation de son contenu sont assujettis aux conditions présentées dans le site LISEZ CES CONDITIONS ATTENTIVEMENT AVANT D’UTILISER CE SITE WEB.
International Conference and Exhibition on Performance of Ships and Structures
in Ice 2008, ICETECH 2008, pp. 391-398, 2008
READ THESE TERMS AND CONDITIONS CAREFULLY BEFORE USING THIS WEBSITE.
https://nrc-publications.canada.ca/eng/copyright
NRC Publications Archive Record / Notice des Archives des publications du CNRC :
https://nrc-publications.canada.ca/eng/view/object/?id=1e074d90-b921-4331-8ced-a0f6bcbf0bd7
https://publications-cnrc.canada.ca/fra/voir/objet/?id=1e074d90-b921-4331-8ced-a0f6bcbf0bd7
NRC Publications Archive
Archives des publications du CNRC
This publication could be one of several versions: author’s original, accepted manuscript or the publisher’s version. / La version de cette publication peut être l’une des suivantes : la version prépublication de l’auteur, la version acceptée du manuscrit ou la version de l’éditeur.
Access and use of this website and the material on it are subject to the Terms and Conditions set forth at
Ice scouring in a large flume: test set-up and preliminary observations
Ice scouring in a large flume: Test set-up and preliminary observations
Paul D. Barrette
Canadian Hydraulics Centre, National Research Council, Ottawa, ON, Canada
Garry W. Timco
Canadian Hydraulics Centre, National Research Council, Ottawa, ON, Canada
ABSTRACT
This paper describes an experimental set-up and the procedures used to investigate seafloor scouring by ice ridges in a 6 m long flume. Unlike in previous investigations, conducted in conventional test flumes or in a centrifuge, this set-up uses real ice. Its footprint is 1 m2. It also incorporates instrumentation to monitor stress distribution in the sediments during scouring, while acquiring deformation profiles of the sediment column. Other instruments include a displacement transducer to measure the vertical motion of the ice, a pore pressure transducer and a few cameras to study keel dynamics. The procedures and results of one fully instrumented test are presented.
KEY WORDS: Scour; ice ridges; tactile sensors; stress distribution; sand displacement.
INTRODUCTION
Moving sea ice ridges are known to scour the seabed in shallow waters, which results in significant trenches and long scour marks. Offshore oil and gas facilities often use pipelines to shore and these pipelines, or other sub-sea installations, are susceptible to being struck by the keel of these ice features. The general approach to avoid damage is to bury the pipeline in the seabed below the deepest scour, with additional allowance for sub-scour soil deformation, which can also load the pipeline. This paper describes an experimental program that was designed to clarify the mechanisms involved in ice scouring of a coarse sand.
PREVIOUS EXPERIMENTAL STUDIES
Much of our current knowledge about ice scouring was generated from laboratory studies. To better appreciate the relevance of the work described in this paper, a survey of the open literature was carried out and is summarized in this section. These studies are divided into those that were done in a conventional test flume or basin, and those that were done in a centrifuge. An outline of field investigations is also provided.
Conventional testing
The experimental work of Harrison (1972) on the soil failure of an inclined plane delimiting the edge of a passive soil wedge, using ‘plate-grousers’ up to 0.5 m in width, is one of the earliest study relevant to ice scouring. This study was done in a glass-sided flume, with a dry sand, a saturated clay and an intermediate loam, and was used to verify a theory based on slip line fields. The research done by Chari and colleagues, summarized in Green et al. (1983), is also noteworthy. In a glass-sided tilting flume 3.6 m in length, Chari (1980) conducted scouring tests with an iceberg model 0.23 m wide, 0.45 m long and 0.38 m deep, made from plexiglass and driven into Potter’s clay. He showed a steady increase during travel in the pressure on the sides and front of the model (from 0 to 4 kPa). Soil motion ahead of the model is also reported. Chari and Green (1981) tested in a flume 14 m in length by 3 m in width, with a model keel 0.50 m in width, driven into a graded masonry sand. This study documents sediment motion ahead and below scour. Model pipes 0.031 m in diameter, fitted with pressure transducers, were also buried below the scour and ahead of the keel (Green and Chari, 1981). Pressures up to 20 kPa on the pipe are reported. A keel with a 30 deg. front face, as opposed to a vertical one, was also used (Green et al., 1983). These yielded a 30% increase in pressure on the pipe.
Scour tests, described by Abdelnour et al (1981), were conducted in a basin about 18 m in length by 6 m in width with model keels made of steel with two different shapes, from about 0.3 to 1 m in size. These were driven into a sand, a silt and a clay, at three cutting depths and at three towing velocities. Pressure on the front face of each panel was monitored. Model scales were 1:25 and 1:50. Pressure distribution was measured on the model and in the soil. At the time of publishing, the results were still under the constraints of proprietary rights. Poorooshasb et al. (1989) report on scouring on a silt bed 5 m in length by 3 m in width done with a model ice keel 0.7 m long and 0.4 m wide, made from aluminium. Only two tests were done, at different initial depths, with final equilibrium scour depths of 0.04 and 0.07 m which were achieved during what is referred to as steady state motion. Sediment deformation at a significant depth below the scour was
observed, with associated pore water pressure variations. Paulin et al. (1991) describe scouring tests on sand with an aluminium model keel 0.43 and 0.86 m in width, with a 15 and 30 deg. attack angle, which was driven at a velocity of 0.6 m/sec. Scour depths were 0.04 and 0.075 m. The sediments were either dry or fully saturated, and incorporated pressure transducers as well as displacement markers in the form of ball bearings and solder strands. Displacement in loose sand was more noticeable than in dense sand. Horizontal motion extended to 0.10 m below scour. The average vertical to horizontal force ratio was about 1.3.
The experiments conducted by Kioka and colleagues (Kioka et al., 1999; Kioka and Saeki, 1995) were done with a model steel keel 0.5 x 0.5 in surface area, and 0.3 m in height, either unrestricted vertically or only allowed to rotate, with three attack angles 60, 75 and 90 degrees with respect to the horizontal. The keel was driven against sand beds of two different grain size, inclined at a gradient of 1/5 and 1/10, with velocities of 0.004, 0.009 and 0.017 m/sec, along a travel distance of 0.45 m. The bulldozing forces exerted by the keel were found to increase with distance. Grain size, attack angle and velocity did not affect these forces. The test set-up was improved in Kioka et al. (2000a; 2000b), with an increase in width of the sand-filled channel to 600 mm and with a 1/50 slope and a 3 m travel. Three model keels were used: 0.3 m in width, 0.25 m in height and up to 0.4 m in length, and with attack angles of 30, 45 and 90 degrees with the horizontal, driven at up to 0.20 m/sec in velocity. The bulldozing force varied with velocity but not with attack angle, though the latter did affect scour depth. Upward displacement of the model increased with decreasing attack angle.
In larger-scale experiments (Barker and Timco, 2002a), scouring was done by driving a rigid ice block against three types of sand/gravel beds, at velocities from 0.05 to 0.35 m/sec, and cutting depths of 0.1 and 0.25 m, over a 5 m travel distance. The keel was 0.55 m in length, 0.55 m in height and 0.10 or 0.25 m in width, with an attack angle of 35 deg. with the horizontal. A six-component dynamometer was used to measure the forces exerted on the ice. Regression analyses relating loads to velocity, scour depth and block width are presented. A similar study was later carried out in the same test facility (Barker and Timco, 2002b; Barker and Timco, 2003), but whereby a floating ice block was towed and allowed to scour the sediment beds. The dimensions of the ice block were 0.76 m in length, 0.68-0.76 m in width and 0.26 m in height. The forces exerted by the ice on the towing line were measured by the dynamometer, and the MOTAN (Johnston et al., 2003) was used to monitor ice motion. Velocities were 0.05 and 0.15 m/sec and cutting depths were 0.05, 0.1, 0.15 and 0.2 m, with scour lengths up to about 3.4 m.
Centrifuge testing
Centrifuge modeling involves the simulation of a given phenomenon that is reduced in size by a scale factor n under an artificially imposed, inertial acceleration n times that of Earth’s gravity, so that gravity-induced stresses in the model correctly reflect those in the prototype (e.g. Schofield, 1980). Because of the nature of the mechanisms involved in ice scouring, this approach is well suited to study this phenomenon. Paulin et al. (1991) describe two tests done at a scale of 1/100, with a saturated clay that incorporated various types of displacement markers and pore pressure transducers, as well as model pipelines. The model keel was similar to the one used in their conventional tests. Velocity was 0.065 m/sec along a travel distance of 0.46 m. Sub-scour deformation was observed to a depth of 0.035 m. Woodworth-Lynas et al. (1996) discuss a series of tests done with sand and clay at scales of 1/75 and 1/150, incorporating passive markers
(spaghetti noodles and coloured layers), with keel 0.20 m x 0.20 m in surface area. Travel distance was 0.55 m, with a velocity of 0.11 m/sec. They report that the “horizontal movements larger than the gouge depth extend two or more gouge depths below the gouge base” (p. 661) and that the vertical force is larger than the horizontal. Lach and Clark (1996) describe two other centrifuge tests, both of which were done at a scale of 1/100, on a clay bed with a similar test set-up. Scouring depth was 0.015 and 0.012 m, velocity was about 0.07 m/sec in both cases and travel distance was 0.145 and 0.128 m. Horizontal soil displacement was observed down to a depth 0.05 m. In Yang et al. (1996), testing was done at a 1/100 scale on a clay that incorporated various types of markers, including lead powder which could be observed through radiography, and pipelines at various depths. The aluminium model keel was 0.15 m in length, 0.1 m in width with a 15 deg. attack angle and was fitted with pressure transducers. The velocity was 0.1 m/sec along a travel distance of 0.46 m. A steady state value for the horizontal forces is reported, with vertical over horizontal force ratio of 1.5 to 3 and with soil movement limited to three times the scour depth.
Phillips et al. (2005) summarize the PRISE experimental program, whose results became publicly available in 2004. The centrifuge tests were done with an instrumented rough-faced rigid indentor, rectangular in plan, at a fixed elevation, which could only travel horizontally. The seabed for the tests described in this paper was sand. Gouge forces and local bearing pressures on the indentor were monitored. Vertical to horizontal force ratio is about equal to unity. An increase in scour depth with keel bearing pressure is shown, which, for gouge depths representative of the Canadian Beaufort Sea, implies prototype keel bearing pressure of 100 to 200 kPa. Basal shear, as opposed to passive resistance and side shear, is thought to be the main contributor in horizontal resistance. Vertical extent of sub-scour deformation is a function of sand state (i.e. dilatancy). The seabed failure mechanisms, assuming drained shear response, include the formation of a triangular dead wedge below the inclined keel surface, with passive failure ahead of it.
Schoonbeek et al (2006) ran a wooden keel model 0.178 m in length, 0.60 m in width and 0.035 m in height against a model clay seabed. Scour depth ranged between 0.007 and 0.030 m. Attack angles were 14, 27 and 45 degrees, at velocities of 0.001 m/sec or lower. A grid on the side surface of the clay sample and an on-arm video system allowed subscour deformation to be monitored in flight and measured after testing. The ratio of horizontal to vertical forces tended to increase with keel angle and with ‘roughness’ at the interface.
Field investigations on ice scouring
The available space does not allow to summarize the field investigations on ice scouring. These may be divided into three types. First, there are the surveys on scour frequency and sizes, typically done from a ship and with side-scan sonars and echo sounders (e.g. Blasco et al., 1998; Héquette, 1989; Héquette et al., 1995; Hnatiuk and Brown, 1977; Hnatiuk and Wright, 1983; Noble and Comfort, 1982). Second, on-land studies of relict scours, such as that reported by Woodworth-Lynas and Guigné (1990), provide a means of better understanding subscour deformation, since these features can be accessed by foot and be dissected at leisure. Third, in situ field trials, such as those described by Liferov and Høyland (2004), combine the advantages of working with a real seabed and natural sea ice with a relatively large footprint, while allowing some control on the interaction and using the required instrumentation. In that example, an artificially-built ridge of up to 4.0 x 4.0 x 2.45 m was used, incorporating ‘failure indicators’, documenting keel destruction that resulted from the scouring event.
PURPOSE AND SCOPE OF THE PRESENT STUDY
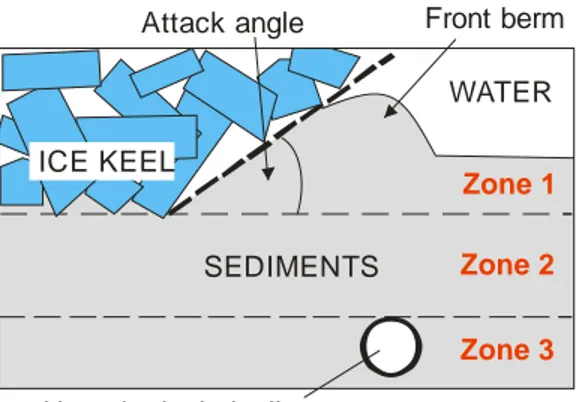
The sediment column below a scouring ice feature may be divided into three zones (Løset et al., 2006; Nobahar et al., 2007; Palmer et al., 1989; Palmer et al., 1990)(Figure 1). In Zone 1, the sediments are mobilized by the ice into front and side berms. Zone 2 lies immediately below the scour plane and is characterized by very large soil displacements. In Zone 3, displacements are minimal and result from the stresses generated from the soil displacements above. The question of interest is: how far down in the sediment column should a given installation be buried? An answer to this question requires an adequate understanding of the state of stress and strain generated in the sediment column by the scour event.
Zone 1 Zone 2 Zone 3
Attack angle Front berm
Hypothetical pipeline
WATER
SEDIMENTS ICE KEEL
Figure 1: Scouring zones.
Hence, one of the main thrusts of the present investigations is to measure both deformation and stress distributions as a function of depth, and attempt to determine how these parameters vary as a function of a number of parameters, notably vertical stresses and keel displacement rate. This is done by resorting to displacement markers as well as to tactile sensors, a relatively new technology, all of which are embedded in the sediments in various orientations. This approach differs from that in previous studies in that it directly addresses the stresses involved in the interaction. The resulting information is expected to complement our current knowledge of scour mechanisms. Secondly, as may be seen from the above literature survey, few studies used real ice, let alone ice rubble. Outstanding questions in this regard include the ice keel geometry and how it evolves during the scouring process, as well as failure mechanisms as a function of the soil’s strength. The test set-up described in this paper was used successfully in a previous test program concerned with the sliding resistance of level and rubble ice (Barrette and Timco, 2006; 2008).
EXPERIMENTAL SET-UP
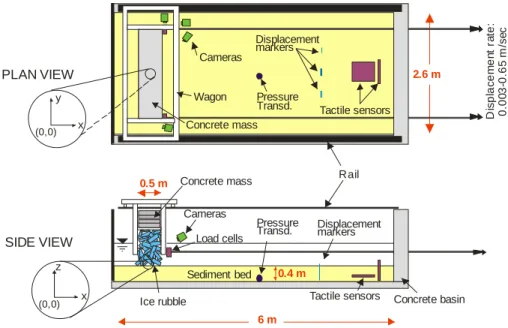
Figure 2 shows a schematic of the experimental arrangement and Figure 3 is a photograph of it.
The test flume
Testing is conducted in the ice tank of the Canadian Hydraulic Centre (CHC), at the National Research Council (NRC) in Ottawa, Ontario (Pratte and Timco, 1981), inside a specially-built concrete flume. The length and width of this flume is 6 and 2.6 m, respectively, with a height of 1.2 m (Figure 2). A 0.1 m deep, 1 m wide longitudinal recess in the centre of the flume allows additional leeway for the incorporation
of the tactile sensors. Guide rails are anchored onto the top of the flume’s two longitudinal walls, which allowed motion of a frame assembly used to carry four containment walls, collectively referred to as ‘wagon’. Two 45 kN capacity water-proofed load cell assemblies were mounted in parallel onto the downstream wagon wall (Figs. 1 and 2). They were located at the bottom of the wagon – as close as possible to the ice-sand interface, in order to minimize the amount of torque exerted onto the rail at the wagon’s suspension points. These cells monitored the load applied to the wagon by stainless steel pull rods, which extended to and went through one of the flume’s end walls to the ice tank’s towing carriage. The latter is used to pull the wagon and the rubble inside it at speeds raging from 0.003 to 0.65 m/s.
The sediments and the ice
The test flume can accommodate a sediment column up to 0.5 m in thickness (0.6 m in the central recess). The ice rubble is produced in a small cold room, by putting saline water into a series of containers 2.4 m long, 0.4 m wide and 0.3 m deep built from galvanized steel sheets, and allowing it to freeze. The ice is then extracted from these containers and broken into pieces of desired size, which are transferred into the wagon using a large bucket on a fork lift. Rubble porosity is obtained by measuring the total ice volume, obtained by keeping track of the ice dimensions retrieved from each container. Concrete slabs laid on top of the rubble are used to simulate the additional weight of a ridge in nature. The maximum vertical stress that can currently be exerted on the sediment bed is 10 kPa, but this stress can probably be increased by a factor of two if steel plates are used instead of concrete. A method was also devised to measure the rubble’s shear strength, whereby the rubble is loaded and driven against a steel frame secured at the bottom of the flume (Figure 4). This arrangement is similar to a direct shear box apparatus, and provides an estimate of the shear strength of the rubble during the test program. A common argument against direct shear as a means of determining the material’s strength is that it imposes a failure surface on the rubble. It should be borne in mind, however, that such a stress configuration simulates what effectively happens in a scouring scenario – shearing along a ‘known’ failure plane on which a given vertical load is applied. It is therefore assumed that a direct shear test is reasonably adequate for that purpose. A more legitimate concern, which also applies to other shear test methods, is to ensure that the rubble size is small enough so that the failure behaviour is representative of the rubble as a whole.
The tactile sensors
The tactile sensors used in these investigations were manufactured by TEKSCAN (Figure 5). Their overall length and width are about 0.5 m, with a thickness of 0.001 m. These films consist of a series of rows and columns made from a semi-conducting material and intersecting at right angle. A force applied onto each intersection changes the electrical resistance at these points, which is recorded by data acquisition software at a rate of up to 100 Hz. The spatial resolution of these devices, equivalent to the distance between each intersection, is 0.01 m.
Other instrumentation
Displacement transducers, mounted on the wagon, measure the amount of vertical motion of the ice rubble (and its concrete load) as scouring proceeds. Pressure transducers are used to monitor potential pore pressure build-up to help keep track of the effective pressure. For high permeability sediment such as sand, no significant increase in pore water pressure is expected, although this may occur at very high
Sediment bed
Tactile sensors Ice rubble
Concrete mass Rail
Concrete basin Load cells Cameras 6 m 0.4 m 0.5 m 2.6 m SIDE VIEW PLAN VIEW D is p la c e m e n t r a te : 0. 00 3-0. 65 m /s e c 0.5 m Cameras Concrete mass Tactile sensors Wagon Displacement markers y x (0,0) z x (0,0) Pressure Transd. Pressure
Transd. Displacement markers
Figure 2. Schematic diagram of the test set-up (not to scale).
The origin of the XYZ coordinate axes is located at the ice-sand interface, in the middle of the wagon.
Concrete load
Wagon
Pull rods
Ice
Figure 3. Photograph of the test set-up. The yellow arrow indicates travel direction.
displacement rates. Displacement markers, in the form of lead strips 0.054 m wide and 0.008 m thick, are embedded in the sand either in a vertical or horizontal position. They record the shear strain of the sediments, thereby providing a displacement profile along their length. Finally, the present test set-up accommodates up to four cameras, mounted either below or above the waterline. They are oriented in such a way as to monitor the keel dynamics, either outside the wagon, or inside it (through Lexan walls). The overall scouring event is also captured on video from outside the flume.
PRELIMINARY TESTING
So far, much of the work that has been done during this test program focused on the operational aspects of the project. There were a few
SAND F lum e’ s end w al l Props Flume’s floor 10 kPa Shear surface Load cells Shear Frame
Figure 4. Method for estimating the rubble’s shear strength.
significant challenges to overcome before achieving reliable results. For instance, the tactile sensors are not designed to withstand the rigorous treatment to which they are submitted in this application, and means had to be devised for protecting them against the water while ensuring proper performance. Another key element in this study is the implementation of the method proposed in this paper to satisfactorily simulate keel behaviour.
A total of three tests were carried out as of this writing: two initial, partly instrumented, tests led the way to one in which all the instruments described in this paper were deployed. A description of the latter will now be presented.
Material and procedures
A 0.3 m high sand column was used in this study (0.4 m in the central recess), for a 0.2 m clearance below the wagon’s lowest structural member in the front and sides, and 0.03 m in the back. The sand was purchased from a supplier and a separate sample of it was sent out to a geotechnical firm for analysis. D10, D30 and D60 were 1.6, 2.1 and
Figure 5. TEKSCAN tactile sensor.
3.2 mm, respectively, and the angle of repose was 38 degrees. A standard ‘drained’ shear strength was performed by the contractor using a direct shear box apparatus, with peak shear stresses of 3.8, 14.0 and 28.5 kPa for normal stresses of 10, 20 and 40 kPa, respectively. This corresponds to a friction coefficient of 0.69 (or a slope of 35 degrees). It should be noted that the value generated by a direct shear test on soil is typically 2 to 3 degrees higher than that obtained with a triaxial test set-up, and increases with density (B. Grace, pers. comm.).
The rubble was produced from a 20 ppt saline solution at a temperature of -10C, resulting in ice with the same salinity. The piece size had an average size of 0.14 m x 0.41 m x 0.03 m, and the rubble column was 0.8 m in thickness. It was loaded with a vertical stress of 10 kPa. A few direct shear tests on a similar rubble provided shear strengths between 15 and 28 kPa, consistent with the 4-23 kPa range reported by Croasdale et al. (2005). Water salinity in the flume was about 20 ppt.
The test set-up is that illustrated in Figure 2. Testing was done at an air temperature of 0C, and a water temperature of -0.3C. Water depth was 0.1 m (above the sand bed). The ice temperature was not measured, but since the ice was taken out of the cold room the morning of the test day, it could have been colder. Wagon motion for the test was about 0.11 m/s, for a total travel of about 4 m.
RESULTS
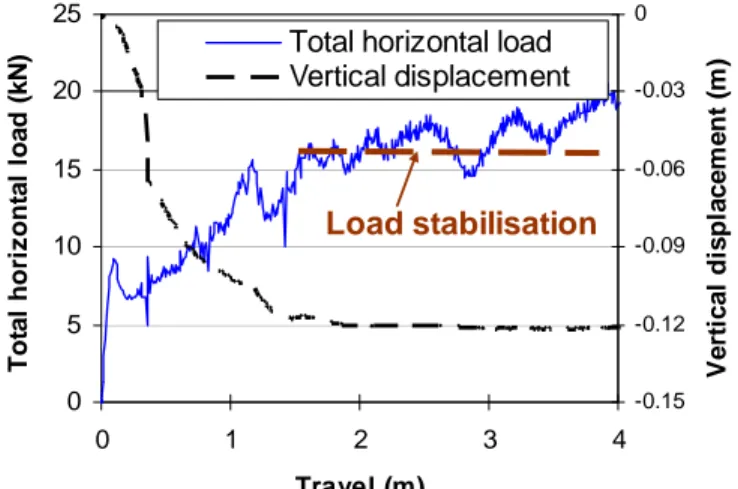
At the onset of scouring motion, the ice immediately began to sink in the sand, with concurrent frontal berm development. At mid-travel, the ice appeared to have reached equilibrium, as it no longer sank. As could be observed through the wagon’s walls, the keel did appear to adjust its shape during scouring but without breaking, presumably because it was substantially stronger than the sand. The total load (the sum of both load cells’ response) increased steadily throughout the test, but appears to stabilize at mid-travel, though it is cyclic in nature (Figure 6). Further increase in the load at the end of travel is attributed to an increase in size of the frontal berm which, at that stage, was building against the downstream wall of the wagon. The plot in that figure also indicates that the rubble initially sank into the sediments during the first two meters of travel, and abruptly stabilized at about the same travel distance as the load response. Scour profiles were not done for this test because the water that was pushed ahead during berm development flowed back behind the
wagon carrying with it a sizeable amount of sand. This caused backfilling of the scour. However, profiling was done on an earlier test with the same vertical load, for which a backfilling did not occur. This is shown in Figure 7 for a profile that ran along the flume’s longitudinal centreline (in the direction of scouring). It shows maximum scour depth of 0.15 m, just before the ice suddenly ‘ramped up’ at mid travel. Displacement markers lined up along that profile provide a measure of soil displacement across the sediment column at these locations.
0 5 10 15 20 25 0 1 2 3 4 Travel (m) Tot a l h or iz ont a l l o a d ( k N ) -0.15 -0.12 -0.09 -0.06 -0.03 0 V er ti c al d is p la ce m e n t ( m )
Total horizontal load
Vertical displacement
Load stabilisation
Figure 6. Horizontal load and vertical displacement (negative values indicate sinking) with travel. See text for comments.
-0.1 0 0.1 0.2 0.3 0.4 0.5 1 2 3 4 Travel (m ) D ep th ab o ve th e fl u m e 's fl oo r (m ) Original surface Scoured surface Scouring direction
Figure 7. Example of a scour profile from an earlier test, showing the deflection of four displacement markers. Negative depth on the y axis represents the longitudinal recess in the flume’s floor.
3 3.5 4 4.5 5 0 1 2 3 4 5 Travel (m) P re s s u re (k P a ) 0.3 0.35 0.4 0.45 0.5 H e ight of w a te r co lu m n ( m ) Transducer location
Figure 8. Pressure transducer response (with equivalent water column height on right y axis). The vertical dashed line indicates where, during travel, the probe was located directly below the ice.
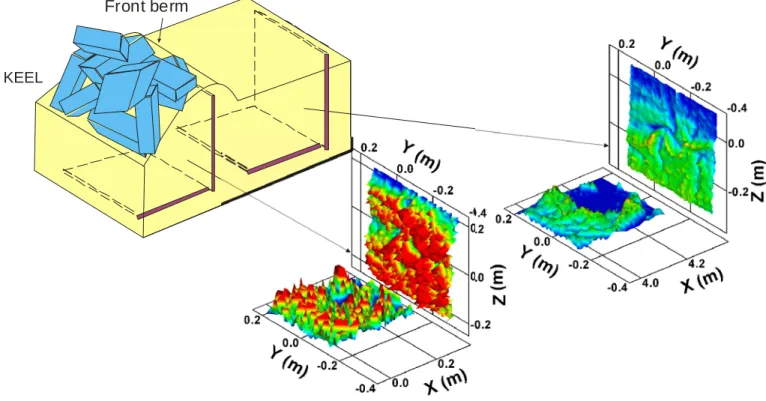
Front berm
ICE KEEL
Figure 9. Tactile sensor response. The coordinates are in reference to the axes shown in Figure 2. Note that although this figure shows two sets of sensors, only one set was used, but here it represents two distinct positions: initial (right) and final (left) (not to scale).
Figure 8 is a plot of the pressure transducer’s response, which was located at the bottom of the flume, and about 2 m travel distance. The drop in pressure presumably reflects a decrease in water level. Figure 9 shows the response of the two tactile sensors at two different times during the scour event. Both sensors were aligned along the flume’s longitudinal centre line (Figure 2). The horizontal sensor was 0.1 m above the flume’s floor and 0.3 m below the sediment surface. The vertical sensor extended from the bottom of the flume to about 0.1 m above the sand bed, thereby providing a full stress profile, including the lower portion of the frontal berm. The response on the right is at the beginning of the test, when the ice was away from the sensors; the response on the left was at the end of the test, when the ice was above the horizontal sensor. The colour shading in each of the four plots in Figure 9 indicates how the stress level varies in three dimensions. The origin (0,0,0) for the coordinates is located at the centre of the ice-sediment interface (Figure 2), keeping in mind that the ice travels along the X axis with a negative displacement along the Z axis (as it is sinking into the sand – see Figure 6).
The shape of the three displacement markers as they were retrieved from the sediment bed is schematized in Figure 10. The deflection of the two external markers shows evidence for sand motion along above a given depth. The central marker, however, shows none.
DISCUSSION
A total of three tests have been conducted so far with this experimental set-up, this paper presenting the results of the third one, which was fully instrumented. The most peculiar observation made during that test, evidence of which was also seen earlier, is the sudden sinking behaviour of the ice upon horizontal motion until mid-way in travel distance, following which this motion ceases. This
brings to mind the 3-stage scouring scheme documented by S. Blasco and collaborators (J. Shearer, 2007, pers. comm.) from field observations, and illustrated in Loset et al. (2006, p. 218). In Stage 1, the ice penetrates the seabed to a given depth. It then goes through a transition stage (Stage 2), following which the scour is parallel to the seabed (Stage 3). In the test described in this paper, this appears to coincide with stabilization in horizontal load, evocative of a steady-state in scouring behaviour (i.e. Palmer et al., 1989; Yang et al., 1996).
Figure 10. Final shape of the lead strips as at the end of the test (depicted here as if they were still embedded). The arrow indicates the direction of scour motion.
This preliminary study also points out to the existence of a stress regime throughout the sediment column. That stress is shown to increase as the ice mass gets nearer. The displacement markers
(Figure 10) appear to record the location of the boundary between Zone 2 and Zone 3 discussed earlier (Figure 1). But they also attest to the non uniform nature of sediment strain, which is expected from a rubble interface. Since it is the soil displacements that mostly contribute to the loads exerted on a buried pipeline (K. Croasdale, 2007, personal comm.), this issue should be investigated further.
CONCLUSION
This paper provides an overview of an experimental set-up designed to reproduce seabed scouring by an ice ridge. Unlike in previous studies, real ice rubble (instead of a rigid, or dummy, keel) has been investigated. This is done in a flume 6 m in length and 2.6 m in width, incorporating a four-wall enclosure that accommodates an ice mass with a 1 m2 footprint. The use of tactile sensors embedded in the sediments as a means of monitoring stress distribution is also an innovative approach to this type of study. Combined with displacement profiles across the sediment column, this should allow to better understand the state of stress and strain in the seabed, which is ultimately responsible for all scouring-related mechanisms in the soil (formation of berm, dead wedges, lateral migration of sediments, etc.) that have been documented by other investigators. This is a facet that has been overlooked to this date. The experimental set-up is also expected to generate information on keel dynamics, i.e. rubble motion, attack angle and interaction with the seafloor.
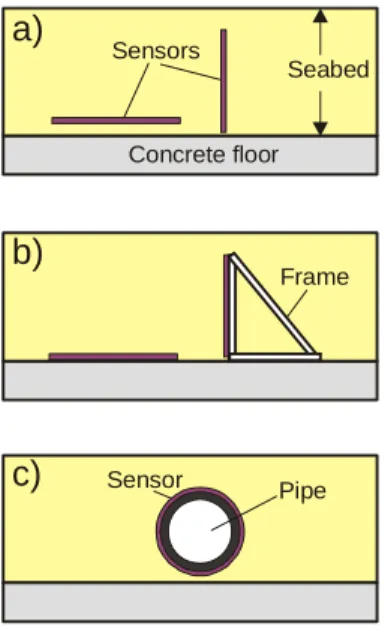
Improvements in the test procedures, to eliminate potential artefacts of test set-up, include modifications to the wagon to allow the ice to fail passively against the frontal berm. This will provide better information on keel attack angle. The effects of boundary conditions (notably with regards to the flume’s floor) should also be addressed. Parameters that can be varied in future testing include: vertical stress, scouring velocity, rubble size and consolidation state, rubble (ice) strength, soil strength and soil type. Tactile sensor layout may also be varied. For instance, by locating these sensors near the centre of the flume, a record of the variations in seabed stress distribution with time may be obtained as the ice scours its way above them. A few options may also be considered as to how they could be deployed (Figure 11). Concrete floor Seabed Pipe Sensor
a)
b)
c)
Sensors FrameFigure 11. Options for sensor deployment: a) Embedded without support; b) embedded with support; c) wrapped around a structure.
ACKNOWLEDGEMENTS
The work presented in this paper was funded by the Program of Energy Research and Development (PERD) through the ice-structure interaction activity. E. Funke designed the flume/wagon assembly. The sand’s physical and mechanical characterization was done by Jacques Whtiford. A. Collins helped out with data processing. Technical assistance with the experimental procedures was provided by John Marquardt and Liang Chang, with contributions from J.-P. des Becquets, D. Pelletier, J. Dazé, R. Lanthier and J.-G. Sanscartier. Discussions with K. Croasdale and J. Shearer were greatly appreciated.
REFERENCES
Abdelnour, R., Lapp, D., Haider, S., Shinde, S.B. and Wright, B., 1981. "Model test of sea bottom scouring". Proceedings of the 6th International Conference on Port and Ocean Engineering under Arctic Conditions (POAC), Quebec City, Canada, Vol. 2, pp. 688-705.
Barker, A. and Timco, G., 2002a. "Laboratory experiments of ice scour processes: rigid ice indentor". Cold Regions Science and Technology, 35: 195-206.
Barker, A. and Timco, G., 2002b. Laboratory Experiments of Ice Scour Processes: Buoyant Ice Model. PERD/CHC Report 31-29, 32 p.
Barker, A. and Timco, G., 2003. "Laboratory experiments of ice scour processes: buoyant ice model". Cold Regions Science and Technology, 36: 103-114.
Barrette, P.D. and Timco, G.W., 2006. "Ice pad stability on sand: Large-scale laboratory tests". Proceedings of the18th International Symposium on Ice, Association of Hydraulic Engineering and Research (IAHR), Sapporo, Japan, Vol. 1, pp. 175-182.
Barrette, P.D. and Timco, G.W., 2008. "Laboratory study on the sliding resistance of level ice and rubble on sand". Cold Regions Science and Technology (in press DOI: 10.1016/j.coldregions.2008.02.002).
Blasco, S.M., Shearer, J.M. and Myers, R., 1998. "Seabed scouring by sea-ice: Scouring process and impact rates: Canadian Beaufort Shelf". Proceedings of the 1st Ice Scour and Arctic Marine Pipelines Workshop, 13th International Symposium on Okhotsk Sea and Sea Ice, Mombetsu, Hokkaido, Japan, pp. 53-58. Chari, T.R., 1980. "A model study of iceberg scouring in the North
Atlantic". Journal of Petroleum Technology, 32: 2247-2252. Chari, T.R. and Green, H.P., 1981. "Iceberg scour studies in medium
dense sand". Proceedings of the 6th International Conference on Port and Ocean Engineering under Arctic Conditions (POAC), Quebec City, Canada, Vol. 2, pp. 1012-1019.
Croasdale, K., Comfort, G. and Been, K., 2005. "Investigation of ice limits to ice gouging". Proceedings of the 18th International Conference on Port and Ocean Engineering under Arctic Conditions (POAC), Potsdam, U.S.A., Vol. 1, pp. 23-32.
Green, H.P. and Chari, T.R., 1981. "Sediment compaction below iceberg furrows". Oceans '81 IEEE/MTS Proceedings, Boston, U.S.A., Vol. 1, pp. 223-227.
Green, H.P., Reddy, A.S. and Chari, T.R., 1983. "Iceberg scouring and pipeline burial depth". Proceedings of the 7th International Conference on Port and Ocean Engineering under Arctic Conditions (POAC), Espoo, Finland, Vol. 1, pp. 280-288.
Harrison, W.L., 1972. Soil Failure Under Inclined Loads. Cold Regions Research and Engineering Laboratory (CRREL), Research Report 303, Hanover, 95 p.
Héquette, A., 1989. "Action de la glace de mer sur les fonds sédimentaires pre-littoraux de la mer de Beaufort (NWT,
Canada)". Bulletin du Centre de Géomorphologie de Caen, 36: 129-133.
Héquette, A., Desrosiers, M. and Barnes, P.W., 1995. "Sea ice scouring on the inner shelf of the southeastern Canadian Beaufort Sea". Marine Geology, 128: 201-219.
Hnatiuk, J. and Brown, K.D., 1977. "Sea bottom scouring in the Canadian Beaufort Sea". Proceedings of the 9th Offshore Technology Conference, Offshore Technology Conference (OTC), Houston, USA, Vol. 3, Paper 2946, pp. 519-522.
Hnatiuk, J. and Wright, B.D., 1983. "Sea bottom scouring in the Canadian Beaufort Sea". Proceedings of the 15th Offshore Technology Conference, Offshore Technology Conference (OTC), Houston, U.S.A., Paper 4584, pp. 35-38.
Johnston, M., Frederking, R., Timco, G.W. and Miles, M., 2003. "MOTAN: a novel approach for determining ice-induced global loads on ships". Proceedings MARI-TECH, Montreal, Canada, pp. 1-17.
Kioka, S. and Saeki, H., 1995. "Mechanisms of ice gouging". Proceedings of the 5th International Offshore and Polar
Engineering Conference, The International Society of Offshore and Polar Engineers (ISOPE), The Hague, The Netherlands, Vol. 2, pp. 398-402.
Kioka, S., Abe, S., Sasaki, H. and Saeki, H., 1999. "Mechanical model of ice scour". Proceedings of the 15th International Conference on Port and Ocean Engineering under Arctic Conditions (POAC), Helsinki, Finland, Vol. 2, pp. 537-544. Kioka, S., Yasunaga, Y., Nishimaki, H. and Saeki, H., 2000a.
"Behavior of ridge ice at a time of ice scouring". Proceedings of the 2nd Ice Scour and Arctic Marine Pipelines Workshop, 15th International Symposium on Okhotsk Sea and Sea Ice, Mombetsu, Hokkaido, Japan, pp. 163-171.
Kioka, S., Yasunaga, Y., Watanabe, Y. and Saeki, H., 2000b. "Evaluation of ice forces acting on sea bed due to ice scouring". Proceedings of the 10th International Offshore and Polar Engineering Conference, The International Society of Offshore and Polar Engineers (ISOPE), Seattle, U.S.A., Vol. 1, pp. 749-755.
Lach, P.R. and Clark, J.I., 1996. "Numerical simulation of large soil deformation due to ice scour". Proceedings of the 49th Canadian Geotechnical Conference, St. John's, Canada, Vol. 1, pp. 189-198.
Liferov, P. and Høyland, K.V., 2004. "In-situ ice ridge scour tests: experimental set up and basic results". Cold Regions Science and Technology, 40: 97-100.
Løset, S., Shkhinek, K.N., Gudmestad, O.T. and Høyland, K.V., 2006. Actions from Ice on Arctic Offshore and Coastal Structures. Krasnodar, St. Petersburg, 271 pp.
Nobahar, A., Kenny, S., King, T., McKenna, R. and Phillips, R., 2007. "Analysis and design of buried pipelines for ice gouging hazard: A probabilistic approach". Journal of Offshore Mechanics and Arctic Engineering, 129: 129-228.
Noble, P.G. and Comfort, G., 1982. Damage to an underwater
pipeline by ice ridges. In: R.M.W. Frederking and G.R. Pilkington (Editors), Proceedings of Workshop on Sea Ice Ridging and Pile-up, Snow and Ice Subcommittee, Associate Committee on Geotechnical Research, National Research Council Canada, Technical Memorandum No.134, pp. 248-284.
Palmer, A., Konuk, l., Love, J., Been, K. and Comfort, G., 1989. "Ice scour mechanisms". Proceedings of the 10th International Conference on Port and Ocean Engineering under Arctic Conditions (POAC), Luleå, Sweden, Vol. 1, pp. 123-132.
Palmer, A.C., Konuk, I., Comfort, G. and Been, K., 1990. "Ice gouging and the safety of marine pipelines". Proceedings of the 22nd Annual Offshore Technology Conference, Offshore Technology Conference (OTC), Houston, U.S.A., Paper 6371, pp. 235-244.
Paulin, M.J., Lach, P.R., Poorooshasb, F. and Clark, J.I., 1991. "Preliminary results of physical model tests of ice scour". Proceedings of the 11th International Conference on Port and Ocean Engineering under Arctic Conditions (POAC), St. John's, Canada, pp. 1017-1036.
Phillips, R., Clark, J.I. and Kenny, S., 2005. "PRISE studies on gouge forces and subgouge deformations". Proceedings of the 18th International Conference on Port and Ocean Engineering under Arctic Conditions (POAC), Potsdam, U.S.A., Vol. 1, pp. 75-84. Poorooshasb, F., Clark, J.I. and Woodworth-Lynas, C.M.T., 1989.
"Small scale modelling of iceberg scouring of the seabed". Proceedings of the 10th International Conference on Port and Ocean Engineering under Arctic Conditions (POAC), Luleå, Sweeden, pp. 133-145.
Pratte, B.D. and Timco, G.W., 1981. "A new model basin for the testing of ice-structure interactions". Proceedings of the 6th International Conference on Port and Ocean Engineering under Arctic Conditions (POAC), Université Laval, Quebec City, Canada, Vol. 2, pp. 857-866.
Schofield, A.N., 1980. "Cambridge geotechnical centrifuge operations". Géotechnique, 30(3): 227-268.
Schoonbeek, I.S.S., Xin, M.X., van Kesteren, W.G.M. and Been, K., 2006. "Slip line field solutions as an approach to understand ice subgouge deformation patterns". Proceedings of the 16th
International Offshore and Polar Engineering Conference, The International Society of Offshore and Polar Engineers (ISOPE), San Francisco, U.S.A., pp. 628-633.
Woodworth-Lynas, C., Nixon, D., Phillips, R. and Palmer, A., 1996. "Subgouge deformations and the security of Arctic marine pipelines". Proceedings of the 28th Offshore Technology Conference, Offshore Technology Conference (OTC), Houston, U.S.A., Paper 8222, pp. 657-664.
Woodworth-Lynas, C.M.T. and Guigné, J.Y., 1990. "Iceberg scours in the geological record: examples from glacial Lake Agassiz". Geological Society Special Publication, 53: 217-233.
Yang, Q.S., Poorooshasb, H.B. and Lach, P.R., 1996. "Centrifuge modeling and numerical simulation of ice scour". Soils and Foundations, 36(1): 85-96.