Changes in functional interactions during anaesthesia-induced loss of
consciousness
Jessica Schrouff1, Vincent Perlbarg2, Mélanie Boly1, Guillaume Marrelec2, Steven Laureys1, Pierre Maquet1, Mélanie Pelegrini-Issac2, Habib Benali2, Christophe Phillips1
1
Cyclotron Research Centre, University of Liège, Liège, Belgium 2
UMR-S 678, Inserm-UPMC, Paris, France
Consciousness is assumed to rely on brain’s capacity to integrate information. This hypothesis entails that loss of consciousness (during slow wave sleep, anaesthesia, coma or vegetative state) is associated with substantial modifications in functional interactions within and between large-scale networks.
In the present work, we analyzed fMRI time series of healthy volunteers in resting wakefulness and deep sedation induced by propofol infusion, in terms of functional connectivity within and between large-scale brain networks.
Materials
Eighteen healthy volunteers (14 females) participated in the study, which was approved by the Ethics Committee of the Faculty of Medecine of the University of Liège. They were fully informed and gave their written consent.
Anaesthesia was achieved with a computer-controlled intravenous infusion of propofol (using a targetcontrolled infusion device, Diprifusor©-algorithm, Pharmacokinetics and Pharmacodynamics Software Server, Department of Anaesthesia, Stanford University, USA) to obtain constant effect-site concentrations. To ensure safety, physiological parameters such as blood pressure, cardiac rythm or pulse oxymetry were monitored.
During the acquisitions, the subjects’ level of consciousness was estimated using the Ramsay scale: the subject was asked a simple task (’squeeze strongly my hand’) and his/her level of consciousness was evaluated from the strength and rapidity of his/her response. The volunteer was considered fully awake (Ramsay 2) when the response was clear and strong, in mild sedation (Ramsay 3) if the response was clear but slow, in deep sedation if there was no response (Ramsay 5-6) and in recovery of consciousness (Ramsay 2) when he/she awoke from deep sedation. In the present report, we focus on differences between wakefulness and deep sedation.
Functional images were acquired on a 3 Tesla Siemens Allegra scanner (32 interleaved slices, TR = 2460 ms, TE = 40 ms, FOV = 220 mm, voxel size = 3.45x3.45x3 mm, matrix size = 64x64x32). Functional images were corrected for slice timing errors and realigned to compensate for within-session rigid movements using the SPM5 software (statistical parametric mapping, www.fil.ion.ucl.ac.uk).
Methods
The networks were detected at the group level using spatial independent component analysis (sICA) at the subject level and a hierarchical clustering of all obtained IC based on spatial criteria (implemented in the NetBrainWork software, UMR S 678, Inserm, UMPC Univ. Paris 06). Regions of interest (ROI) representing the main ‘nodes’ of the functional networks were then automatically identified. Since interaction measures are computed only between the selected ROI, we studied the influence of ROI design on the results.
Interaction differences between wakefulness and deep sedation were studied using four different measures of functional interaction: marginal correlation (pairwise correlation), partial correlation (pairwise correlation conditionnally to all other ROI), integration (amount of global dependence between variables) and connectivity (number of detected links between ROI on thresholded partial correlation graphs). Marginal and partial correlation measures were mainly used to infer qualitative results while integration, which can be seen as a hierarchical measure of the brain interactions by using the decomposition theorem (total integration = within-system integration + between-system integration), was computed to obtain a quantitative view of the previous results.
Results
Networks
Functional networks could be visually identified in wakefulness but also in deep sedation, even though in a smaller number.
Most of the activity patterns detected at the group level were networks already described in the litterature such as the default mode (DM) network, the visual (VIS) network, the dorsal attentional (dATT) network, the ventral attentional
(vATT) network, the limbic (LIMB) network, the motor (MOT) network and a network containing parts of the salient (SAL) network. ROI considered for interactions computation were selected on these known networks only.
Effect of ROI selection
Selecting ROI in a particular condition and group of subjects induces a bias when comparing this particular condition to others since the selection of ROI from a particular map focuses on highly correlated regions of that map.
Using different conditions and combinations of data to select ROI, we showed that, in our particular case, the bias induced by the ROI selection was smaller than the effect of sedation on brain activity.
Analysis of interactions in wakefulness and in deep sedation
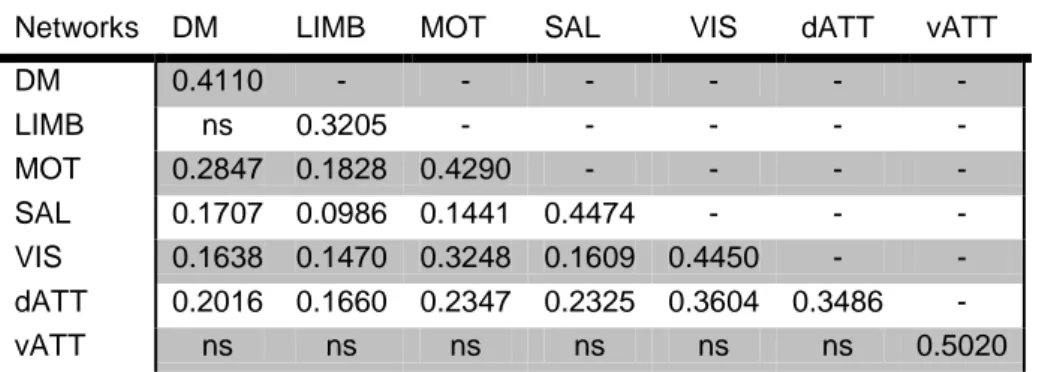
We found large decreases in interaction between- and within-networks in deep sedation relative to resting wakefulness, as measured by marginal correlation, partial correlation and integration (see table 1).
Networks DM LIMB MOT SAL VIS dATT vATT
DM 0.4110 - - - - LIMB ns 0.3205 - - - - - MOT 0.2847 0.1828 0.4290 - - - - SAL 0.1707 0.0986 0.1441 0.4474 - - - VIS 0.1638 0.1470 0.3248 0.1609 0.4450 - - dATT 0.2016 0.1660 0.2347 0.2325 0.3604 0.3486 - vATT ns ns ns ns ns ns 0.5020
Table 1: Average relative decrease in within- and between- networks integration (in procents) between wakefulness and deep sedation with ‘ns’ meaning ‘not significant’ effect.
Partial correlation graphs also showed a significant decrease in connectivity between the two conditions. In particular, these graphs showed a fronto-parietal segregation of the networks, which was further confirmed by significant decreases in interaction measures between the frontal and parietal areas of associative networks (i.e. dATT, vATT, SAL, DM and LIMB) as separated by a neurologist.
At the network level, significant reorganizations of ROI interactions between wakefulness and deep sedation were found in terms of correlation. This finding is in line with other results suggesting that, in certain stages of sleep, brain activity breaks down in causally independent modules.
Conclusion
In the present work, we analyzed the resting fMRI time series of healthy patients in terms of functional interactions between large-scale networks.
The selection of ROI being a key point of the process, we studied its influence on the interaction measures and showed that, in our particular case, the bias induced by this selection was smaller than the effect of sedation on brain activity.
From the different analyses, we can conclude that there were four main effects of sedation on brain functional connectivity:
1. Functional networks could still be identified in deep sedation, although in smaller number.
2. There was a large decrease in all interaction measures between wakefulness and deep sedation. 3. A large fronto-parietal segregation of the non-primary networks was observed.
4. There was a functional reorganization of the ROI within the different networks between wakefulness and deep sedation.