Publisher’s version / Version de l'éditeur:
Vous avez des questions? Nous pouvons vous aider. Pour communiquer directement avec un auteur, consultez la première page de la revue dans laquelle son article a été publié afin de trouver ses coordonnées. Si vous n’arrivez pas à les repérer, communiquez avec nous à [email protected].
Questions? Contact the NRC Publications Archive team at
[email protected]. If you wish to email the authors directly, please see the first page of the publication for their contact information.
https://publications-cnrc.canada.ca/fra/droits
L’accès à ce site Web et l’utilisation de son contenu sont assujettis aux conditions présentées dans le site
LISEZ CES CONDITIONS ATTENTIVEMENT AVANT D’UTILISER CE SITE WEB.
Innovations in Urban Infrastructure, APWA Congress [Proceedings], pp. 39-56, 2000-09-09
READ THESE TERMS AND CONDITIONS CAREFULLY BEFORE USING THIS WEBSITE.
https://nrc-publications.canada.ca/eng/copyright
NRC Publications Archive Record / Notice des Archives des publications du CNRC : https://nrc-publications.canada.ca/eng/view/object/?id=8662d1f7-edf8-4655-b40a-eebb5cdd9008 https://publications-cnrc.canada.ca/fra/voir/objet/?id=8662d1f7-edf8-4655-b40a-eebb5cdd9008 This publication could be one of several versions: author’s original, accepted manuscript or the publisher’s version. / La version de cette publication peut être l’une des suivantes : la version prépublication de l’auteur, la version acceptée du manuscrit ou la version de l’éditeur.
Access and use of this website and the material on it are subject to the Terms and Conditions set forth at
Advanced asset management: tools and techniques
ADVANCED ASSET MANAGEMENT: TOOLS AND TECHNIQUES
by D.J. VANIER1
Institute for Research in Construction, National Research Council Canada 1500 Montreal Road, Ottawa, CANADA K1A 0R6
Abstract
This presentation describes the six “Whats” of asset management. These six levels of implementation can be used as a methodology for the implementation of an asset management plan in most organizations. An asset management plan provides a framework for collecting the data and information required to make decisions about the strategic plans of the fixed assets of an organization.
The extent of the asset management market in Canada is large, upwards of CDN$ 5.5 trillion; while in the USA it could be six-times larger. The estimated maintenance and repair expenditure requirements in Canada are of the order of CDN$110.0 billion per year, whereas capital renewal expenses are close to CDN$ 86.5 billion per year. The sum of these two figures is close to double the value of new construction in Canada each year. Similar maintenance and renewal figures in the USA could be to the order of US$800 billion per year. Managers of municipal infrastructure are realizing the need for effective tools to manage this vast asset base, and are now demanding decision-support tools to help them in their work.
Résumé
Cet exposé décrit les six questions à poser concernant la gestion des biens. La plupart des organisations peuvent considérer ces six niveaux comme les éléments d’une méthode de mise en oeuvre d’un plan de gestion des biens. Un tel plan fournit un cadre pour la collecte des données et de l’information nécessaires pour prendre des décisions concernant les plans stratégiques d’une organisation en matière d’immobilisations. Les gestionnaires d’infrastructures municipales sont conscients de la nécessité de disposer d’outils efficaces pour gérer cette vaste base de biens, et ils exigent maintenant des outils d’aide à la décision qui faciliteront leur travail.
Keywords: investment planning, maintenance management, municipal infrastructure, decision-making, decision-support systems, condition assessment
1
Dr. Dana Vanier is a Senior Research Officer at the National Research Council Canada. He is currently investigating the use of Information Technologies in the field of service life asset management. He is an editor of ITCON, the Electronic Journal of Information Technology in Construction (www.itcon.org) and a member of the CIB W78 working commission on IT in construction. He can be reached at [email protected] or at (613) 993-9699. This paper can be obtained electronically at www.nrcuca/irc/uir/apwa in the Louisville 2000 proceedings.
1 Introduction
Owners of large municipal infrastructure portfolios such as federal departments, regional governments, municipalities, universities or the armed forces have responsibility over a diversified set of constructed facilities. These assets range from complex, inter-related underground networks to sophisticated buildings, as well as roadway systems, parks and any other equipment necessary to maintain this infrastructure (to be called municipal infrastructure in this presentation). This municipal infrastructure, however, cannot be completely protected from deterioration due to usage, climatic effects or geological conditions. Furthermore, because of inadequate funding or inappropriate support technologies, certain components of this infrastructure have been neglected and have received only remedial treatments (CERF 1996; NRC 1996).
"The United States spends an enormous amount of money annually to replace or repair deteriorated equipment, machines and other components of the infrastructure. In the next several decades, a significant percentage of the country’s transportation, communications, environmental, and power system infrastructure, as well as public buildings and facilities, will have to be renewed or replaced." (NRC 1999)
2 The Six "Whats" of Asset Management: An Overview
Vanier (2000a) describes six "Whats" of asset management in his previous presentation in this publication: What do you own? What is it worth? What is the deferred maintenance? What is its condition? What is the remaining service life? What do you fix first? This next presentation outlines ways to implement the six "Whats" in practice. In fact, these six "Whats" should be seen as a sequential implementation schedule for an organization wishing to implement strategic asset management. In the remainder of the text, these six "Whats" are called the six levels of implementation for asset management.
2.1 Asset Management Implementation Plan
The concept of asset management is difficult to accept as a philosophy and to implement in practice because asset management means many things to many different people. For example, some disciplines in an organization may feel they already have an asset management system in place when they have implemented an inventory system only. Or, some organizations may have some disciplines that are well-advanced in asset management implementation (i.e. bridges, roads) but may also have many that are lagging behind (i.e. parks, buried utilities). Or, some regions may have reached a plateau and wish to advance to a higher level not knowing that a sister discipline in another region has the tools and techniques in place to assist them. Because of these obvious differences in organizations and in any particular organization, an organization's asset management implementation plan should have a series of overlying principles established at a high level in that organization. The asset management implementation plan should:
• Assess organization's current level of implementation in various regions and disciplines.
• Set minimum criteria for data and information for all levels of implementation.
• Set timelines for next level of implementation
2.2 Asset Management Plan: Levels of Implementation
The six asset management levels of implementation are described briefly below; however, a full discussion of these are included in the next section and in an associated paper in this publication (Vanier 2000a).
• The "What do you own?" question may seem to have straightforward answers, but there are many owners of municipal infrastructure who may not know the extent of their portfolio or the percentage breakdown in the various disciplines (e.g. bridges, buried, building, roads). Unless decision-makers have an accurate picture of the extent of the asset base, strategic asset management planning (planning beyond the five-year horizon) is hopeless.
• The "What is it worth?" question asks asset owners to assign realistic values to their asset portfolio. Once the value of a portfolio has been established, then it can be broken into the various asset disciplines and maintenance budgets can be assigned accordingly. Although it may appear naïve to allocate maintenance moneys strictly based on the value of an asset, without other metrics in place to establish priorities, basing decisions on actuarial value is a simple, objective method; otherwise the decisions would be entirely subjective. Book value, appreciated historical value and current replacement value (CRV) are different ways to calculate an asset's worth (Vanier 2000a).
• The "What is the deferred maintenance?" question seeks information that will provide an additional metric for maintenance fund allocation. Knowing the amount of deferred maintenance provides decision makers with an overview of the amount of money required to bring the maintenance and repair under control. This value can also be used to calculate another metric for maintenance prioritization as suggested by NACUBO (1990); namely, the facility condition index (FCI). The FCI is calculated as the amount of deferred maintenance divided by the CRV.
• The "What is its condition?" question is an extension of the "What is it worth?" levels of implementation, and it is another tool to prioritize maintenance, repair and renewal. Technical condition metrics are not available for many discipline and some may still be under development for years, so a mix of the FCI and the technical condition indexes may have to be used in an organization to identify the condition or level of performance. The technical condition index (Vanier 2000a) is more complex, difficult, and expensive to obtain than its financial condition; so this level should be attempted only when the previous three levels of implementation have been successfully attained.
• The "What is the remaining service life?" question seeks detailed information about the asset that will add an additional metric for maintenance prioritization; namely, when should capital renewal occur. The "technical service life" can be obtained from in-house expertise or service life tables (HAPM 1995); however the "economic service life" must be calculated as a function of projected maintenance and repair expenditures, which are not know until the "What is deferred maintenance?" and "What is its
• "What do you fix first?" The answers provided to each of the previous five levels of implementation assist the decision-makers to prioritize their maintenance expenditures. However, having suitable answers to the "What is the remaining service life?" level of implementation will allow the asset managers to make better, objective decisions. Unfortunately, maintenance prioritization is not a simple task (Vanier 1999, 2000a) and sophisticated techniques such as multi-objective optimization are sometimes required to choose between deserving, yet competing, projects and to schedule their implementation order.
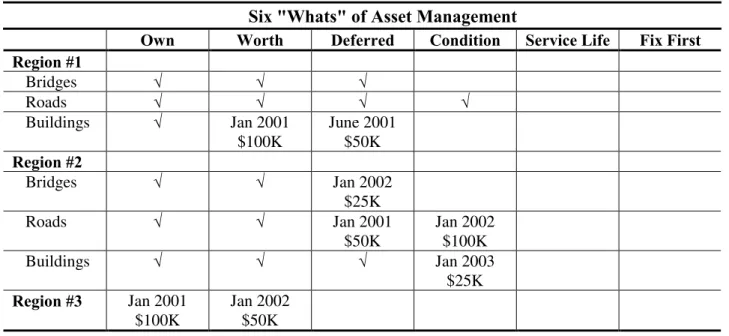
A rough layout for an asset management implementation plan, directly related to the six "Whats" of asset management, is presented as Table 1. Current level of implementation, milestones for the subsequent implementation levels, along with estimated costs of implementation can be recorded.
Table 1: Asset Management Implementation Plan
Six "Whats" of Asset Management
Own Worth Deferred Condition Service Life Fix First
Region #1 Bridges √ √ √ Roads √ √ √ √ Buildings √ Jan 2001 $100K June 2001 $50K Region #2 Bridges √ √ Jan 2002 $25K Roads √ √ Jan 2001 $50K Jan 2002 $100K Buildings √ √ √ Jan 2003 $25K Region #3 Jan 2001 $100K Jan 2002 $50K
3 Asset Management Implementation
This section details asset management implementation. It provides examples for early implementation strategies, normally when data or information are lacking but decisions still have to be made.
3.1 What do you own?
Inventory systems or computerized maintenance management systems (CMMS) are tools that can also be used to record the extent of an asset portfolio (Vanier 2000a), and some systems may also record information required at the five other asset management levels of implementation. However, some organizations may not have an accurate picture of their existing portfolio and can only rely on historical "book values" or population growths to determine the construction date, age and value of an asset. An example is provided below to estimate the age
and value of built assets in Canada and the USA; the same techniques (and figures) can be used to calculate the age and value of assets for most organizations.
3.1.1 Annual Growth in Canada and the USA
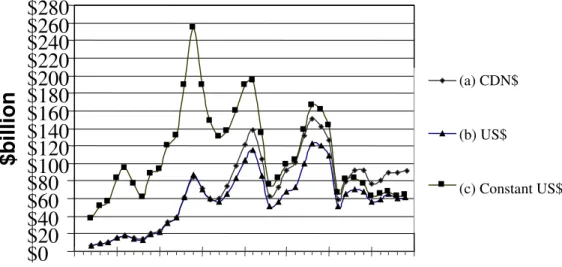
The value of built assets in Canada is increasing at a rate of approximately CDN$ 100 billion per year, as shown in Curve (a) of Fig. 1 (Statistics Canada 1994, 1996, 1999; Vanier 2000), having reached a peak of CDN$ 151 billion in 1988. This curve closely follows growth and recession periods in Canada during that time frame. Curve (b) normalizes the CDN dollars to US dollars, which the author believes to be more reflective of the value of the construction growth owning to the fluctuations in the CDN dollar since 1976, as shown in Fig. 2. Curve (c) in Fig. 1 brings forward the annual growth numbers to constant 1999 dollars, based on figures from Fig. 3.
$0
$20
$40
$60
$80
$100
$120
$140
$160
$180
$200
$220
$240
$260
$280
1960 1965 1970 1975 1980 1985 1990 1995 2000$b
il
lio
n
(a) CDN$ (b) US$ (c) Constant US$Fig. 1: Annual Construction Growth (Canada) in Current and Constant 1999 Dollars.
0.6000 0.6500 0.7000 0.7500 0.8000 0.8500 0.9000 0.9500 1.0000 1.0500 1960 1965 1970 1975 1980 1985 1990 1995 2000
0 1 2 3 4 5 6 7 1960 1965 1970 1975 1980 1985 1990 1995 2000
Fig. 3: Constant 1999 dollars, obtained from Engineering News Record (ENR 2000).
$0
$100
$200
$300
$400
$500
$600
$700
$800
1960 1965 1970 1975 1980 1985 1990 1995 2000$b
il
lio
n
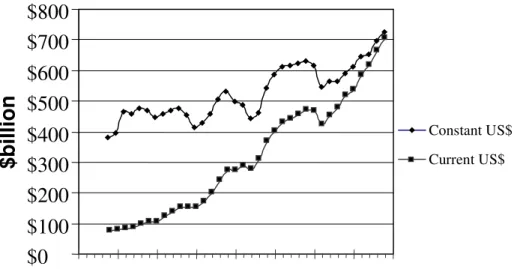
Current US$ Constant US$Fig. 4: Annual Construction Growth (USA) in Current and Constant 1999 Dollars.
Similar figures for the annual construction growth in the United States of America are presented in Fig. 4 (US Census 1999).
It is interesting to note the juxtaposition of the Canada (curve a) and USA (curve b) growths (in constant dollars) in Fig. 5 for the past 40 years. Curve (c) provides the comparison numbers in constant US dollars for the Canadian growth patterns. Although curves (a) and (b) appear to peek and to trough in similar patterns, the figures indicate that the Canadian construction phases always tend to lag behind the US phases by a period of one or two years. The most interesting difference in Curves (a) and (b) of Fig. 5 are the growth patterns for the two countries in the last five years with the Canadian figures increasing modestly and the USA figures hitting all time growth highs; it is well known that the USA is experiencing rapid growth in many regions.
$0
$100
$200
$300
$400
$500
$600
$700
$800
1960 1965 1970 1975 1980 1985 1990 1995 2000$b
il
li
o
n
(c) Canada US$ (a) USA US$(b) Canada $
Fig. 5: Annual Construction Growth (Canadian and USA) in Constant 1999 Dollars. 3.2 What is it worth?
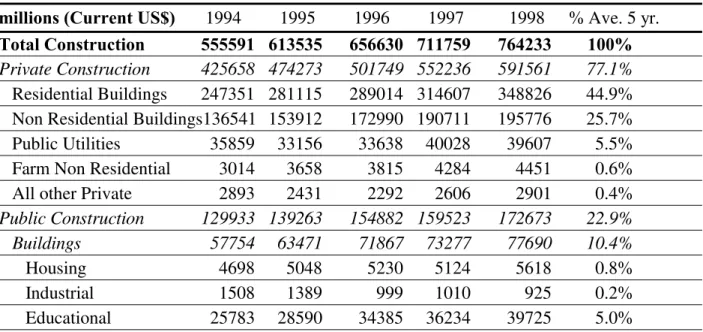
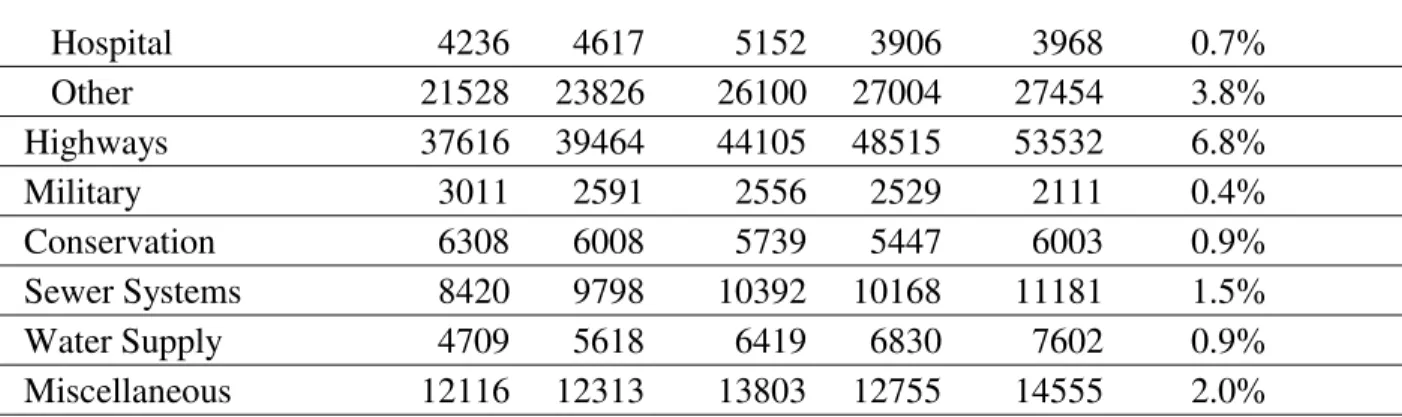
A rough breakdown into the specified construction classes, according to US Census (1999), can be found in Table 2. Table 2 indicates that roughly 7% of the annual new construction budget is spent annually on highways and streets; roughly 2.4% is spent on buried utilities; "Public Construction (Miscellaneous)" of 2% includes recreational facilities, power generating plants, transit systems and airfields and the 10.4% for "Buildings (Other)" in "Public Construction" includes general administration buildings, prisons, police and fire stations, courthouses, civic centers, and postal facilities. These four areas generally constitute the extent of municipal infrastructure, or roughly 21% of the new construction in the USA in recent years.
Table 2: Breakdown of Annual Value of Construction Put in Place (US Census 1999) millions (Current US$) 1994 1995 1996 1997 1998 % Ave. 5 yr.
Total Construction 555591 613535 656630 711759 764233 100%
Private Construction 425658 474273 501749 552236 591561 77.1%
Residential Buildings 247351 281115 289014 314607 348826 44.9%
Non Residential Buildings136541 153912 172990 190711 195776 25.7%
Public Utilities 35859 33156 33638 40028 39607 5.5%
Farm Non Residential 3014 3658 3815 4284 4451 0.6%
All other Private 2893 2431 2292 2606 2901 0.4%
Public Construction 129933 139263 154882 159523 172673 22.9%
Buildings 57754 63471 71867 73277 77690 10.4%
Housing 4698 5048 5230 5124 5618 0.8%
Industrial 1508 1389 999 1010 925 0.2%
Hospital 4236 4617 5152 3906 3968 0.7% Other 21528 23826 26100 27004 27454 3.8% Highways 37616 39464 44105 48515 53532 6.8% Military 3011 2591 2556 2529 2111 0.4% Conservation 6308 6008 5739 5447 6003 0.9% Sewer Systems 8420 9798 10392 10168 11181 1.5% Water Supply 4709 5618 6419 6830 7602 0.9% Miscellaneous 12116 12313 13803 12755 14555 2.0%
Although asset owners should be able to determine the extent and age of their portfolio from their inventory numbers, sometimes population statistics may be the only way of determining a realistic number for asset disciplines such as buried infrastructure (Gohier 1999). In general, the breakdowns in Table 2 could be used if an organization was unable to clearly identify the rough amounts for asset classes in their portfolios.
3.2.1 Total Asset Base (Canada and USA)
As a result of the annual growth described earlier in Canada, our country has an established total stock of buildings and constructed infrastructure with an estimated value of more than CDN$ 2.94 trillion, as shown in Fig. 6 (Statistics Canada 1994, 1996, 1999). Curve (a) shows this number in constant (1999) dollars CDN, which is closer to CDN$ 5.5 trillion.
$0.0
$1.0
$2.0
$3.0
$4.0
$5.0
$6.0
1960 1965 1970 1975 1980 1985 1990 1995 2000$tri
llio
n
(a) Total Constant $CDN
Buildings
Engineering Works Total Current $CDN
Residential
Fig. 6: Total Assets (Canada) in Current and Constant 1999 Dollars.
The numbers for the USA total assets are presented in Fig. 7 in both current and constant (1999) dollars. Data for Figures 7 and 8 for 1964 onwards were obtained from annual US Census (1999) figures. Data for 1915 to 1964 were obtained from the C30-80 Supplement (US Census Supplement 1981). Both data sets were brought forward to 1999 constant US dollars using construction indexes from ENR (1999).
$0 $5 $10 $15 $20 $25 $30 1960 1965 1970 1975 1980 1985 1990 1995 2000 $tri llion Current US$ Constant 1999 US$
Fig. 7: Total Assets (USA) in Current and Constant Dollars.
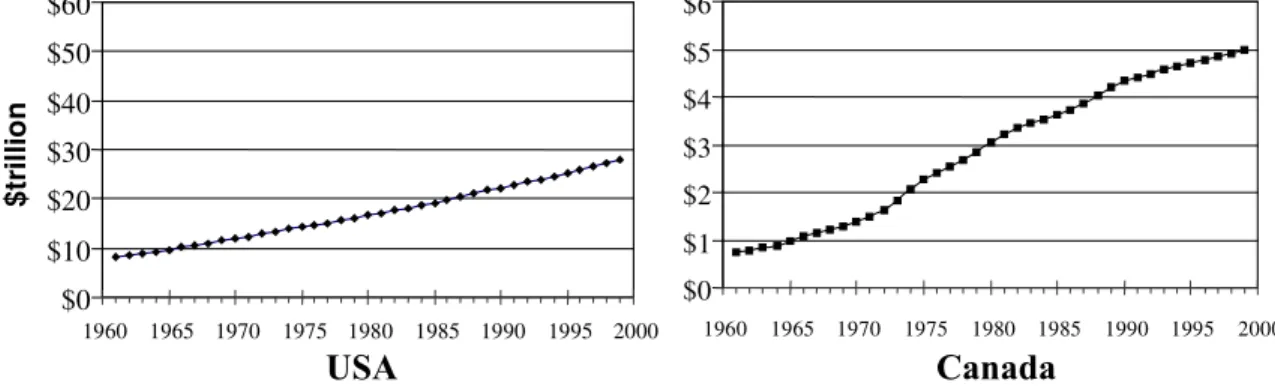
The total infrastructure asset for Canada and the USA are presented and can be compared in constant US dollars in Fig. 8. The numbers for total assets in the USA are to the order of US$30 trillion whereas the Canadian numbers are closer US$5 trillion. These numbers, and the graphical comparisons of the USA and Canadian curves, indicate that a simple “ten” multiplier of USA figures in this domain can no longer be used. The “ten” multiplier was probably applicable for comparisons before 1975, whereas a multiplier of “six” would be more valid today. These two curves also indicate that Canada experienced considerable growth in the 70’s to 90’s and that growth is now tapering off and that from 1990 onwards the relative growth in Canada is similar to the USA. $0 $10 $20 $30 $40 $50 $60 1960 1965 1970 1975 1980 1985 1990 1995 2000 $ tril lio n $0 $1 $2 $3 $4 $5 $6 1960 1965 1970 1975 1980 1985 1990 1995 2000 USA Canada
Fig. 8: Total Public Infrastructure Assets (USA and Canada) in Constant 1999 US Dollars (note differing scales – one order of magnitude).
Accumulating the annual growth over a long period of time can also provide figures for the total worth of an organization's portfolio. It is understood that depreciation and capital renewal have already taken place, but at this time these factors will be ignored in these rough estimates.
These total values for Canada and USA presented in the previous figures are significant and frightening; however, the magnitude of these numbers does establish the extent of the current asset management challenge. The operation, maintenance, repair, and eventual renewal of this
"built environment" therefore represent a major, and rapidly growing, cost to Canada and the USA. Similar challenges exist in Australia (Burns et al 1999) and other developed countries.
Although the numbers presented in the proceeding sections present the picture for the entire built environment for Canada and the USA, the same methodology could be used to establish the value of the built environment for a specific municipality or organization. For example, if the historical value of an asset is known (from the accountants), then Figs. 2 and 3 (the raw data for
these curves can be obtained from www.forecasts.org/data/data/EXCAUS.htm and
www.enr.com/cost/costbci.asp, respectively) can be used to calculate the value of these assets in
current and in constant dollars. This is one way to determine the second level of implementation of asset management; that is, “What is it worth?”. Vanier (2000a) describes in details other ways to calculate the value of assets in a portfolio.
3.3 What is the deferred maintenance?
Organizations investigating asset management renewal (NACUBO 1990; Melvin 1992; NRC 1994, 1996) recommend separating maintenance and repair expenditures from those of capital in order to understand the maintenance, repair and renewal priorities. Maintenance and repair expenditures are interventions required to ensure that an asset is able to support the purpose for which it was originally intended (Vanier 2000a) and to attain its optimal service life (CICA 1989). Whereas capital renewal is a comprehensive action to completely replace an existing asset, potentially with a whole different functionality or location. Typically, if maintenance on a system or component is deferred too long it will promote early capital renewal; however, this should be the exception and not the rule.
These two aspects, deferred maintenance and capital renewal, of asset management are discussed in the following subsections in an attempt to estimate the size of the maintenance, repair and renewal market in Canada and the USA. The techniques could also be used to estimate the size of the deferred maintenance in most organizations.
3.3.1 Maintenance and Repair
Maintenance and repair expenditures should not include "funds for any activities that are primarily operational or any construction work that expands or changes the function of a facility or lengthens its life beyond its original design life" (NRC 1996) but should include routine repairs which are defined as “actions taken to restore a system or piece of equipment to its original capacity, efficiency, or capability” (NRC 1996). The Federal Facilities Council recommends, "in the absence of other information", that annual budgets for maintenance and repair should be set at approximately 2-4% of the current replacement value (CRV) of constructed facilities (NRC 1994, 1996). The CRV can be defined as the cost to replace an asset in current dollars; a full discussion on CRV is provided in the "What is it worth" section of the accompanying paper (Vanier 2000a).
In 1995, CERF attempted to validate this 2-4% threshold to determine a suitable "level of investment" necessary to maintain constructed facilities (CERF 1996). CERF reported that the average "level of investment" for most facilities surveyed was less than 2% of the CRV and the results of the survey indicated that the recommended 2-4% "would probably not be adequate for facility upkeep if a substantial amount of deferred maintenance existed".
Based on these recommendations from NRC and CERF, using a conservative 2% figure, and taking an established asset base in Canada to be CDN$ 5.5 trillion, it can be roughly estimated that the potential cost of maintenance and repair expenditures per year in Canada alone to be CDN$ 110.0 billion. These rough techniques could also be used to estimate budget requirements for maintenance and repair in any organization. It is more difficult to estimate the amount of deferred maintenance in an organization when inspection data are not available. Rough figures for the amount of deferred maintenance can be obtained by calculating the past years' maintenance expenditures and relating these to the hypothetical 2% per year of CRV, and then by multiplying the result by the number of years when adequate maintenance was not performed. Of course, this does not take into account the compounding effect of deferring maintenance described in the accompanying paper (Vanier 2000a), but can provide a starting ball park figure for asset managers.
3.3.2 Capital Renewal
In order to establish the costs of capital renewal it is first necessary to establish the service life of assets. Most building components or systems have service lives ranging only from 5 to 35 years(HAPM 1995), whereas engineering works, such as bridges, buried utilities and roadways, have values for services life ranging from 10 to 100 years. The average service lives for existing building and engineering works, as suggested by Statistic Canada (1994), are 37 and 30 years, respectively. If a conservative average service life of 35 years is assumed and if asset renewal follows a normal distribution curve, then the entire asset base should be replaced every 70 years, or twice the average age of the asset. That is, half the assets should be replaced before 35 years and the other half should be replaced in the next 35 years. This is a realistic assumption, as only a small percentage of municipal infrastructure has historical value, therefore the majority will not have to be maintained in perpetuity. Dividing the total asset base in Canada (CDN$ 5.5 trillion) by 70 results in required renewals of CDN$110.0 billion each year. However, this method does not take into account a large portion of assets that were constructed before 1980 and are now 20 years old. Some of these assets already require significant maintenance and repair, and others require renewal. An alternative method was developed to take into account the rapid growth of assets in the past three decades, as shown in earlier figures in this presentation. Equation (1) calculates the total renewal requirements using a normal distribution curve for probability of failure (pi), and the annual asset values from Fig. 1. The renewal requirements (rt) in any year (t)
are calculated as the sums of the assets built in each previous year (year t0 through to year t)
multiplied by that year's probability (based on a normal distribution and a 35-year service life).
r = å ni✕ pi where n=value of assets and p= probability of failure in year i Equation (1) i=t0
t
t
The renewal requirements for 1999 (r1999) using this method for Canadian assets alone are
CDN$ 86.5 billion. This is close to the CDN$ 78.6 billion calculated earlier using cruder approximations.
3.3.3 Maintenance, Repair along with Capital Renewal
Assuming that the maintenance and repair figure of CDN$110.0 billion and the capital renewal figure of CDN$ 86.5 billion are mutually exclusive, then the sum of CDN$ 196.5 billion
per year represents the asset management market in Canada. In fact, in Canada the maintenance, repair and renewal market of CDN$ 196.5 billion is almost double the current value of new construction of CDN$ 100 billion, as shown mentioned earlier. These numbers represent a significant base of work for the construction industry, as well as significant expenditures to owners and operators of facilities. Unfortunately, emphasis has been placed on new construction for the past three decades, to the detriment of maintaining the existing facilities (Johnson and Clayton 1998). And this trend is continuing: “Local governments plan an increase of 13.1% [in 1999] to a total of $ 7.6 billion in capital spending” (Statistics Canada 1999). As a result, many organizations may have more facilities than they can afford to maintain; and in many instances, they may be unaware of this situation and their serious predicament.
3.4 What is its condition?
Once the three previous levels of implementation have been investigated, a ballpark financial condition can be obtained using the financial condition index or FCI. As mentioned earlier the FCI is calculated as the amount of deferred maintenance divided by the CRV. The methods described earlier is Section 3.2 can be used to calculate the CRV, whereas Section 3.3 described a simple way to calculate the deferred maintenance. The FCI could be used to compare assets and to prioritize maintenance and repair.
Another step for determining the condition is to assess its technical condition. Engineered Management Systems (EMS), as implemented by the US Army Corps of Engineers, can be used to establish the physical condition and the deferred maintenance of the asset (Vanier 2000a).
The US Army Construction Engineering Research Laboratory (CERL) has pioneered the use of engineered management systems in many construction sectors, such as paving, roofing and rail maintenance. Engineered management systems (EMS) assign a condition index (CI) to an asset based on a number of factors including the number of defects, physical condition and quality of materials or workmanship. The EMS software embodies the results of research studies that estimate the potential degradation of the CI with respect to the loads on the system or external agents acting on materials. With all of these data at hand, it is possible to estimate the future CI, given the current state and a likely degradation curve.
A condition assessment survey (CAS) is another decision-support tool used to establish an asset's existing condition. A CAS produces a benchmark for comparison; not only between different assets, but also for the same asset at different. A CAS records the deficiencies of a system or component, the extent of the defect, as well as the urgency of the repair work. In some cases, the estimated cost of repair is also provided. Management, as a result of the data generated by CAS, is better able to develop optimal plans for maintenance and repair of their buildings.
3.5 What is the remaining service life?
After the extent of an infrastructure portfolio is known, with its value and condition determined, the asset manager must establish the remaining service life in order to calculate the life cycle costs for alternative maintenance, repair and renewal strategies. There are different types of service life, such as the technical service life and the economic service life.
The “technical” service life can be calculated employing techniques such as EMS, Markov chain modeling (Lounis et al 1998) or from life expectancy tables (HAPM 1995). Techniques employing databases such as EMS and sophisticated mathematical modelling using Markov
Chain (Lounis et al 1998) provide estimates for the remaining service life of components and systems. These techniques predict remaining service life based on studies of similar construction forms under test conditions. Unfortunately these techniques require the collection of considerable amounts of data; only a few domains such as bridges, pavement and roofing (Lounis et al 1998) management have reliable service life prediction techniques.
Different data are required to calculate the economic life. Databases such as those from R.S. Means (www.rsmeans.com) or Whitestone Research (www.whitestoneresearch.com) are used to calculate the immediate costs of repairs and to compare these numbers to the costs of renewal. Computer estimating programs can also calculate the costs of maintenance, repair and replacement. The life cycle costs (LCC) of these expenditures can be calculated using standard formulae for building economics (ASTM E917 1994).
Decisions regarding the maintenance, repair, renewal or do-nothing alternatives can be made based on this economic analysis.
3.6 What do you fix first?
Some major asset owners in North America are realizing there will be reductions in operating and maintenance budgets (NRC 1996) and/or "outsourcing" their maintenance and repair responsibilities. Further complicating the asset manager’s challenges are perennial construction problems such as the fragmented and conservative nature of the construction industry and the limited financial resources for research and poor technology transfer to building practitioners (CERF 1996).
All of these conflicting factors can make attaining an organization’s management goals extremely difficult. An analysis of these factors is necessary to identify the technical challenges and opportunities for asset managers. These factors are broken into the following three categories: (1) the financial versus technical factors, (2) the conflicting planning horizons and (3) the network versus project factors.
3.6.1 Financial Versus Technical
Asset managers have a constant technical challenge to weigh the costs of maintenance, repair or renewal versus the technical and functional benefits of implementing a solution. This is exacerbated when there are more projects than funds, or when budgets are continuously shrinking (FCM 1996). In many cases, these managers must allocate funds among competing yet deserving needs; often having to make decisions based on incomplete data (CERF 1996). In addition, the asset managers’ resources are being challenged from all sides: managers are also being asked to privatize operations, outsource responsibilities or reduce overhead. All of these factors make it extremely difficult for long-term decision-making in municipal infrastructure management. 3.6.2 Planning Horizons
Gordon and Shore (1998) have suggested three planning horizons that can illustrate the conflicting nature of long-term decision-making for asset managers: operational, tactical, and strategic. The operational planning horizon is identified as that within the two-year time frame; the tactical planning is the two to five year time horizon, whereas the strategic planning is planning beyond the five-year term. Any proponent of life cycle analysis understands these deterrents to long-term planning: that remedies in the short term may not be the most economical
in the long term. Combining this with conflicting political and administrative agendas, restructuring and amalgamation, as well as rapidly changing targets and plans for each organization, the planning for the strategic horizon is a difficult task.
3.6.3 Network Versus Project
Typically, the asset management tools in current use today deal with individual projects or facilities (Vanier and Danylo 1998); for example, an engineered management system (EMS) deals only with paving condition assessment surveys (CAS) and CMMS may deal only with work orders and/or task scheduling. As any good asset manager realizes, municipal infrastructure is an integrated system and the individual components must function both independently as well as in unison with other systems. For example, many municipal infrastructure systems are networks that depend on the weakest link (e.g. bridge and road networks), or the systems are interdependent, where one network should be replaced at the same time as a neighbouring one (e.g. water distribution and sewer).
Another “network” factor is the level at which asset optimization should take place: discipline, facility or organization. Should one specific discipline (e.g. buildings or fleet) in a municipal portfolio receive a disproportionate amount of funding, should one region attract more funding attention than others, or should one department control the lion’s share of resources?
4 Challenges for the 21st Century
Because not enough is spent on maintenance and repair, owners are accumulating an ever-increasing maintenance deficit, which leads to premature failures and premature renewals. Indeed, even though Canadian cities, for example, currently spend between CDN$ 12 billion and $ 15 billion every year on maintaining and renewing their infrastructure, there is an accumulated shortfall estimated at CDN$ 44 billion to return these assets to an acceptable condition (FCM 1996). Many directors of public works in Canada suspect that this number is low, indicating mounting technical challenges.
The recent announcements of infrastructure renewal programs in both the USA and Canada are an indication that politicians (and voters) are concerned with the rapidly deteriorating infrastructure; however the proposed remedies may be orders of magnitude too small for the situation. The amount of deferred maintenance in some industry sectors is staggering. A "survey of U.S. higher education facilities conditions issued by the Association of Higher Education Facilities Officers (APPA) concluded that there's a backlog of US$26 billion in deferred maintenance, up 27 percent from 1988 estimates" (APPA 1996). The equivalent number for Canada has been reported at CDN$3.6 billion (CAUBO 2000), of which more than CDN$1 billion is considered urgent. In the hospital sector in the USA, there is deferred maintenance equaling 20% of the Capital Replacement Value (CRV), of which 6.7% is deemed urgent (Sawyers 1997).
There have been numerous reports, both in the popular press and research literature, that many buildings are run inefficiently due to poor monitoring and control systems, water and road networks are deteriorating faster than anticipated and the overall condition of Canada’s bridges remains unknown, and potentially hazardous. A lack of knowledge of the condition of the built environment means that the scarce resources that are available for maintenance and repair are
often used inefficiently or inappropriately (CERF 1996). These challenges affect everyone through increased health and safety risks, reduced economic competitiveness, inefficient maintenance strategies, a reduction in the value of a nation’s built assets and a need to increase funding to maintain the built environment. In some cases, this overall inefficiency will actually create the need for “new” buildings and engineering works; even when suitable facilities already exist or can be modified.
Asset managers are the ones who are responsible for managing the substantial maintenance, repair and renewal work. It is their responsibility to optimize expenditures and to maximize the value of assets over their life cycles. In addition, asset managers are faced with many difficult decisions regarding how and when to repair their existing building stock cost-effectively and they have few tools, e.g. literature or intelligent computer software, to assist them in the decision-making process (GAO 1998).
4.1 Need for Decision-Support Tools for Municipal Infrastructure
Efficient information management is the key to better decision-making for municipal infrastructure (CERF 1996). For many organizations, major issues of service delivery are ‘repair and renew’ rather than ‘design and build’ (Johnson and Clayton 1998). Engineers, technical staff, administrators, and politicians all benefit if decisions about maintenance, repair and renewal are based on reliable data, solid engineering principles and accepted economic value. When reliable data and effective decision-support tools are in place, the costs for maintenance, repair and renewal will be reduced and the services will be timely, with less disruptions. These improvements will all reduce the costs of managing municipal infrastructure.
Many major asset owners in North America are beginning to recognize the importance of knowing the current and future states of their infrastructure. For example, the City of Edmonton (1998) recently completed a long-range financial plan for infrastructure assets, in which it recognized the need to increase capital spending and to establish priorities for renewal or new infrastructure facilities.
Meanwhile, Winnipeg (1998) has made recommendations to: (1) invest more in infrastructure, (2) make strategic investments with the dollars they have, and (3) find ways to reduce the magnitude of the infrastructure deficit problem. More specifically relating to decision-support tools, the City of Winnipeg recommends that:
•life cycle costing analysis be used for all decisions related to infrastructure alternatives;
•maintenance can be deferred only if the impact on life expectancy and life cycle costs is minimized, and if maintenance is factored into initial infrastructure costs;
•the city’s infrastructure asset data must be coordinated and managed by the Chief Administrative Officer Secretariat, and
•computerized maintenance management systems must be adopted.
The Governmental Accounting Standards Board (GASB) is also putting in place methods to ensure that governmental agencies account for their assets (McElroy 2000; Lemer 2000).
5 Summary and Conclusions
This presentation describes the six “Whats” of asset management. These six levels of implementation can be used as a methodology for the implementation of an asset management plan in an organization. The asset management plan will provide a framework for collecting the data and information required to make decisions about the strategic plans of an organization.
The extent of the asset management market in Canada is large, upwards of CDN$ 5.5 trillion; while in the USA it could be six-times larger. Maintenance and repair expenditures in Canada are to order of CDN$110.0 billion per year, whereas capital renewal expenses are close to CDN$ 86.5 billion per year. The sum of these two figures is close to double the value of new construction in Canada each year. Managers of municipal infrastructure are realizing the need for effective tools to manage this vast asset base, and are now demanding decision-support tools to help them in their work.
6 References
APPA. (1996) A Foundation to Uphold: A Study of Facilities Conditions at U.S. Colleges and Universities, Association of Higher Education Facilities Officers, Alexandria, Virginia. ASTM E917. (1994) Standard Practice for Measuring Life-Cycle Costs of Buildings and
Building Systems, American Society for Testing and Materials, Philadelphia Pa.
Burns, P., Hope, D., and Roorda, J. (1999) Managing Infrastructure for the Next Generation, Automation in Construction, Vol. 8, 689-703.
CAUBO. (2000) A Point of No Return: The Urgent Need for Infrastructure Renewal at Canadian Universities, Canadian Association of University Business Officers, Ottawa, Ontario, Canada.
CERF. (1996) Level of Investment Study: Facility and Infrastructure Maintenance and Repair, Civil Engineering Research Foundation, Washington, D.C.
CICA. (1989) Accounting and Reporting for Physical Assets by Governments, Canadian Institute of Chartered Accountants, Toronto, Ontario, Canada.
Edmonton. (1998) Securing our Future: Edmonton’s Long Range Financial Plan, KPMG presentation to Council, Available from: The City of Edmonton, Alberta, Canada. ENR. (2000) Engineering News Record: Building Cost Index History (1915-2000),
www.enr.com/cost/costbci.asp
FCM. (1995) Report on the State of Municipal Infrastructure, Federation of Canadian
Municipalities. Available from: Federation of Canadian Municipalities, Ottawa Canada and McGill University, Montreal Canada.
FFC. (2000) Financial Forecast Center, http://www.forecasts.org, data from 1971 onwards was obtained from http://www.forecasts.org/data/data/EXCAUS.htm, data before 1971 was obtained from the Andex Chart, Andex Associates, 2996 Deziel Drive, Windsor, ON N8W 5H8.
GAO. (1998) Leading Practices in Capital Decision-Making, United States General Accounting Board, Washington, D.C.
Gordon, A.R. and Shore, K.R. (1998) Life Cycle Renewal as a Business Process, Innovations in Urban Infrastructure Seminar of the APWA International Public Works Congress, Las Vegas, Nevada, USA, pp. 41-53 (http://www.nrc.ca/irc/uir/apwa/apwa98).
HAPM. (1995) LifeSpans of Building Components, Technical Note 6, Housing Association Property Mutual, June, 1995, London (http://www.hapm.co.uk).
Johnson, R. E., and Clayton, M.J. (1998) The Impact of Information Technology in Design and Construction: The Owner’s Perspective, Automation in Construction, (8) 3-14.
Lemer, A.C. (2000) Advancing infrastructure-asset management in the GASB 34 age: Who’s driving the train?, Innovations in Urban Infrastructure Seminar of the APWA International Public Works Congress, Louisville, KY, U.S.A, pp. 57-64.
(http://www.nrc.ca/irc/uir/apwa/apwa2000).
Lounis, Z. Vanier, D.J. Lacasse, M.A. and Kyle, B.R (1998) Effective decision-making tools for roofing maintenance management, First International Conference on New Information Technologies for Decision Making in Construction, Montreal, Canada, pp. 425-436, (http://www.nrc.ca/irc/fulltext/nrcc42831.pdf).
McElroy, R.S. (2000) U.S. Federal Highway Administration Initiatives - 1999-2000
Transportation Asset Management, Innovations in Urban Infrastructure Seminar of the APWA International Public Works Congress, Louisville, KY, U.S.A, pp. 15-24
(http://www.nrc.ca/irc/uir/apwa/apwa2000).
Melvin, E. (1992) Plan, Predict, Prevent: How to Reinvest in Public Buildings, Special Report #62, American Public Works Association Research Foundation, Chicago, IL.
NACUBO. (1990) Managing the Facilities Portfolio, National Association of College and University Business Officers, Washington, D.C.
NRC. (1990) Committing to the Cost of Ownership, Building Research Board, National Research Council, Special Report # 60, Washington, D.C.
NRC. (1994) Toward Infrastructure Improvement: An Agenda for Research, Building Research Board, National Research Council, National Academy Press, Washington, D.C.
NRC. (1996) Budgeting for Facilities Maintenance and Repair Activities, Standing Committee on Operations and Maintenance, Report 131, National Research Council, National Academy Press, Washington, D.C.
NRC. (1999) Research Agenda for Test Methods and Models to Simulate the Accelerated Aging of Infrastructure Materials, Board on Infrastructure and the Constructed Environment, National Research Council, National Academy Press, Washington, D.C.
Sawyers, J. (1997) Building Condition Management, Canadian Healthcare Engineering Society Quarterly Journal, Summer/Winter, Canadian Healthcare Engineering Society, North York, Canada. (http://www.ches.org/chesjournal/journal97/art9701.html)
Statistics Canada. (1994) Fixed Capital Flows and Stocks, 1961-1994 Historical, Statistics Canada, Ottawa, Canada.
Statistics Canada. (1996) Capital Expenditures by Type of Asset, Statistics Canada, Ottawa, Canada.
Statistics Canada. (1999) Private and Public Investment in Canada, Intentions 1999, Statistics Canada, Ottawa, Canada
US Census Supplement. (1981) C30 – 80 Supplement, U.S. Census Board, United States Department of Commerce, Washington, D.C.
US Census. (1999) Value of New Construction Put In Place, U.S. Census Board, United States
Department of Commerce, Washington, D.C., (http://www.census.gov/const/www/
index.html).
Vanier D.J., and Danylo, N. (1998) Municipal Infrastructure Investment Planning: Asset Management, Innovations in Urban Infrastructure Seminar of the APWA International Public Works Congress, Las Vegas, NV, USA, , 25-39
(http://www.nrc.ca/irc/uir/apwa/apwa98).
Vanier, D.J. (1999) Why Industry Needs Asset Management Tools, Innovations in Urban Infrastructure Seminar of the APWA International Public Works Congress, Denver, U.S.A, pp. 11-25, (http://www.nrc.ca/irc/uir/apwa/apwa99).
Vanier, D.J. (2000) Whole Life Building Management: Occupancy to Dismantling, Construction Information Technology 2000, Reykjavik, Iceland, Jun., pp. 983-995.
Vanier, D.J. (2000a) Asset Management 101: A Primer, Innovations in Urban Infrastructure Seminar of the APWA International Public Works Congress, Louisville, KY, U.S.A, pp. 1-14
(http://www.nrc.ca/irc/uir/apwa/apwa2000).
Winnipeg. (1998) Strategic Infrastructure Reinvestment Policy: Report and Recommendations, Available from: Strategic Infrastructure Reinvestment Policy, City of Winnipeg, 100 Main Street, Winnipeg, Manitoba, Canada R3C 1A4, Tel: (204) 986-7997.