Application of the Production System Design Framework in the
Automotive Components Industry
by
Carlos Tapia
B.S. Engineering
Massachusetts Institute of Technology, 1999
Submitted to the Department of Mechanical Engineering in Partial Fulfillment of the Requirements for the Degree of
Master of Science in Mechanical Engineering at the
Massachusetts Institute of Technology June 2001
© 2001 Massachusetts Institute of Technology
All rights reserved
B3ARKER MASSACHUSETTS INSTITUTE OF TECHNOLOGY
JUL 16 2001
LIBRARIES Signature of author...7 ...Department of Mechanical Engineering May 5, 2001
C ertified by ...
David S. Cochran Assistant Professor of Mechanical Engineering Thesis Supervisor
Accepted by... ...
Ain A. Sonin Chairman, Department Committee on Graduate Students
Application of the Production System Design Framework in the
Automotive Components Industry
by
Carlos Tapia
Submitted to the Department of Mechanical Engineering
on May 5 th, 2001 in Partial Fulfillment of the Requirements for the Degree of Master of Science in Mechanical Engineering
ABSTRACT
The environment that companies face nowadays is increasingly competitive. In this setting firms must ensure that its Production System is aligned with its business objectives. However, Production Systems can be extremely complex and their design involves many different disciplines. The Manufacturing System Design Decomposition (MSDD) developed by the Production System Design Laboratory at MIT is useful to identify the objectives (Functional Requirements - FRs), and the corresponding implementation (Design Parameters - DPs) for the key decisions that must be made to design a manufacturing system. This work presents the Production System Design Framework, which is based on the MSDD, as a roadmap to approach the intricate design and implementation process. Special attention is placed on an important part of the framework: The Production System Design and Deployment Steps.
This thesis exhibits the direct application of the PSD Framework to the design and implementation of an automotive components production system. The basis for this design is the
MSDD and it is implemented through the Production System Design and Deployment Steps.
Each step is described in detail and it is explained how it was adapted to the particular requirements of the project. Additionally, a manufacturing system of electronics components is examined. Two different system designs for the same product are studied. The analysis is performed using traditional performance metrics as the evaluating criteria. In addition, this analysis is contrasted to an analysis made using the MSDD. The similarities of the results validate the importance of the MSDD. Furthermore, the MSDD is used to identify potential areas
for improvement.
Thesis Supervisor: David S. Cochran
Acknowledgements
Acknowledgements
This thesis and the concepts described in it are possible because of the help of others. There are many to thank, but I especially want to acknowledge Prof. David S. Cochran for sharing his many insights into the theory of Production System Design. I would like to thank him for giving me the opportunity to be a part of the PSD lab. This work would not have been possible without his guidance and support. My thanks also go to Pat Smethurst for her help and sense of humor. To the all the lab members for providing me with valuable advice and contributing to my education - Jorge, Jim, Jose, Ania, Jochen, Brandon, Kola, Abhinav, Yong-Suk, Jongyoon, Charlie, Salim, Zhenwei and Quinton. Special thanks to Keith for the chinese food in all those trips to Motown. I also want to thank the people at Visteon who welcomed me and helped with my work: Tony Scargall, Mark Wilkins, Greg Nycholas, Kevin Poet, Bob Adamski and Tim Grbavac.
I want to acknowledge the support and love that I received from my family. I give my
special thanks to my parents Elsa and Carlos for guiding me and letting me become "el Charlie". They are the best example one could ever hope in life. To my sister Jimena for being my female hero, to my brother Julio for putting up with me and teaching me a few valuable lessons and my "biggest" brother Joaquin for always being authentic. To Iliana who has walked with me all the way. Thank you for your patience and support.
Finally, I would like to thank the people who where close to me during my MIT years. To my friends in Boston, I never thought MIT could be this much fun - Memo, Pablo, Danny, Rodrigo, Cesar, Deny, Bruno, Luis Mario, Jose, Hidrovo, Jonathan, Ferran and Kelly.
Table of Contents
Table of Contents
ACKNOW LEDGEM ENTS ... 5
INTRO DU CTIO N ... 13
C HAPTER SUM M ARIES ... 13
Chapter 1: The Production System Design Framework... 13
Chapter 2: The Production System Design and Deployment Steps... 14
Chapter 3: Visteon Axle Plant: Designing the Production System for the Rainbow Product ... 1 5 Chapter 4: Case Study: Visteon Electronics Plant ... 15
CHAPTER 1: THE PRODUCTION SYSTEM DESIGN FRAMEWORK... 17
1.1 A XIOM ATIC D ESIGN ... 17
1.2 THE PRODUCTION SYSTEM DESIGN FRAMEWORK... 20
1.2.1 The Manufacturing System Design Decomposition... 22
CHAPTER 2: THE PRODUCTION SYSTEM DESIGN AND DEPLOYMENT STEPS 25 2.1 STEP 1: CREATE A COMMON MENTAL MODEL OF THE MANUFACTURING SYSTEM DESIGN OBJECTIVES AND M EAN S ... 27
2.2 STEP 2: DEVELOP THE MANUFACTURING SYSTEM DESIGN DECOMPOSITION AND ALIGN PERFORMANCE M EASURES WITH THE FR's ... 27
2.3 STEP 3: IDENTIFY THE FINAL (EXTERNAL) CUSTOMER AND CREATE A CUSTOMER-FOCUSED CAPACITY PLANNING PROCESS (THAT ENABLES CAPACITY TO BE PUT IN PLACE ACCORDING TO A VALUE STREAM AND NOT OPERATIONS)... 29
2.4 STEP 4: DEFINE CUSTOMER TAKT TIME (SUBJECT TO > 30 SECONDS) ... 32
2.5 STEP 5: DEFINE THE LINKED-CELL SYSTEM FLOW ... 34
2.6 STEP 6: FORM CELLS BASED ON TAKT TIME... 37
2.6.1 Form ing Cells (cells vs. Other)... 37
2.6.2 Equipment Design/Selection... 41
2.6.3 Cell Layout D esign ... 45
2.6.4 Standardized Work M ethods... 46
2.7 STEP 7: REDUCE SETUP TIME... 50
2.8 STEP 8: LEVEL FINAL ASSEMBLY - REDUCE THE RUN SIZE ... 52
2.9 STEP 9: OPERATE THE LINKED SYSTEM WITH LEVELING AND PACING (INITIALLY WITH LARGE SWIP 'STANDARD WORK IN PROCESS' BETWEEN CELLS) ... 56
2.10 STEP 10: SYSTEMATICALLY REDUCE SWIP BETWEEN CELLS TO REDUCE VARIATION -IMPROVE RELIABILITY OF MACHINES, OPERATOR'S WORK, -IMPROVE CAPABILITY OF MACHINES & M ISTAKE-PROOF PROCESSES... 60
2.11 STEP 11: LINK SUPPLIERS ... 60
2.12 STEP 12: ALIGN PRODUCT DEVELOPMENT WITH THE LINKED-CELL SYSTEM OF PLANTS. 61 CHAPTER 3: VISTEON AXLE PLANT: DESIGNING THE PRODUCTION SYSTEM FOR THE RAINBOW PRODUCT... 63
3.1 IN TRO D U CTIO N ... 63
Application of the Production System Design Framework in the Automotive Industry
3.3.1 Steps 1 &2: Forming a common mental model and developing clear objectives. 71
3.3.2 Step 3: Identifying the customer and planning the capacity... 71
3.3.3 Step 4: D efining takt tim e ... 71
3.3.4 Step 5: Defining production flow... 72
3.3.5 Step 6: F orm ing cells ... 74
3.3.5.1 Equipm ent Selection ... 75
3.3.5.2 L ayout D esign ... 78
3.3.5.3 Standardized Work Methods... 82
3.3.6 Step 7 & 8: Reducing setup times and Leveling production ... 84
3.3.7 Step 9 & 10: Operating the linked system ... 84
3.3.8 Step 11: Linking suppliers ... 85
3.3.9 Step 12: Align product development ... 85
CHAPTER 4: CASE STUDY: VISTEON ELECTRONICS PLANT ... 87
4.1 MATERIAL AND INFORMATION FLOW ... 88
4.1.1 M aterial F low ... 88
4.1.1.1 SM D Process... 89
4.1.1.2 Lam ination Process... 90
4 .1.1.3 P ack in g ... 95
4.1.2 Inform ation F low ... 96
4.1.2.1 Scheduling... 96
4.2 LAM INATION A NALYSIS... 97
4.2.1 Observed Performance at Lamination: High-speed Line and Cell ... 97
4.2.2 Analysis of Lamination Processes using the MSDD... 98
4.2.2.1 The Manufacturing System Design Decomposition (MSDD)... 98
4.2.2.2 Evaluation of the High-Speed Lamination line using the MSDD ... 100
4.2.2.3 Evaluation of "Lean" Cell Lamination system using the MSDD ... 100
4.2.3 Recommendations for cellular implementation derived from the MSDD... 101
4.3 E QUIPM ENT D ESIGN ... 104
4.3.1 Equipment comparison based on the MSDD... 104
4.3.1.1 Application of the Equipment Evaluation Tool... 105
CONCLUSION ... 109
REFERENCES... 111
APPENDIX A: MANUFACTURING SYSTEM DESIGN DECOMPOSITION V5.1 ... 115
APPENDIX B: DIFFERENTIAL CASE ASSEMBLY FIXTURE ... 123
APPENDIX C: VISTEON RAINBOW CASE CELL PART HANDLING METHOD...128
APPENDIX D: LAMINATION HIGH-SPEED LINE PROCESS STEPS... 135
APPENDIX E: LAMINATION CELL PROCESS STEPS ... 139
APPENDIX F: WORK LOOPS FOR THE "LEAN" CELL ... 145
List of Figures
List of Figures
Figure 1-1: The Axiomatic Design Domains [Suh, 1990]... 18
Figure 1-2: Graphical representation of a design matrix ... 19
Figure 1-3: The Production System Design and Deployment Framework... 21
Figure 1-4: Upper levels of the MSDD... 24
Figure 2-1: Hierarchical approach to production system design ... 25
Figure 2-2: Incomplete Performance Measures Driving Manufacturing System Design... 28
Figure 2-3: Performance Measures to Achieve the Goals of the Manufacturing System Design and Production System D esign ... 29
Figure 2-4: Uncertainty in demand forecasts... 31
Figure 2-5: Capacity implementations over time... 32
Figure 2-6: Takt times determined by the average demand for each period ... 33
Figure 2-7: Demand distribution and resulting cell capacity range... 34
Figure 2-8: Basic Value Stream Mapping Icons... 35
Figure 2-9: V alue stream m ap exam ple ... 37
Figure 2-10:FRs from MSDD that Affect Equipment Design and Operation... 41
Figure 2-11: Design for serviceability: access to machine does not interrupt the work... 43
Figure 2-12: Unobtrusive material feeding... 44
Figure 2-13: Elements of standardized work methods ... 47
Figure 2-14: Examples of Standard Work Combination Sheets... 48
Figure 2-15: Illustration of balanced and unbalanced production ... 50
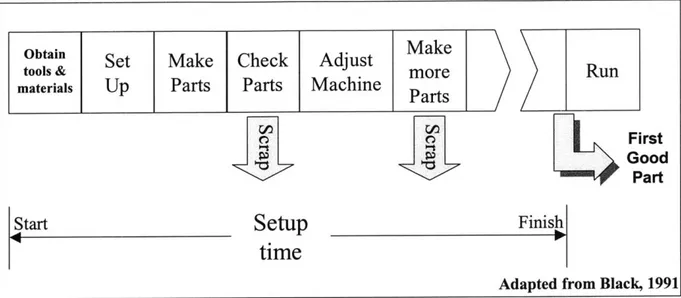
Figure 2-16: The role of adjustment in the internal setup process... 52
Figure 2-17: Leveling product mix to customer demand interval ... 53
Figure 2-18: WIP variations caused by a system not leveled by cycle time... 54
Figure 2-19: Heijunka box with three part types ... 55
Figure 2-20: Classification of kanban types according to function and production lot size... 57
Figure 2-21: Kanban complimentary loops ... 58
Figure 2-22:CON W IP pull system ... 59
Figure 2-23: The design for Manufacturing (DFM) method ... 62
Figure 3-1: R ear axle assem bly... 64
Figure 3-2: Complexity caused by the layout... 65
Figure 3-3: The Rainbow rear differential... 66
Figure 3-4: Rainbow components manufactured in-house ... 67
Figure 3-5: Green-End Process Plan... 68
Figure 3-6: Hard-end Cell Process Plan... 69
Figure 3-7: Differential Gear Case Cell Process Plan ... 70
Figure 3-8: Differential case value stream map ... 73
Figure 3-9: Gear production value stream map ... 74
Figure 3-10: Operation break-up to reduce walking distance... 76
Figure 3-11: D ifferential Case Cell... 78
Figure 3-12: Differential Case Cell Layout ... 79
Figure 3-13: Green-End Gear Cell Layout ... 79
Figure 3-14: Hard-end Gear Cell Layout... 80
Figure 3-15: R ack to help carry the parts... 81
Application of the Production System Design Framework in the Automotive Industry
Figure 3-18: Standardized Work Combination Sheet for the Green-End cell... 82
Figure 3-19: Standardized Work Combination Sheet for the Assembly cell... 83
Figure 3-20: Standardized Work Combination Sheet for the Hard-End Cell... 84
Figure 4-1: EEC production steps... 88
Figure 4-2: SMD Top-Side Process Sequence... 90
Figure 4-3: Relative Size Comparison between Cell and automated Line ... 91
Figure 4-4: High-speed, asynchronous, automated assembly line layout (CT=10sec.)... 93
Figure 4-5: Lamination "Lean" Cell Layout ... 94
Figure 4-6: Value Stream Map of the EEC Production... 96
Figure 4-7: Upper level FRs and DPs of the MSDD ... 99
Figure 4-8: High-Speed Line Evaluation Using the MSDD... 100
Figure 4-9: Lean Cell Evaluation Using the MSDD... 101
Figure 4-10: Proposed Value Stream Map... 103
Figure 4-11: PCB-Casting screw-down... 106
Figure 4-12: Solder application at the cell... 106
Figure 4-13: Loading conformal coater ... 107
Figure A-0-1: Diff Case Assembly Fixture ... 123
Figure A-0-2: Inserting the bottom diff gear ... 124
Figure A-0-3: Holding the top diff gear in place ... 124
Figure A-0-4: Pulling the guiding rod lever ... 125
Figure A-0-5: Inserting the remaining side gear... 126
Figure A-0-6: Incoming material... 128
Figure A-0-7: Unload boring machine... 128
Figure A-0-8: Load boring machine ... 129
Figure A-0-9: Unload turning machine... 129
Figure A-0-10: Load turning machine ... 130
Figure A-0-1 1: Load washing machine ... 130
Figure A-0-12: Assembly station... 131
Figure A-0- 13: Unload machining center Outside stations ... 132
Figure A-0-14: Unload machining center Inside stations... 132
Figure A-0- 15: Load machining center Outside stations... 133
Figure A-0-16: Load machining center Inside stations... 133
List of Figures
List of Tables
Table 1: The Production System Design And Deployment Steps ... 14
Table 2-1: The twelve steps of Production System Design [Cochran, 1999]... 26
Table 2-2: Characteristics of manufacturing systems... 38
Table 2-3: FRs that affect equipment design and operation arranged by area... 42
Table 3-1: Takt times for the range of expected demand ... 72
Table 3-2: Takt times for the Rainbow cells... 75
Table 4-1: High-speed Line Process Steps ... 92
Table 4-2: Lamination Cell Process Steps ... 94
Table 4-3 Observed performance at the lamination high-speed line and cell (Normalized for v o lu m e) ... 9 8 Table 4-4: Satisfaction of MSDD leaf FRs at Lamination ... 101
Table 4-5: Low performing FR/DPs for the cellular system ... 102
Table 4-6: Evaluation scores of processes at both lines using the EET... 105
Table A-1: Differential Case Opereator Work Sequence ... 127
Table A-2: Lamination High-speed Line Process Sequence ... 135
Introduction
Introduction
This thesis has three objectives: to present a structured framework for the design and implementation of manufacturing systems, to present a case study where the framework is utilized and to provide a case study where the validity of the approach is tested.
Manufacturing systems can be extremely complex and their design involves many different disciplines. In order to tackle a problem of this magnitude in a structured manner, the Production System Design Laboratory at MIT developed the Manufacturing System Design Decomposition (MSDD) [Cochran, Arinez, Duda, Linck, 2000]. The MSDD was developed using Axiomatic Design and it is the centerpiece of the framework presented in this work. The
MSDD provides the requirements of the system and helps the designer relate objectives and
means, and low-level decisions to the higher-level goals of the organization. The MSDD and the design and implementation framework are put to practice in the design of a real Manufacturing System and the analysis of an evolving system respectively.
Chapter Summaries
Chapter 1: The Production System Design Framework
This chapter introduces the Production System Design (PSD) Framework that was developed Production System Design Laboratory at the Massachusetts Institute of Technology under the direction of Professor David S. Cochran. The chapter begins with the description of the Axiomatic Design process. Axiomatic Design is a tool that was developed to provide structure and a scientific foundation to the design process [Suh, 1990]. The Axiomatic Design methodology aids in the process of deciding what a design intends to do (Functional Requirements) and how it intends to achieve it (Design Parameters) and is provides the structured thought process behind the Manufacturing System Design Decomposition (MSDD).
The chapter briefly describes the components of the PSD framework: the MSDD, the Manufacturing System Design Matrix, the Manufacturing System Design Evaluation Tool, the Equipment Evaluation Tool, the Manufacturing System Design Flowchart and the Production
Application of the Production System Design Framework in the Automotive Industry
Chapter 2: The Production System Design and Deployment Steps
This chapter recognizes the complexity in manufacturing systems and the difficulty of identifying a logical path to follow when thinking about the features of a system. To approach this problem, this chapter presents the Production System Design and Deployment Steps shown in Table 1 from the Production System Design and Deployment Framework as a roadmap to approach the intricate process of designing the Production System and its subsequent implementation. Each one of the twelve steps is described in detail throughout the chapter.
Table 1: The Production System Design And Deployment Steps
Step 1. Create a common mental model of the Manufacturing System Design objectives and means
Step 2. Develop the Manufacturing System Design Decomposition and align Performance Measures with the FR's
Step 3. Identify the final (external) customer and create a customer-focused capacity planning process (that enables capacity to be put in place according to a Value Stream and not operations)
Step 4. Define customer Takt time (subject to < 30 seconds)
Step 5. Define the linked-cell system flow Step 6. Form cells based on takt time
Step 7. Reduce setup time in final assembly
Step 8. Level final assembly - reduce the run size
Step 9. Operate the linked system with leveling and pacing (Initially with large SWIP 'Standard Work in Process' between cells)
Step 10. Systematically reduce SWIP between cells to reduce variation - improve reliability of machines, operator's work, improve capability of machines & mistake-proof processes.
Step 11. Link Suppliers
Introduction
Chapter 3: Visteon Axle Plant: Designing the Production System for the Rainbow Product
This chapter covers the work performed by the author in the design of a manufacturing system at a Visteon Axle Plant. The system is intended to produce a single differential (named the Rainbow differential) with no product variations. The basis for this design is the MSDD and it is implemented through the Production System Design and Deployment Steps. The chapter follows each step and describes how it was adapted to the particular requirements of the production of the Rainbow differential.
Chapter 4: Case Study: Visteon Electronics Plant
This chapter presents the work carried out at Visteon North Penn Electronics Plant, a manufacturer of electronic engine controllers for automobiles. The production process in this plant is of particular interest for the scope of this thesis because two different production approaches are used during one stage of the production of these modules. These approaches are the typical asynchronous transfer line and a cellular approach. The chapter explains the material and information flow throughout the plant. It then presents an analysis the two different production approaches that are used. The analysis is performed using traditional performance metrics as the evaluating criteria. Additionally this analysis is contrasted to an analysis made using the MSDD. The similarities of the results validate the importance of the MSDD. Furthermore, the MSDD is capable of identifying potential areas for improvement. Finally, the equipment at North Penn is evaluated through the lens of the MSDD.
The Production System Design Framework
Chapter 1: The Production System Design
Framework
1.1 Axiomatic Design
Axiomatic Design is a tool that was developed to give structure to the design process. Traditionally, design has not been considered a scientific process but rather a skill that is innate to some, and that cannot be developed [Chu and Cochran, 2000]. The fundamental goal of Axiomatic Design is to create a science base for design and a theoretical foundation based on a systematic thought process that can be applied in any design scenario [Suh, 1990]. There are many elements in the design process, but the axiomatic design process focuses on the generation of requirements and the corresponding means to achieve them.
Axiomatic Design answers the basic questions concerning what the design intends to achieve and how it intends to achieve it [Suh, 1990]. It characterizes the design into three domains: the Customer Domain, the Functional Domain and the Physical Domain. In order to achieve the initial objectives, a continuous interaction between these three domains is necessary. Figure 1-1 illustrates the design domains and the interactions between them. The customer domain relates to the customer related objectives such as customer needs, expectations, specifications, constraints, etc. The first step in the axiomatic design methodology begins in this domain with the identification of customer needs. The customer domain leads to the development of Functional Requirements (FRs) that capture the answer to the first question:
"what the design intends to achieve?" The Design Parameters (DPs) answer the second question
concerning how to achieve the requirements. Regularly, it is necessary to further decompose the DPs into lower level FRs in order to identify what is needed to realize the DP in question. This process is repeated for the new set of FRs until the level of detail is enough to complete the design.
Application of the Production System Design Framework in the Automotive Industry Customer Wants (Internal & External) Customer Domain -Customer needs -Expectations -Specifications *Constraints, etc. What? FRs Functional Dom -Design Objectiv ~ How! DPs
ain Physical Domain
es -Physical
Implementation
Figure 1-1: The Axiomatic Design Domains [Suh, 19901
In Axiomatic Design, possible DPs [Suh, 1990]:
two axioms are used to ensure the selection of the best set of
1. The Independence Axiom: Maintain the independence of the functional requirements.
2. 2. The Information Axiom: Minimize the information content of the design.
The independence axiom states that the optimal design solution includes FRs that can be individually satisfied without affecting the rest of the FRs. The relationship between FRs and DPs can be represented with design matrices as follows:
{FR's} = [A] {DP's} (1)
where the relationships between the vector of FRs and the DPs is represented with the design matrix A [Tate, 1999]. The design matrix A contains either a 0 or an X to indicate the presence or absence of a relationship between an FR and the corresponding DP. If the adjustment of a DP affects in any way the achievement of an FR, the design matrix uses an X to represent this relationship. Equation 2 shows an example of such representation:
The Production System Design Framework
FRI ~X 0 0~ DP
FR2 X X 0 DP (2)
FR3 _X 0 X_ DP
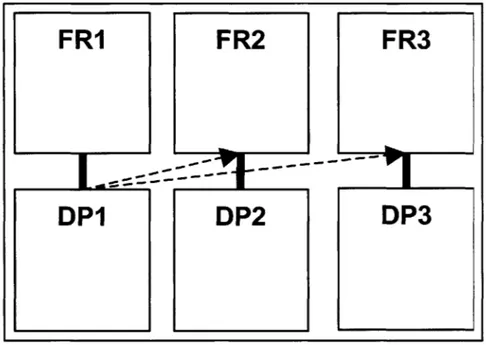
The information contained in the design matrix can also be displayed graphically. The relationships marked with an X in the off-diagonal elements of the design matrix are replaced with arrows that start at the DP in question and point to the FR that is affected. Figure 1-2 shows a graphic representation of equation (2).
FR1
FR2
FR3
DP1
DP2
DP3
Figure 1-2: Graphical representation of a design matrix
When the first axiom is satisfied, the design matrix will be diagonal. The DPs will only affect their corresponding FRs. The design represented with a diagonal matrix is said to be uncoupled and is the best design. On the other, hand there are cases where the independence axiom cannot be fully satisfied. The most interesting case is where the design is partially coupled and the design matrix can be arranged such that the result is an upper triangular or lower triangular matrix. In this case the design is said to be "decoupled" and is also an acceptable design although its implementation becomes path-dependent. The last case is where the design matrix cannot be arranged into a triangular matrix leading to an unacceptable coupled design.
Application of the Production System Design Framework in the Automotive Industry
The second axiom states that an optimal design should minimize the information content. The idea is to minimize the complexity of the design, but it is rather difficult to quantify this parameter. The second axiom was not formally utilized when developing the MSDD and thus will not be discussed further [Cochran, Arinez, Duda and Linck, 2000].
1.2 The Production System Design Framework
In order to discuss the implications of the design of production systems, the concept of system must first be defined. A system takes in a set of inputs and acts on them to produce a desired output [Parnaby, 1979]. A system can be conformed by several subsystems that interact and the overall system's output is the product of these interactions. A Manufacturing System is a subsystem of a Production System. A Manufacturing System consists of the arrangement and operation of machines, tools, material, people and information to produce a value-added physical, informational or service product whose success and cost is characterized by measurable parameters [Cochran, 1999]. A Production System in turn is comprised of the Manufacturing
System as well as all the functions that support its functioning.
The inherent complexity of a Production System makes its design a challenging task. In many cases, the complexity of such a system drives the optimization of subsystems in the hope that the sum of these individual pieces will result in the best overall system design. A good Production System design is seldom achieved through this approach resulting in system that are
difficult to control and do not meet the enterprise's objectives.
The Production System Design (PSD) Framework developed in the Production System Design Laboratory at the Massachusetts Institute of Technology provides a methodology to convert the objectives of the organization into design and implementation actions on the shop floor [Cochran, 1999]. It utilizes Axiomatic Design to recognize the objectives (Functional Requirements) and the corresponding physical implementation (Design Parameters). The PSD Framework also serves as a platform to effectively communicate the goals and decisions to the people that form the organization. Furthermore, it goes beyond the design stages and aids in the
implementation and control of the Production System.
The Production System Design Framework
" The Manufacturing System Design Decomposition (MSDD) * The Manufacturing System Design Matrix
* The Manufacturing System Design Evaluation Tool * The Equipment Evaluation Tool
" The Manufacturing System Design Flowchart, and " The Production System Design and Deployment Steps.
Figure 1-3 shows the PSD Framework with all its components.
Production System Design and Deployment Framework
This Framework shows the intenelation between the Design and Deployment of a Production System. To learn more about what we do at the Production System Design Laboratory, please visit us at our website: http://psd.mit.edu/
Design
S USE
Decoposiion Manufacturing System
Manufacturing System Design Decomposition D i Matrix
Functional Requirements and Design Parameters of a illustrates relationships
Manufacturing System between DP's and FR's
Manufacturing System Design
Evaluation Tool
Assessment of how well a MS is designed
Equipment Evaluation Tool Assessment of how well equipment is
designed
Deployment
Manufacturing System Design Flowchart
Shows implementation precedence of Design Parameters 12 Production System Design & Deployment Steps
1. Create a common mental model ofthe Manufacturing System Design objectives and means 2. Develop the Manufacturing System Design Decomposition and align Performance Measures
With thteFR's
3. Identifytte final (external) customer and create a customer focused capacty plannng process (that enals catacity to be put in place accorinog to a Value Stream and nt operations) 4. Define customer Tat time (subject to ? 30 seconds)
5. Define the linked-cell system flow
6. Form cells based on takt time
7. Reduce setup time in final assembly
S. Level final assembly - reduce the ran size
9. Operate the linked system with leveling and pacing (Initially with large SWIP Standard Work in Process' betwseen cells)
10. Systenastically reduce SWIP betwemn cells to reduce variation -timprove reltabisityof
t.aci es, opeator's work, inpove capabity of machies& misuke-psof processes.
]I. Link Suppliers
12. Align product development with the linked-cell system of plants
P s
T PiductiDn System Design Laboratoryand Depymen Framework
.S, JL.,n#U*." and w 1
PDepFomenv5t Frmeor
Figure 1-3: The Production System Design and Deployment Framework
The MSDD is the focal element of the PSD Framework. It identifies the objectives of the system design as well as the means to achieve those objectives. Because of its importance, it will be described in more detail in the next section.
Application of the Production System Design Framework in the Automotive Industry
The Manufacturing System Design Matrix is the direct representation of the relationships between the Functional Requirements and Design Parameters at the fourth level of the MSDD. It clearly communicates the path dependencies in the design and identifies the order in which the objectives must be satisfied. It also demonstrates that the independence axiom of Axiomatic Design is satisfied.
The Manufacturing System Design Evaluation Tool and the Equipment Evaluation Tool where derived also from the MSDD. The tools evaluate the extent to which a particular manufacturing design achieves the FRs stated in the fourth level of the MSDD [Gomez, 2000]. The tools allow the designer to use a six level grading system to evaluate different aspects of the design. Both evaluation tools follow the same format but the Equipment Evaluation Tool focuses on the equipment subsystem of a Manufacturing System.
The Manufacturing System Design Flowchart is a graphical representation of the system design architecture [Suh, Cochran, Lima, 1998]. The flowchart is directly derived from the design matrix. It represents the path-dependent design information shown in the design matrix. The implementation precedence is graphically displayed in a clear fashion to facilitate its communication.
Finally, the Production System Design and Deployment Steps provide a roadmap to approach the intricate process of designing the Production System and its subsequent implementation. This thesis will focus on this component of the PSD Framework. Chapter 2 describes in detail each step and discusses its role and importance in the design and deployment process.
1.2.1 The Manufacturing System Design Decomposition
The Manufacturing System Design Decomposition (MSDD) is the centerpiece of the Production System Design framework. It identifies the design relationships to achieve an optimal production system design [Cochran, 1999]. The MSDD is the direct result of applying Axiomatic Design concepts to the design of a Manufacturing System. Axiomatic Design is useful to identify the objectives (Functional Requirements - FRs) and the corresponding implementation (Design Parameters - DPs) for the key decisions that must be made to design a manufacturing system. The focus of the MSDD is on those decisions and activities that will be under the direct control
The Production System Design Framework
of the group of engineers, managers and operators involved in the design and control of the manufacturing system.
The Decomposition starts with an overall objective (FR) of improving ROI over the life of the system in question [Cochran, Arinez, Duda, and Linck, 2000]. The Design Parameter chosen to satisfy the initial FR is: "Manufacturing System Design." The DP was chosen over several other possible ways of improving ROI because the focus of the MSDD is on the design of manufacturing systems. The DP is still vague and further decomposition is needed to reach a comprehensive design. The next level of FRs is derived based on the components of ROI:
ROI = REVENUE - COST (3)
INVESTMENT
Therefore, the Investment and Cost of the system must be minimized. On the other hand, the Revenue must be maximized. Again, these elements are considered over the life of the manufacturing system in order to maximize the long-term return on investment. The process continues with the identification of DPs for these lower-level FRs. This process is repeated where more detail is needed. The decomposition of the initial FRs in this manner leads to lower-level implementable actions that can be grouped into functional areas. Figure 1-4 shows the first few levels of the MSDD and the categorization of the branches into functional areas. Appendix
Application of the Production System Design Framework in the Automotive Industry FR1 M11im1 10f-term return on inwstmrrt DPI ManQdacturing System Design FR11 FR12 FR13
Maxii sales revenue Minimize production costs MRim Cnestsent r
I obleycl prodctiosytepn
DPFu1 DP12 DP13
Production to maximize Elimination of nopjalue Investment based se a
CuIstOmer Satisfaction ading sources of cost lorg-termstrategy
FR111 FRI12 FR113 FR121 FR122 FR123 Manufacture products to Deliver prodobts)Wltime Meet customer expected Red uce waste in direct Reduce waste in indirect Minimize facilities cost target design specifications lead time- labor labor
DP-111 DP112: DP113 DP121 DP12 DP123 Production processes with Throughput time Mean throughpt Elimination of non-value Reducion of indirect :Iabor Reduction of consumed minimal variation from target variation reduction tierdcinadding manual tasks tssfloor Spame
FRR FRP1
Respond rapidly to Minimize production production disruptions disruptions
DP.R1 DP.P1 Procedurfor detection & Predictable ucion response to production resources( ,
Qa it dentifying and predictable Delay Operating
resolving output Reduction costs problerms
The Production System Design and Deployment Steps
Chapter 2: The Production System Design and
Deployment Steps
Manufacturing systems can be extremely complex and their design involves many different disciplines such as product development, process design, accounting, scheduling, information systems, equipment design, etc. Complexity makes it difficult to identify a logical path to follow when thinking about the features of a system. Shingo has shown that even proven tools and solutions used by Toyota will fail if the necessary infrastructure is not in place [Shingo,
1981]. The MSDD in itself is a great tool to understand the characteristics that must be present in
a manufacturing system and the means to achieve each specific objective, but it does not provide a methodology for structuring the design of those features. Monden on the other hand, developed a guide for the design of a manufacturing system as a set of activities that must be implemented in a particular order. However, his approach does not distinguish objectives and means, which makes his approach difficult to use [Monden, 1998]. Figure 2-1 shows the relationship between these elements.
Increaue ofProfit increase unde so going economy
Co s-treduction by eliminating waste C-Ompany-wide QC 1 4 __
Respect for LInvento cutting Work force cutting
humanityProduction quality control
t adaptable to demand changes
Increas of
[workers' moaW;us-i-ime production]
A k I Flexible work force
QualityKanban system
assuranceItCags
+
F Production smoothin ChandasdAutonomation toperation
Reuction of lead tim routine
Functional
managements Small lot Single-piece
producin utn production underbalanced line
S et -t m e M c h in e M u lti-fu n c tio n a l r r
redutiont w re
Improvement activities by small group
Monden, 1998
n
Application of the Production System Design Framework in the Automotive Industry
The Production System Design and Deployment Framework, which is based on the
MSDD, was developed by the Production System Design Laboratory at MIT to provide a
methodology to translate the objectives derived from the MSDD into a comprehensive design and implementation process [Cochran, 1999]. In particular it presents the sequence of twelve design steps shown in Table 2-1. This work studies the twelve design steps as a production system design guideline. The following sections describe each step in more detail. The role and importance of each step is discussed as well as issues related to their application.
Table 2-1: The twelve steps of Production System Design [Cochran, 1999
Step 1. Create a common mental model of the Manufacturing System Design objectives and means
Step 2. Develop the Manufacturing System Design Decomposition and align Performance Measures with the FR's
Step 3. Identify the final (external) customer and create a customer-focused capacity planning process (that enables capacity to be put in place according to a Value
Stream and not operations)
Step 4. Define customer Takt time (subject to < 30 seconds)
Step 5. Define the linked-cell system flow Step 6. Form cells based on takt time Step 7. Reduce setup time in final assembly Step 8. Level final assembly - reduce the run size
Step 9. Operate the linked system with leveling and pacing (Initially with large SWIP 'Standard Work in Process' between cells)
Step 10. Systematically reduce SWIP between cells to reduce variation - improve reliability of machines, operator's work, improve capability of machines & mistake-proof processes.
Step 11. Link Suppliers
The Production System Design and Deployment Steps
2.1 Step 1: Create a common mental model of the Manufacturing
System Design objectives and means
It may seem that this step has no direct influence in the physical design of the system as it relates to the mental state of the people involved with the system. It is a reminder that production systems are composed not only of the physical hardware but also include the people involved with it. Although the equipment usually performs most of the material transformation, people are invariably controlling its design and functions. For this reason, it is essential that people at all levels of the organization, from management to direct labor, be aware of the production system's objectives.
2.2 Step 2: Develop the Manufacturing System Design
Decomposition and align Performance Measures with the FR's
The performance measurement system of a company is often overlooked when the production system is designed. Proof of this is that many businesses are still measured using the same accounting systems that were developed at the beginning of the century. The conditions at the time where much different form what it is seen today. Nowadays firms experience different energy costs, wages have changed and even environmental restrictions now play an important role.
A company's performance measurement system drives its behavior and thus, affects its
ability to achieve its strategic objectives. The role of performance criteria is twofold. First, it provides the firm with a method to compare its position with respect to its competitors and the market, and to identify possible opportunities for improvement. Second, it serves as a monitor to assess whether or not the firm is marching in the right direction towards the achievement of its strategic goals [Wisner and Fawcett, 1991]. In a complex organization it is difficult to effectively communicate the high-level goals of the company to the players at the lower levels. Without an aligned performance measurement system, the employees are driven to behave in a dysfunctional manner in an attempt to improve indicators that do not reflect the company's objectives.
An example of the misalignment of objectives and measures is evident in the traditional manufacturing cost accounting system. In particular, the way that the production unit cost is calculated often leads to misleading information, which in turn serves as the basis for making
Application of the Production System Design Framework in the Automotive Industry
important business and operational decisions. Let us consider the manner in which unit cost is calculated:
UnitCost = (DirectLabor + Material + OverheadAllocation) (4)
UnitsProduced
where,
OverheadAllocation = (DirectLabor / TotalPlantDirectLabor) * TotalOverhead (5)
The calculation of unit costs using Equation (1) and Equation (2) places a very heavy weight on the direct labor associated with the production of the part. Furthermore, the allocation of overhead costs based on the portion of direct labor needed to manufacture the part motivates the reduction and ultimately the elimination of direct labor in all processes. This approach results in the selection of highly automated equipment that is more expensive and complex. As a result, these types of machines require more resources to maintain. Additionally, the cost of the equipment stimulates the use of machine utilization as an important performance measure often times at the expense of overproduction. It can be seen that in an environment like this, there is a discontinuity between the enterprise objectives and the performance measurement system and as a result, the measurements drive the objectives in the manufacturing system [Cochran, Kim and Kim, 2000]. Figure 2-2 illustrates how this gap has an effect on the design of the manufacturing system.
Mfg. System Iesign
Dec ompositin
Externalfactors Enterprise internal
Stockholder strategy factors PMs dictate
expectations
Gap
the FRsLittle or no
mfg strategy
Production System Design Manufacturing System
Cochran, Kim and Kim, 2000
The Production System Design and Deployment Steps
The Manufacturing System Design Decomposition (MSDD) identifies the functional requirements throughout all aspects of the manufacturing system and the means to achieve them. For each of these requirements it presents a corresponding performance measure. This method of developing the measurement system ensures that the behavior of the manufacturing system is in line with the high level objectives of the organization. In this way, employees have the right information regarding what actions improve the state of the system relative to the company's strategy. The diagram in Figure 2-3 illustrates the process in which the performance measures must be derived.
Mfg. System Design
External h Internal Decomposition
Fac ors enterprise Fr
- Market
Eronental Enterprise
Mfg.
issues -d-- sign . ..
.Stockholder Strategy -Human Strategy
expectations relationship . Available
technology
Pm derived
Production System Design
Manufacturing System
Cochran, Kim and Kim, 2000
Figure 2-3: Performance Measures to Achieve the Goals of the Manufacturing System Design and Production System Design
The complete version of the MSDD along with the performance measures associated with each FR-DP pair can be found in Appendix A.
2.3 Step 3: Identify the final (external) customer and create a
customer-focused capacity planning process (that enables
capacity to be put in place according to a Value Stream and not
operations)
The MSDD has as its primary objective to maximize the long term Return on Investment (ROI). There are three ways to achieve this goal that derive directly from the formula to calculate
Application of the Production System Design Framework in the Automotive Industry
ROI (See Equation 3): Maximize sales, minimize costs and minimize initial investment. This step is concerned with the maximization of sales. To achieve these goals we must pay attention to the customer. There are several factors that increase sales through attracting new customers but most of the techniques fall outside of the scope of production system design. Nevertheless, the production system plays a key role in retaining existing customers through high quality, reduced lead times and low cost. In order to achieve these goals, the main element is to understand who the customer is. It might be a single customer or a group of customers depending on the characteristics of the product and the volume demanded.
Ideally, each customer would have a dedicated value stream. This approach would enable the management to focus on the product rather than focusing on functions or departments. In this way, the system becomes more responsive and problems are more easily traced to their root cause. It is often the case that a few products are only minimally different from each other. Such a group of products belongs to a product family that share many components and differ only on small variations. In this case, the similarities call for a product family to be grouped into a single value stream to avoid infeasible investments and to capture any economies of scale. The calculation of takt time (See step 4) for a product family involves the aggregate demand for all product variations.
Once the customer is identified, the capacity of the system must be decided. At this stage, only the long-term capacity strategy is considered, the next step explains in more detail how to cope with temporary demand fluctuations. The problem of capacity planning resides in the forecast of the demand that the system will experience when it is finally installed. The problem is magnified as the production system design lead-time increases [Charles, Cochran and Dobbs,
1999]. Figure 2-4 shows the uncertainty in the demand forecast and the probable distribution of
The Production System Design and Deployment Steps
Forecat
* Actual? Actual?
Demand
Charles, Cochran and Dobbs, 1999
Figure 2-4: Uncertainty in demand forecasts
Another decision that must be made at this stage that is closely linked with the capacity problem is capacity increment to implement. The size of the capacity increments that can be achieved by different types of production systems plays an important role in this decision. For example, a high-speed transfer line might be a good candidate for a particular process but only if the demand is known with great certainty. Transfer lines are very efficient but lack volume flexibility. Furthermore, capacity can only be added in large increments (i.e. another transfer line) and it takes a long time to implement. On the other hand, manufacturing and assembly cells easily adapt to temporary demand fluctuations. Additionally, a cell usually has a small capacity and the lead-time to implementation is short. Figure 2-5 shows the capacity planning capabilities of the two manufacturing systems.
Application of the Production System Design Framework in the Automotive Industry
Transfer Line
Cell
Volume Volume A Capacity 2.4 M - pct2.4 M Capacity 1.8 M Demand .8MDemand 1.2 M -- 1.2 M 0.6 M Time Time Excess Capacity
Figure 2-5: Capacity implementations over time
2.4 Step 4: Define customer Takt time (subject to > 30 seconds)
One of the most important aspects of manufacturing system design is defining the takt time and using it effectively. The term "takt time" comes from the German word "takt," which refers to the rhythm and time bar in a piece of music. In the context of manufacturing it is used to refer to the pace of customer demand, at which products are manufactured. Takt time is a concept that relates the customer demand to the available time to produce the required goods. As such, takt time is an essential tool to pace the production and has a strong influence in the design of the manufacturing system. It affects many aspects of the system like the general layout, machine design (cycle times), work loops and even the size of containers to transport the materials. The role that takt time plays in the design of these elements will be further explored in the subsequent steps.
Takt time is a representation of the average quantity demanded by the customer in a given period of time. It also defines the time available to produce one part [Shingo, 1981]. It can be defined as the overall available production time in a chosen time interval divided by the overall forecasted customer demand for the time interval [Linck, Cochran, 1999]. Takt time can be calculated according to the following formula:
TimeAvailable
The Production System Design and Deployment Steps
where,
TimeAvailable = TotalTime - (MaintenanceTime + TimeAllowances) (7)
The Total Time represents the complete working time that has been scheduled for production in a given period (i.e. one day, one week, etc.). The Time Available is the Total Time less breaks and scheduled allowances for that period. It can also include a factor for changeover and downtimes. To determine the Average Customer Demand per Period the customer for the system must be defined as was described in step 3.
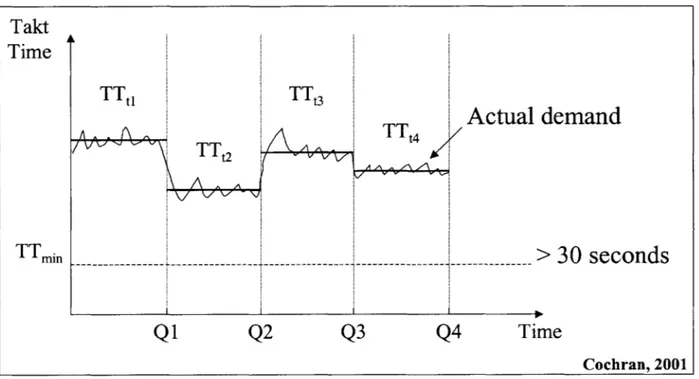
Note that the calculation of takt time involves the AverageCustomerDemandperPeriod but the actual demand will probably vary with time in some type of normal distribution. The actual takt time also follows these variations and must be calculated for every period. Figure 2-6 illustrates this concept. In order to accommodate for these variations, the cell and in particular the equipment, must be designed to handle a range of takt time. Figure 2-7 shows how the distribution in demand affects the takt time. This idea is described in more detail in Step 6.
TT TT3 TT2
Q1
Q2
TTt4Q3
/Q4
Actual demand
>
30
seconds
Time Cochran, 2001Figure 2-6: Takt times determined by the average demand for each period
Takt
Time
TTmin
Application of the Production System Design Framework in the Automotive Industry
Forecast Demand Distribution Cell Capacity Range
Max
Capacity
Avg. Demand Quantity -30% Avg. +30% Takt time
Demand
Adapted from Cochran and Milby, 1998
Figure 2-7: Demand distribution and resulting cell capacity range
Since the takt time will pace production, every subunit, workers included, must complete its operations performed on the parts in that time. Therefore, a takt time faster than 30 seconds will lead to high-speed, specialized equipment and will bind workers to one machine. It will be seen in the discussion of the next steps that volume-flexible cells require workers to operate more than one station, therefore it is recommended that the takt time be greater than 30 seconds.
2.5 Step 5: Define the linked-cell system flow
In order to maintain a holistic view of the system, it is necessary to create a value stream map. Once the objectives for the manufacturing system have been understood, and the customer and demand have been identified, it is possible to define the value stream flow of the manufacturing system. The production flow is composed of two equally important elements, the physical material flow and the information flow. It is easy to understand why it is important to define a particular path for the material to flow. But the information flow must be treated in the same way. The system elements must have the relevant production information at all times. In particular, knowledge concerning the demand volume and mix as well as timing is required at each step of the flow.
Value stream mapping is a tool that has proven to be effective in capturing the most
The Production System Design and Deployment Steps
and Shook, 1999]. The flow of the entire manufacturing system is identified and is usually represented graphically. The value stream comprises all the activities that are required to bring a product to the customer. The activities include those that add value to the product and also those that do not add value whether they are necessary or not (waste). Figure 2-8 illustrates the basic symbols of value stream mapping.
Mapping the flow in this manner enables the designers to maintain a broad perspective of the system. Additionally, a value stream map facilitates the visualization and eventual elimination of the seven types of waste identified by Ohno: overproduction, inventory, unnecessary production steps, unnecessary transportation, waiting, unnecessary motion and making defective parts that require rework. [Ohno, 1978].
MATERIAL FLOW ICONS
PROCESS Manufacturing Process Finished Goods to Customer INFORMATION Manual Information Flow . ... Withdrawal Kanban Outside Sources PUSH Arrow FLOW ICONS Electronic Information Flow . ... Production Kanban Inventory Supermarket Signal Kanban 15 min. oxox Load Leveling Truck Shipments 0 Withdrawal CI/T = < 6 5 St C uYtna Bo x% Data Box -F IF 0 -> First-In-First-Out Sequence Flow
Application of the Production System Design Framework in the Automotive Industry
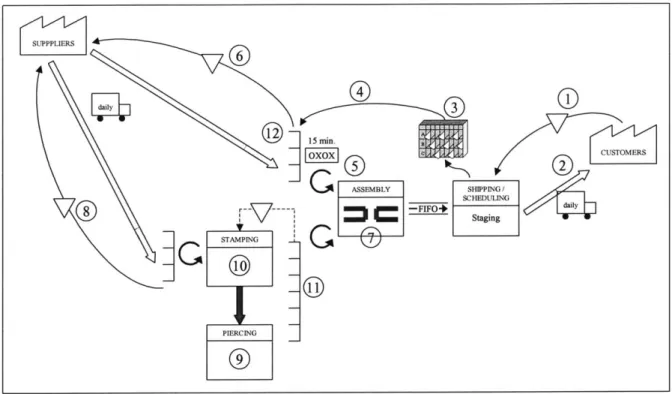
The value stream for a product can include all the steps from extraction of the raw materials to the distribution channels to the final retail sale point. Some cases might call for such an extensive mapping, but in this case the interest is focused on what happens within the limits of the manufacturing system in question. At this stage, the map should be simple and limited to a level of detail that is in line with the overall system. At this stage, there is not enough information yet to define finer elements like the size of the intermediate buffers or Standard Work In Process (SWIP) between operations, although their location in the system flow should be designated at this point. Figure 2-9 illustrates an example of a value stream map that represents the future state of a manufacturing system.
Due to the importance of information in the manufacturing system, it is important to consider the manner in which it will be distributed. There are two main designs that lead to either a push or pull system. In a push system, a central production-planning department creates an independent schedule for each of the processes based on actual demand but without considering the state of the system. Each operation is responsible for fulfilling the schedule requirements and supplying the products to the subsequent operation. Under this system, the central planning unit must process any unexpected changes in demand volumes and a new schedule must be issued. This process is usually long and requires large variable buffers between processes. As a result, production lead times and throughput times are unnecessarily long.
The pull system, pioneered by Toyota in Japan, uses a single production schedule that is issued to the final operation (usually final assembly). This operation withdraws the required materials from the preceding processes to complete the schedule. As a result, the upstream operations produce only what has been withdrawn. In this way, the entire manufacturing system is controlled with a single schedule and production is strictly limited to what is needed. Inventories between processes are kept to a minimum and most importantly are standardized. The simpler pull system generally has a shorter lead-time and throughput time; moreover it has the added benefit of predictability due to standardization. There are several methods to implement a pull system: Kanban, CONWIP, etc. Step 9 includes a detailed explanation of these techniques.
The Production System Design and Deployment Steps
o0
ASSEMBLY SHIPPING / SCHEDULING 8[ -FIFO- Staging STAMPING PIERCING Mierzejewska, 2000Figure 2-9: Value stream map example
2.6 Step 6: Form cells based on takt time
2.6.1 Forming Cells (cells vs. Other)
This step is concerned with the details within each of the manufacturing subunits defined in the system value stream. The specifics concerning the individual stations or processes are defined. But before this is done, a decision must me made regarding the type of manufacturing units that will be implemented. There are a few different widely used subsystem types; each one has its advantages and inconveniences that will be explained below. These systems are presented for reference only, and not as a list that defines the only possible choices from which the designer must pick one. The manufacturing subunits that will compose the overall manufacturing system must be designed with specific requirements in mind. It is not likely that these requirements will be fully satisfied by any one particular system type. The best solution will most likely be a hybrid containing elements of several different system types as well as some original elements.
Application of the Production System Design Framework in the Automotive Industry
Charles, Cochran and Dobbs describe each type of manufacturing system and categorize them according to the production environment in which they are more efficient. Table 2-2 shows
this classification [Charles, Cochran and Dobbs, 1999].
Table 2-2: Characteristics of manufacturing systems
Volume Product Product
Certainty Mix Life
Automated
Auom .eHigh Low Long
Transfer Line
Job Shop Low High Short
FMS Medium High Short
Agile Cellular Medium Medium Medium
Lean Cellular Low Medium Medium
Automated Transfer Lines
Manufacturing systems using dedicated automation use machines that were specially designed with a particular model of a product in mind. Dedicated automation is most effective for products that have a constant demand. This is because the majority of costs associated with these systems are fixed. Examples of dedicated automation include traditional American automobile engine production lines and automotive component assembly lines.
Advantages:
* High volume capacity.
* Cost effective for products with long life cycles.
* Most profitable at the production level for which they were designed.
Disadvantages:
" Expensive due to the engineering and custom development required.
* Low product mix flexibility: generally support very few different products or models. * Low volume flexibility: relative high cost to retool.
* Production cost highly sensitive to variations in demand.
Job Shop
A Job Shop style manufacturing system uses standard flexible machines that are not
oriented or configured for any particular product. Instead, products flow from machine to machine in which ever order is necessary. Parts are not automatically transferred from one
The Production System Design and Deployment Steps
machine to another. Job Shops generally produce in batches. For instance, a batch of 100 parts of a particular type is processed at one machine and then the batch is transported to the next machine.
Advantages:
* Highly flexible. Able to produce a large product variety even in low volume products.
Disadvantages:
* Long changeover times.
" Complex scheduling.
Flexible Manufacturing System
A Flexible Manufacturing System (FMS) is essentially an automated Job Shop [Black, 1991]. The machines are organized in a similar way and support a wide variety of products.
Generally, material transport between machines is automated with robots or Automated Guided Vehicles (AGVs).
Advantages:
* Supports a high product variety. * Automatic changeovers.
* Better handling of delicate parts.
Disadvantages:
* Large initial investment. * Difficult to change over. * Difficult to identify problems.
Agile Cell
Agile Cells consist of clusters of modular machines which function in a similar manner to an FMS. Agile cells conform to the RRS Design Principles: Reusable, Re-configurable, and Scalable [Dove, 1995]. The modular machines are built around a common architecture. To date, Agile Cells have been utilized primarily in electronics fabrication where high equipment cost, short product life cycles, and delicate part handling are necessary.
Advantages: