Publisher’s version / Version de l'éditeur:
Vous avez des questions? Nous pouvons vous aider. Pour communiquer directement avec un auteur, consultez la première page de la revue dans laquelle son article a été publié afin de trouver ses coordonnées. Si vous n’arrivez pas à les repérer, communiquez avec nous à [email protected].
Questions? Contact the NRC Publications Archive team at
[email protected]. If you wish to email the authors directly, please see the first page of the publication for their contact information.
https://publications-cnrc.canada.ca/fra/droits
L’accès à ce site Web et l’utilisation de son contenu sont assujettis aux conditions présentées dans le site LISEZ CES CONDITIONS ATTENTIVEMENT AVANT D’UTILISER CE SITE WEB.
Combustion Institute Canadian Section, 2008 Spring Technical Meeting
[Proceedings], 2008
READ THESE TERMS AND CONDITIONS CAREFULLY BEFORE USING THIS WEBSITE.
https://nrc-publications.canada.ca/eng/copyright
NRC Publications Archive Record / Notice des Archives des publications du CNRC :
https://nrc-publications.canada.ca/eng/view/object/?id=c0cc67f1-42cb-49b5-a1ad-e9b60d0bb9ee
https://publications-cnrc.canada.ca/fra/voir/objet/?id=c0cc67f1-42cb-49b5-a1ad-e9b60d0bb9ee
NRC Publications Archive
Archives des publications du CNRC
This publication could be one of several versions: author’s original, accepted manuscript or the publisher’s version. / La version de cette publication peut être l’une des suivantes : la version prépublication de l’auteur, la version acceptée du manuscrit ou la version de l’éditeur.
Access and use of this website and the material on it are subject to the Terms and Conditions set forth at
Soot surface growth obliteration and fragmentation modelling in a
laminar ethylene diffusion flame
Choi, B.; Zhang, Q.; Guo, H.; Liu, Fengshan; Smallwood, Gregory;
Thomson, M.
Soot surface growth obliteration and fragmentation modelling in a
laminar ethylene diffusion flame
B.Y. Choi, Q. Zhang, H. Guo, F.Liu, G.J. Smallwood, and M.J. Thomson* *Corresponding author:
Department of Mechanical and Industrial Engineering 5 King’s College Road
Toronto, ON, M5S 3G8
1 Introduction
There are several broad classes of aerosol dynamics models used in the treatment of soot. Among the most popular, especially for turbulent codes, are moment methods, which are fairly accurate and are among the most computationally economical [1,2]. Their efficiency is due to the necessity of calculating only the first few moments of the particle size distribution. Knowledge of the exact PSD, however, is tantamount to the knowledge of all of the moments of which there is an infinite number. Thus, the price of efficiency is the inability of moment methods to uniquely reconstruct the PSD.
In contrast, sectional methods can provide insight into the particle size distributions in the flame but are more computationally expensive. The aggregate population is divided into size-bins that are typically geometrically spaced due to the broad range of aggregate sizes in sooting flames [3-6]. In the case of fully coalesced particles, only one variable per section, such as the number density of aggregates, is required [4]. A description of the aggregate’s fractal structure, however, requires at least one other variable such as the number of particles [3,5]. An even more sophisticated treatment of structure is given by two-dimensional sectional models, where each aggregate section is further divided into sub-sections for particles of different volumes [6], each of which adds a variable to the system.
Increasingly comprehensive soot morphology data has allowed for validation of advanced soot models. The present work models the atmospheric pressure, laminar, co-flow, ethylene-air flame of Santoro et al. [7,8], of which measurements were taken by numerous other researchers. Much of the soot data was measured along the path of maximum soot as is the case for particle diameters and number densities [9], aggregate number density, and the number of particles per aggregate [10]. Recently, Iyer et al. offered additional data on the number of particles per aggregate [11]. Given the above data, the present work studies the effect of implementing a relatively new surface growth model from aerosol dynamics literature on soot morphology. In addition, a new fragmentation model will be presented and its effect will also be examined.
2 Model Description 2.1 Overall flame model
The burner consists of concentric fuel and air tubes with outer diameters of 11.1 mm and 102 mm, and mean flow velocities of 3.98 cm/s and 8.9 cm/s, respectively. Further details regarding the experimental setup can be found in [7-11]. The cylindrical conservation equations for mass, momentum, energy, and species are given in [12] and the two soot transport equations for each section are given in [13]. Flame chemistry was governed by the mechanism of Appel et al. [14]. Details regarding the nucleation, coagulation, surface growth, oxidation, and radiation heat transfer models, and the numerical details such as boundary conditions, mesh geometry, and parallelization scheme can be found in [13]. Note that the spacing factor, the ratio of an aggregate’s mass to that in the preceding section, is 2.7 in the present work, which is different from that which was used in the work of Q. Zhang et al.
2.2 Sectional model
In this model, the number density of aggregates Nj and particles Np,j are variables to be solved for each section along with the other flame variables. It is assumed that each aggregate within a section has the same number of particles
np each of which are equal in diameter, have a uniform density of 1.8 g/cm3, and are connected by point contact.
These assumptions allow for the calculation of the surface area of the aggregates and the radius of the particles using
Nj and Np,j.
The fractal dimension is an important parameter in this model and its value was obtained by Yazicioglu et al. using light-scattering experiments [15] and by Köylü et al., who analyzed TEM images from thermophoretic samples [16]. The fractal dimension given by the latter (1.8) was used and is assumed to be constant, Df. While it
has been shown in mathematical models that the fractal number increases due to surface growth [17], the obliteration model in this paper is intended to account for the increasing compactness of the aggregate.
2.3 Obliteration model
Growth of particles occurs on their surfaces, which causes a gradual merging of the particles that been observed in the electron micrographs of [18] and [9]. If this is not accounted for and it is assumed that point contact between particles persists amidst surface growth, the surface area of aggregates will be over-predicted, which in turn will lead to over-predictions of the surface growth rate constituting a positive feedback. S. H. Park et al. sought to account for this effect in a model they referred to as ‘condensational obliteration’: the obliteration of particles due to surface condensation. A summary of the model will be presented below, while its details can be found in [19].
Assuming spherical particles, the volume and surface area are given by
3
3
4
p pr
n
v
=
π
, (1) 24
n
pr
pa
=
π
, (2)respectively. Eliminating the particle radius rp gives:
(
2)
1336
v
n
pa
=
π
. (3)In other words, for an aggregate of a particular volume, its surface area is based on the number of particles in the aggregate. Under surface growth without an obliteration model, np remains constant, which leads to an
over-prediction of surface area. The obliteration model seeks to remedy this by decreasing np as surface growth occurs.
Thus, in a sense, np is defined by (3) and cannot be intuitively observed in an electron micrograph. Likewise, rp is
defined as 3v/a rather than some readily observable radius.
A relationship between the outer radius Rf, the fractal dimension and the particle radius is given by [20]
f D p f p
r
R
n =
. (4)The thickness of an infinitesimal layer deposited on an aggregate’s surface is equal to the change in the outer radius
dRf. The volume of the layer is therefore dv = a dRf or
dt
dR
a
dt
dv
a
dv
dR
f f=
⇔
=
1
. (5)After eliminating rp from (4) using (1), differentiating the result with respect to v, substituting (5) in, and applying
the chain rule, an expression for the obliteration rate of primary particles due to surface growth can be obtained:
(
)
dt
dv
R
r
r
n
R
D
D
dt
dn
f p D p p D f f f p f f−
−
=
−1
3
4
3
3 3 3π
. (6)As soot aggregates are oxidized, it has been observed that particle diameters1 decrease while the surface area increases [21]. This suggests that a phenomenon opposite of obliteration exists in the oxidation region where surface loss increases the exposed surface area. In addition, nitrogen adsorption measurements suggest that oxidizers induce porosity in the outer layer of soot aggregates dramatically increasing their effective surface area [21-23].
While the porous effect is difficult to quantify, equation (6) is suitable for simulating the aforementioned reversal of obliteration, referred to here as oxidative incipience. As mass is removed from the surface of the aggregates, weak links between particles are exposed. This leads to the topic of the next section.
2.4 Fragmentation model
The aggregate fragmentation rate is dependent on a number of factors including the shear rate, oxidation rate, bond strength, and the size of the aggregate. While the effects of many of those parameters are difficult to quantify, an expression for the fragmentation rate that is based on the oxidation rate can be developed with a relatively small number of assumptions:
1
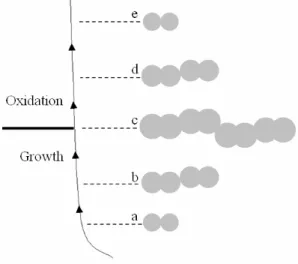
• Upon coagulation, the colliding aggregates are in point contact. Surface growth then forms a necked connection between the two and strengthens it.
• Fragmentation occurs when the neck between two portions of an aggregate is reduced to point contact. • Upon fragmentation, the aggregate splits into two equal halves.
• Both growth and oxidation occur uniformly over the surface area of the aggregate and therefore oxidation can reverse growth.
Figure 1. Fragmentation model.
The first two assumptions are illustrated in Figure 1. At point ‘a’, an aggregate collides with another. Surface growth strengthens the neck and, at point ‘b’, the resulting aggregate makes another collision. This pattern of coagulation and growth repeats until point ‘c’ is reached, where we enter into the oxidation region.
Because surface growth immediately forms and strengthens a neck between two colliding aggregates, the above assumptions imply that fragmentation does not occur in the growth region. Likewise, any connection formed between two colliding aggregates in the oxidation region is doomed to be ephemeral, since no neck is formed between them. This implies that there is no coagulation in the oxidation region. Under these assumptions, the first neck to reach point contact due to oxidation would be the one that was most recently formed through coagulation in the growth region, and the next one would be the one that was second most recently formed. Thus, the oxidation-fragmentation processes are viewed as a chronological reversal of the coagulation-growth processes. At point ‘d’, an aggregate identical to the one formed at point ‘b’ is fragmented and at point ‘e’, the aggregate formed at point ‘a’ is fragmented. Note that the assumption that aggregates fragment into two equal parts, though not necessarily the reality, is an approximation. Other fragmentation schemes will be attempted in the future.
The above analysis suggests that the fragmentation rate can be obtained using a Lagrangian approach where an aggregate’s history is reconstructed from its pathline, which, unfortunately, would be extremely computationally expensive. The approach in the current work utilizes the particle size distribution to infer the history of the aggregate population, yielding an expression for the fragmentation rate that requires only data from the aggregate’s current spatial position.
Let the absence of a superscript denote present values while the superscript ‘0’ denotes the point in the aggregate’s history where the last fragmentation occurred. The subscript M denotes the pre-fragmented aggregate at time ‘0’ as well as other aggregates in the same section that did not fragment. The subscript L denotes the fragmented halves of M. Then the following must be true of the properties of M and L at time ‘0’:
0 0
2
L Mn
n
=
, (7) 0 02
L Mv
v
=
. (8)These past values can then be related to present values:
=
−
τ 0 0dt
dt
dn
n
n
L L L , (9)=
−
τ 0 0dt
dt
dn
n
n
M M M , (10)=
−
τ 0 0dt
dt
dv
v
v
L L L , (11)=
−
τ 0 0dt
dt
dv
v
v
M M M . (12)where is the length of time between time ‘0’ and the present. The integrals can be approximated using the integrand multiplied by . Equations (7) to (12) can then be used to eliminate the time ‘0’ values. From equations (7), (9) and (10), we obtain M L M L
n
n
dt
dn
dt
dn
−
−
=
2
2
1
τ
, (13)and from equations (8), (11) and (12), we obtain
τ
−
+
=
dt
dv
dt
dv
v
v
L M M L2
1
2
1
. (14)The number was defined as the time between the present and the most recent fragmentation event, and the calculated at that event determines the next most recent fragmentation, and so on. The number therefore represents the length of time between fragmentations, and its inverse gives the fragmentation frequency per aggregate. The fragmentation rate for the entire section is therefore
L M L M M M Frag M
n
n
dt
dn
dt
dn
N
N
dt
dN
2
2
−
−
−
=
−
=
τ
. (15)The negative sign indicates that aggregates are being removed from section M. Several quantities in (15) are required. Equations (1), (2), (4) and (5) are used to find an alternate expression for the rate of change of particles per aggregate:
(
)
dt
dv
n
v
n
D
D
dt
dn
D LM M L M L M L f f M L 1 f , , , , ,1
3
−
−
=
− . (16, 17)Here the subscripts indicate that the equation is applicable to both L and M. From (1), (2), and (5), the rates of volume change in (14) and (16, 17) can be expressed as
(
)
dt
dR
v
n
dt
dv
f M L M L M L 2 13 , , ,36
π
=
. (18, 19)Note that the rate of change of the outer radius dRf/dt is the same for both L and M. Though this may not be the case
for OH reactions that are modelled with collision kernels, it is a reasonable approximation. Lastly, nL is found with
(
)
(
)
K L K K K K K L K L K Lv
v
v
v
v
n
v
v
n
v
v
n
<
<
−
−
+
−
=
− − − − 1 1 1 1where
. (20)
To summarize, the nonlinear fragmentation rate expression requires the following iterative method: 1. Set = 0. 2. Determine vL from (14). 3. Determine nL from (20). 4. Determine dvL/dt from (18). 5. Determine dnL/dt from (16). 6. Determine from (13).
However, the implementation of this iterative method can be avoided by assuming that vL = vM/2. It turns out
that this approximation yields a fragmentation rate that is very close to the iterative method. Substituting equations (1), (16) and (18) into (13) gives
(
)
(
)
(
)
−
−
−
−
−
=
− − M L D M M D L L f M f fn
n
n
n
n
n
dt
dR
v
D
D
f f2
1
1
2
36
3
1
π
13 43 1 43 1τ
. (21)Note that as 2nL approaches nM, expression (21) becomes unbounded. The Riemann sum approximations of the
integrals are not accurate enough to resolve this limit. To rectify this, notice that two of the terms in the numerator of (21) can be ignored for large values of nL and nM:
(
)
−
−
−
−
≈
M L M L f M f fn
n
n
n
dt
dR
v
D
D
2
2
36
3
1
π
13 43 43τ
. (23)Using l'Hôpital's Rule, the limit of (23) as 2nL approaches nM is
−
−
≈
13 3 13
4
36
3
1
M f M f fn
dt
dR
v
D
D
π
τ
. (23)Thus, whenever (21) yielded an unphysical fragmentation rate, (23) was used instead.
Lastly, simple expressions involving (15) can be developed to determine the rate in which particles are removed from section M and the rates in which particles and aggregates are added into the lower sections K and K – 1 (where
vK – 1 < vL < vK) can be calculated.
3 Results
The flame of Santoro et al. was modeled and the results were compared with both the experimental data from the sources cited in Section 1, and with the non-obliteration model of Zhang et al.
Examination of Figure 2 reveals that the temperatures from the obliteration-fragmentation model were generally higher than those of Zhang et al [13] (not shown here). This difference was apparent in the centerline at heights of 5.0 cm and 7.0 cm, with the obliteration model yielding temperatures that are about 60 K higher in that region. Also, the soot volume fraction predicted by the present model is lower than that of the Zhang et al. Both of these results can be explained by the positive feedback effect alluded to in Section 2.3. The lower surface growth rate in the obliteration case led to a lower soot volume fraction, which in turn resulted in greater radiation heat loss and thus lower temperatures.
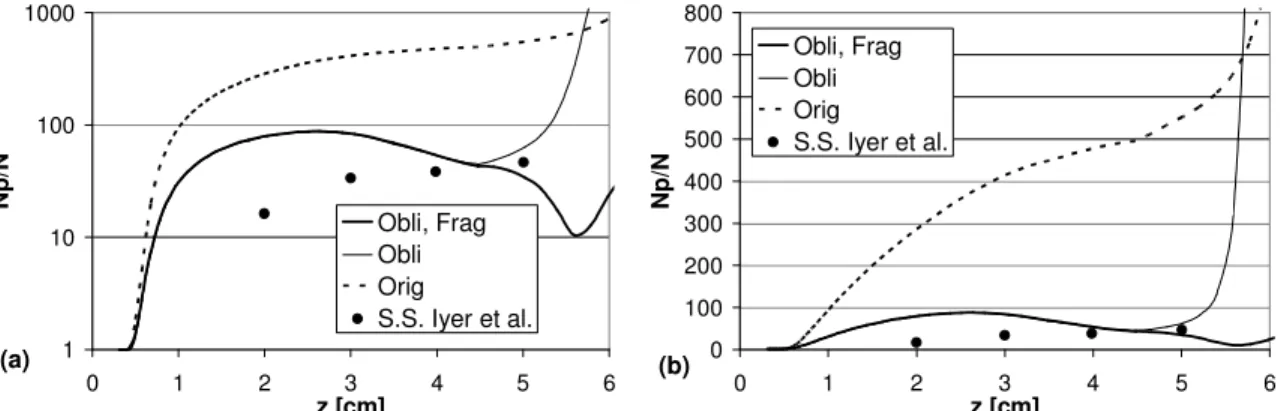
While the predictions for temperature and soot volume fraction are not quite as accurate as that of the non-obliteration model, it is clear from Figure 3 that soot morphology predictions are greatly enhanced by the these models. Because particles are assumed to remain spherical and in point contact during surface growth in the non-obliteration model model, the number of primary particles per aggregate is over-predicted by orders of magnitude, where as the obliteration-fragmentation model provides more reasonable results.
0 500 1000 1500 2000 2500 0.0 0.2 0.4 0.6 0.8 1.0 r [cm] T [ K ] z = 2.0 z = 5.0 z = 7.0 (a) 0 1 2 3 4 5 6 7 8 9 0.0 0.2 0.4 0.6 0.8 1.0 r [cm] v o l. f ra c . [p p m ] z = 1.5 obli z = 5.0 obli z = 1.5 orig z = 5.0 orig (b)
Figure 2. Temperature (a) and soot volume fraction (b) vs. r for different flame heights.
Also, the effects of unchecked coagulation are apparent in Figure 3(b). In both the non-obliteration model, which also does not have a fragmentation model, and the new model with fragmentation turned off, the number of primary particles per aggregate climbs significantly once in the oxidation region (z > 4.5 cm). This is especially true
of the case where obliteration was turned on but fragmentation was not. The sharp increase in particles and the quick disappearance of aggregates from surface loss caused an almost asymptotic climb in the number of particles per aggregate. The fragmentation model, however is able to bring the curve back down to reasonable values.
1 10 100 1000 0 1 2 3 4 5 6 z [cm] N p /N Obli, Frag Obli Orig S.S. Iyer et al. (a) 0 100 200 300 400 500 600 700 800 0 1 2 3 4 5 6 z [cm] N p /N Obli, Frag Obli Orig S.S. Iyer et al. (b)
Figure 3. Number of particles per aggregate vs. y along path of maximum soot: (a) log scale, (b) linear scale. 4 Conclusion
While the temperature field and soot volume fraction of the new model did not match with experiment as well as the non-obliteration model, it is clear that the present work has significant advantages in terms of soot morphology. Though there are very few uncertain parameters used in the code, the PAH condensation coefficient is certainly a contentious one. Adjusting its value may lead to improvements in accuracy and will be one of the focuses of this continuing project.
5 References
[1] M. Frenklach. Journal of Colloid and Interface Science. 108 (1985) 237-242.
[2] M. Frenklach, S.J. Harris. Journal of Colloid and Interface Science. 118 (1987) 252-261.
[3] J.Z. Wen, M.J. Thomson, M.F. Lightstone, S.H. Park, S.N. Rogak. Combustion Science and Technology. 178 (2006) 921-951.
[4] A. D'Anna, J.H. Kent. Combustion and Flame. 152 (2008) 573-587.
[5] S.H. Park, S.N. Rogak, W.K. Bushe, J.Z. Wen, M.J. Thomson. Combustion Theory and Modelling. 9 (2005) 499-513.
[6] M.C. Heine, S.E. Pratsinis. Journal of Aerosol Science. 38 (2007) 17-38.
[7] R.J. Santoro, H.G. Semerjian, R.A. Dobbins. Combustion and Flame. 51 (1983) 203-218.
[8] R.J. Santoro, T.T. Yeh, J.J. Horvath, H.G. Semerjian. Combustion Science and Technology. 53 (1987) 89. [9] C.M. Megaridis, R.A. Dobbins. Combustion Sci.Technol. 66 (1989) 1-16.
[10] R. Puri, T.F. Richardson, R.J. Santoro, R.A. Dobbins. Combustion and Flame. 92 (1993) 320-333. [11] S.S. Iyer, T.A. Litzinger, S.-. Lee, R.J. Santoro. Combustion and Flame. 149 (2007) 206-216. [12] H. Guo, F. Liu, G.J. Smallwood, O.L. lder. Combustion and Flame. 145 (2006) 324-338.
[13] Q. Zhang. "Modeling of soot aggregate formation and size distribution in a laminar ethylene/air coflow diffusion flame with detailed PAH chemistry and an advanced sectional aerosol dynamics model" submitted to Proceedings of the Combustion Institute.
[14] J. Appel, H. Bockhorn, M. Frenklach. Combustion and Flame. 121 (2000) 122-136.
[15] A.G. Yazicioglu, C.M. Megaridis, A. Campbell, K.-. Lee, M.Y. Choi. Combustion Science and Technology. 171 (2001) 71-87.
[16] U.O. , G.M. Faeth, T.L. Farias, M.G. Carvalho. Combustion and Flame. 100 (1995) 621-633.
[17] F. Barra, B. Davidovitch, A. Levermann, I. Procaccia. Physical Review Letters. 87 (2001) 134501/1-134501/4. [18] R.A. Dobbins, C.M. Megaridis. Langmuir. 3 (1987) 254-259.
[19] S.H. Park, S.N. Rogak. Aerosol Science and Technology. 37 (2003) 947-960.
[20] S.N. Rogak, R.C. Flagan. Journal of Colloid and Interface Science. 151 (1992) 203-224. [21] T. Ishiguro, N. Suzuki, Y. Fujitani, H. Morimoto. Combustion and Flame. 85 (1991) 1-6. [22] B.G. Wicke, K.A. Grady. Carbon. 25 (1987) 791-797.