Publisher’s version / Version de l'éditeur:
Applied Materials and Interfaces, 2, 2, pp. 375-384, 2010-01-12
READ THESE TERMS AND CONDITIONS CAREFULLY BEFORE USING THIS WEBSITE. https://nrc-publications.canada.ca/eng/copyright
Vous avez des questions? Nous pouvons vous aider. Pour communiquer directement avec un auteur, consultez la première page de la revue dans laquelle son article a été publié afin de trouver ses coordonnées. Si vous n’arrivez pas à les repérer, communiquez avec nous à PublicationsArchive-ArchivesPublications@nrc-cnrc.gc.ca.
Questions? Contact the NRC Publications Archive team at
PublicationsArchive-ArchivesPublications@nrc-cnrc.gc.ca. If you wish to email the authors directly, please see the first page of the publication for their contact information.
NRC Publications Archive
Archives des publications du CNRC
This publication could be one of several versions: author’s original, accepted manuscript or the publisher’s version. / La version de cette publication peut être l’une des suivantes : la version prépublication de l’auteur, la version acceptée du manuscrit ou la version de l’éditeur.
For the publisher’s version, please access the DOI link below./ Pour consulter la version de l’éditeur, utilisez le lien DOI ci-dessous.
https://doi.org/10.1021/am900600y
Access and use of this website and the material on it are subject to the Terms and Conditions set forth at
On the micro-, meso-, and macroporous structures of polymer
electrolyte membrane fuel cell catalyst layers
Soboleva, Tatyana; Zhao, Xinsheng; Malek, Kourosh; Xie, Zhong; Navessin,
Titichai; Holdcroft, Steven
https://publications-cnrc.canada.ca/fra/droits
L’accès à ce site Web et l’utilisation de son contenu sont assujettis aux conditions présentées dans le site LISEZ CES CONDITIONS ATTENTIVEMENT AVANT D’UTILISER CE SITE WEB.
NRC Publications Record / Notice d'Archives des publications de CNRC:
https://nrc-publications.canada.ca/eng/view/object/?id=8d7ec613-77f1-4527-a418-6fff8cc416a9 https://publications-cnrc.canada.ca/fra/voir/objet/?id=8d7ec613-77f1-4527-a418-6fff8cc416a9On the Micro-, Meso-, and Macroporous
Structures of Polymer Electrolyte Membrane
Fuel Cell Catalyst Layers
Tatyana Soboleva,
†,‡Xinsheng Zhao,
‡Kourosh Malek,
‡Zhong Xie,
‡Titichai Navessin,
‡and
Steven Holdcroft*
,†,‡Department of Chemistry, Simon Fraser University, 8888 University Drive, Burnaby, British Columbia, Canada V5A 1S6, and Institute for Fuel Cell Innovation, National Research Council of Canada, 4250 Wesbrook Mall, Vancouver, British Columbia, Canada V6T 1W5
ABSTRACT In this work, N2adsorption was employed to investigate the effects of carbon support, platinum, and ionomer loading
on the microstructure of polymer electrolyte membrane fuel cell catalyst layers (CLs). Brunauer-Emmett-Teller and t-plot analyses of adsorption isotherms and pore-size distributions were used to study the microstructure of carbon supports, platinum/carbon catalyst powders, and three-component platinum/carbon/ionomer CLs. Two types of carbon supports were chosen for the investigation: Ketjen Black and Vulcan XC-72. CLs with a range of Nafion ionomer loadings were studied in order to evaluate the effect of an ionomer on the CL microstructure. Regions of adsorption were differentiated into micropores associated with the carbon primary particles (<2 nm), mesopores ascribed to the void space inside agglomerates (2-20 nm), and meso- to macroporous space inside aggregates of agglomerates (>50 nm). Ketjen Black was found to possess a significant fraction of micropores, 25% of the total pore volume, in contrast to Vulcan XC-72, for which the corresponding fraction of micropores was 15% of the total pore volume. The microstructure of the carbon support was found to be a significant factor in the formation of the microstructure in the three-component CLs, serving as a rigid porous framework for distribution of platinum and the ionomer. It was found that platinum particle deposition on Ketjen Black occurs in, or at the mouth of, the support’s micropores, thus affecting its effective microporosity, whereas platinum deposition on Vulcan XC-72 did not significantly affect the support’s microstructure. The codeposition of ionomer in the CL strongly influenced its porosity, covering pores < 20 nm, which are ascribed to the pores within the primary carbon particles (pore sizes < 2 nm) and to the pores within agglomerates of the particles (pore sizes of 2-20 nm).
KEYWORDS: N2adsorption • microstructure • catalyst layer • Ketjen Black • Vulcan XC-72
INTRODUCTION
M
uch effort has gone into the development of new electrode materials for use in polymer electrolyte membrane fuel cells (PEMFCs). Current trends of research include investigation of the high surface area (SA), novel ordered nanoporous carbons (1), and carbon-nano-tube-based catalyst supports (2), as well as carbon-free catalyst supports (3, 4) and thin-film catalyst layers (CLs) (5, 6). Presently, traditional CLs employing platinum depos-ited on high-SA carbon black supports, with the addition of a proton-conducting phase, are most commonly used. The successful development of novel materials for CLs is hin-dered by the lack of a fundamental understanding of the complex, multicomponent nature of the CL, the interplay of its components, and their independent and cooperative effects on the effective properties, particularly in the context of preparing catalyst-coated membranes (CCMs).Carbon-supported catalysts have been widely used in a variety of industrial applications because of their high SA,
onto which fine dispersions of metal particles can be depos-ited. The supports are relatively stable to a range of condi-tions and allow for easy recycling of the metal. Three forms of carbon are commonly used as supports for precious metals: activated carbon, carbon black, and graphitized carbon. Carbon black supports, such as Ketjen Black and Vulcan XC-72, are current technologically standard catalyst supports for fuel cell applications. Carbon black supports are manufactured by pyrolysis of hydrocarbons such as natural gas or aromatic residues of petroleum processing (7, 8). The most common production process is the furnace black process, in which the starting material is burned in a limited supply of air at ∼1000 °C. Carbon black supports are known for their tendency to form chainlike aggregates. The higher is the degree of aromaticity of the feedstock, the higher the degree of aggregation. Carbon black supports with specific SAs ranging from 8 to 1500 m2/g can be produced (8).
Many models have been proposed for the structure of a single carbon black particle. These are based largely on electron microscopy studies. The majority of models depicts the carbon particle as a spherical arrangement of the quasi-graphitic microcrystalline domains, with their size and order becoming smaller and more disordered toward the center. X-ray diffraction studies reveal that carbon black supports possess large d spacings (3.5-3.6 Å) compared to graphitic * Corresponding author. Phone: +1 778 782 4221. Fax: +1 778 782 3765. E-mail:
holdcrof@sfu.ca.
Received for review September 3, 2009 and accepted December 17, 2009
†
Simon Fraser University.
‡
National Research Council of Canada. DOI: 10.1021/am900600y
© 2010 American Chemical Society
ARTICLE
www.acsami.org VOL. 2•NO. 2•375–384•2010 375
carbon (3.354 Å), which indicates that the quasi-graphitic layers are oriented parallel to each other but exhibit no turbostratic, long-range three-dimensional order, as in graph-ite (8-10). These microcrystalline domains are reported to be only a few layers thick and approximately 20-30 Å in width (8). Aggregation of the microcrystalline domains into primary particles and further into particle agglomerates results in complex, high-SA, porous systems.
Gas adsorption is the most frequently used technique for evaluation of the specific SA and pore size of porous materi-als. The Brunauer-Emmett-Teller (BET) method is often the method of choice for assessment of the specific SA:
where p represents the gas pressure, p0the saturation gas
pressure, n the amount of adsorbed gas, nmthe
monolayer-adsorbed gas amount, and c the BET constant (which takes into account the energy of adsorption) (11).
The method extends the Langmuir theory of monomo-lecular gas adsorption on a solid surface to multilayer adsorption, assuming the physical adsorption of gas mol-ecules in sequential layers. Despite its simplicity, the theory has been shown to provide an adequate representation of real systems, which are usually complex, and is consistent with experimental data for a variety of porous materials (12, 13). The Kelvin equation, which relates the pore size to gas partial pressure for capillary condensation or evapora-tion, has been used effectively to quantify the pore structure:
where p represents the gas pressure, p0 the saturation
pressure, γ the surface tension, VLthe molar volume of the
liquid, and rmthe capillary condensation radius and R and
T have their usual meanings. However, the Kelvin equation in its original form is a crude simplification of the actual process of capillary condensation (13); hence, numerous corrections and modifications have been developed. Intro-duction of the statistical film thickness (t thickness) that accounts for the formation of the liquidlike layer on the pore wall prior to commencement of capillary condensation was shown to more accurately represent experimental data. A universal dependence of the t thickness on the partial pressure of nitrogen was found for various adsorbate surface types (14, 15). de Boer et al. conducted an extensive study of the t-curve method for various porous materials (15-21) and determined the actual pore radius to be the sum of the radius calculated by the Kelvin equation and the thickness of the adsorbed t layer at each given partial pressure. An important refinement of the Kelvin equation using the t-thickness correction was performed by Barrett, Joyner, and Halenda (BJH) (22).
A significant contribution to understanding the nature of the CLs was made by Eikerling’s agglomerate model (23) and
by the experimental work of Uchida et al. (24, 25), which indicate the formation of carbon particle agglomerates exhibiting a bimodal pore-size distribution (PSD). These include 6-20-nm-sized pores within agglomerates of carbon particles and larger 20-100-nm-sized pores that exist be-tween aggregates of agglomerates. Within the fuel cell scientific community, these are often referred to as primary and secondary pores. Ionomer is believed to be distributed within the secondary pores, forming a complex three-dimensional network. However, there exists also a <2 nm pore structure in the primary carbon particle, the function of which in a fuel cell electrochemical reaction has not been clearly determined yet.
In this work, we employ N2adsorption to investigate the
microstructure of carbon supports, carbon-supported plati-num catalysts, and three-component platiplati-num/carbon/iono- platinum/carbon/iono-mer CLs. Two types of carbon supports are chosen for the investigation, Ketjen Black and Vulcan XC-72, and a range of perfluorosulfonate ionomer loadings are investigated to determine the effect of the ionomer on the resultant micro-structure of the CL. The micromicro-structure is described in terms of the PSD, pore volume, and SAs of the pores. The termi-nology used throughout this work for micro-, meso-, and macropores is that adopted by IUPAC (26, 27). Pores < 2 nm are termed micropores and ascribed to the pores within the carbon primary particles. Pores in the range of 2-50 nm are referred to as mesopores, and pores larger than 50 nm are termed macropores. Pores larger than 2 nm are assumed to be found within the complex agglomerate-aggregate organization of the primary particles.
EXPERIMENTAL SECTION
Materials. Ketjen Black and Vulcan XC-72 carbons were
received from Tanaka Kikinzoku Kogyo (TKK) and Cabot Corp., respectively. Catalyst powders with 46 wt % platinum on Ketjen Black and Vulcan XC-72 were received from TKK. Catalyst inks for spray deposition were prepared by mixing a catalyst pow-der, platinum/carbon (Pt/C), in a water and methanol mixture (1:1), corresponding to 0.70 g of Pt/C in 100 g of a water/ methanol solution. The dispersion was sonicated for 30 min during the dropwise addition of 0.74, 1.6, 6.0, and 14 g of a 5 wt % Nafion solution (Alfa Aesar) to the mixture to produce 5, 10, 30, and 50 wt % ionomer loadings, respectively. The final mixture was sonicated at room temperature for 2 h.
All CLs comprising of platinum, carbon, and ionomer were fabricated by spray deposition on a Nafion 211 membrane, which was used as received, producing CCMs with CL deposited on both sides. Spray deposition of the ink on a Nafion 211 membrane was performed at 80 °C. CLs with 5, 10, 30, and 50 wt % ionomer were prepared corresponding to 0.1, 0.2, 0.8, and 1.8 ionomer to carbon dry weight ratios (I/C ratios). Carbon and platinum loadings in all CLs were held constant at 0.475 and 0.4 mg/cm2, respectively. The thickness of the CLs was 12
( 2.0 µm.
Methods. N2physisorption experiments were performed at
77 K on a 3100 surface area analyzer (Beckman Coulter). N2
gas of ultrahigh purity, 99.999%, was used. Carbon and Pt/C samples of ∼100 mg were degassed at 160 °C for 12 h prior to the adsorption experiment. CCMs of 50 cm2were cut into thin
strips, placed in the sample tube, and degassed for 12 h at 105 °C. Adsorption experiments were performed immediately after degassing. A blank adsorption experiment on a Nafion 211 membrane was performed for the case of CCMs. It was found p/p0 n(1 - p/p0) ) 1 nmc + c - 1 nmc (p/p0) (1) ln p p0 ) -2γVL RT 1 rm (2)
ARTICLE
that Nafion 211 absorbed ∼3 cm3/g of N
2 at 0.98 (STP),
contributing negligibly to the total amount of gas adsorbed by the CCM. Adsorption isotherms of Pt/C powders and CCMs were all replotted after normalization to the carbon content in each sample. The BET SA was calculated from the BET equation by plotting the left-hand-side term of the equation against P/P0in
the range of 0.05-0.2 P/P0. The monolayer volume, nm, was
found from the slope, S, and intercept, I, of such a BET plot:
Surface area SABETwas calculated from eq 4:
where N is Avogadro’s number, s the cross-sectional area of the N2molecule (0.162 nm2), and V the molar volume of adsorbent
gas.
The total pore volume was found at a partial pressure of 0.98
P/P0 (STP) by conversion to the liquid N2 volume using the
conversion factor of 0.001 547, under the assumption that the density of condensed N2in the pores is equal to the density of
bulk liquid N2(28).
The PSDs were calculated using the BJH method. The method is based on the Kelvin equation and accounts for the formation of a condensed layer of gas molecules on the pore wall prior to capillary condensation using the Harkins-Jura equation:
where t is the thickness of the adsorbed layer on the pore wall (Å), p the partial pressure of N2, and p0the saturation pressure
of N2at 77 K (14).
RESULTS AND DISCUSSION
Carbon Powders.
Ideally, all pores larger than the molecular diameter of N2(3.5 Å) can be detected by the N2adsorption technique. The physical adsorption in micropores (26, 27), <2 nm, that is observable at very low gas partial pressures (<0.01 P/P0) is described by the theory of
mi-cropore filling (29-31). Adsorption in these pores occurs through volume filling, with the adsorption enthalpy strongly enhanced by the overlap of adsorption forces from the opposite walls of the pore; i.e., neither mono/multilayer adsorption nor capillary condensation takes place. Concur-rent with the filling of micropores, adsorption of a monolayer of N2occurs on the pore walls of meso- and macropores (>2
nm) and on the external surface of the particles. Although it is difficult to distinguish between these concurrent pro-cesses, the consensus is that the steeper is the rise in the adsorption isotherm at these very low partial pressures, the larger the total volume of micropores (13, 32).
As the partial pressure is increased, monolayer formation evolves into multilayer formation until the pore radius related to the capillary condensation at a given partial pressure is reached, instantly filling the pore. Thus, at medium and high partial pressures, two processes may
occur simultaneously: multilayer formation and capillary condensation. At a partial pressure close to unity, either all pores are filled with N2and the isotherm reaches a plateau
because the saturation point is reached or multilayer forma-tion continues in macropores and no saturaforma-tion point in the isotherm is observed. The latter situation is characteristic for aggregate-type systems that possess macropores between agglomerates.
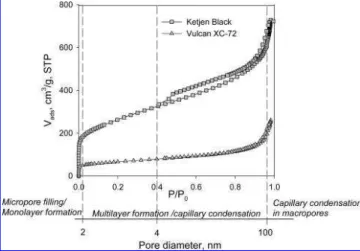
In Figure 1, sorption and desorption isotherms for Ketjen Black and Vulcan XC-72 carbon supports are shown. Both isotherms are type II according to IUPAC classification (26, 27). Type II isotherms are characteristic of systems containing micropores because they exhibit a strong interac-tion between adsorbate and adsorbent, which results in a steep rise in the isotherm under low partial pressures. At partial pressures close to unity, no saturation is observed, which provides evidence for the presence of macropores and which is interpreted as an indication of the presence of large aggregates of particles.
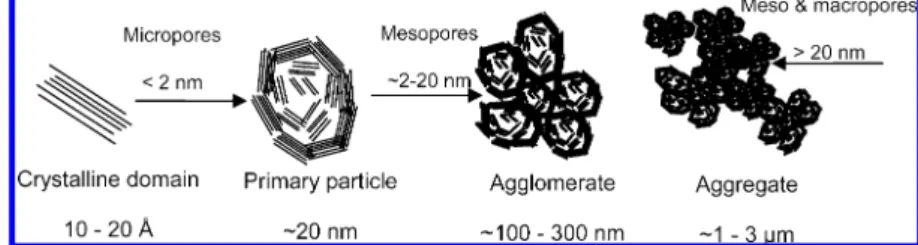
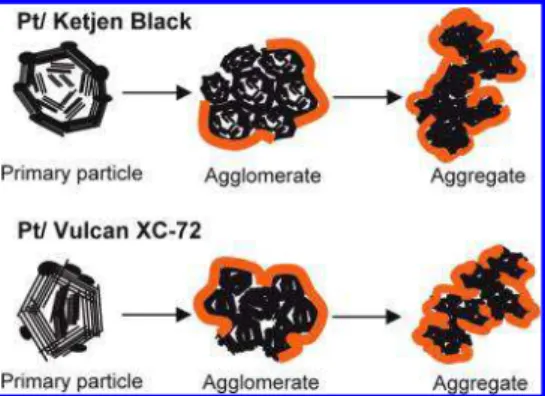
It is extremely difficult to unambiguously deconvolute the microstructure of carbon black supports and the arrange-ment of primary carbon particles into agglomerates and further deconvolute aggregates of agglomerates. However, it may be assumed that the micropore-filling process, i.e., the filling of <2 nm pores, occurs in the primary carbon particles, which themselves are ∼30 nm in diameter (8, 23). The micropores are thought to exist either between the turbostratic graphite planes of the crystallites or between the edges of two crystallites. The primary carbon particles arrange into 100-300 nm agglomerates. Within these ag-glomerates, mesopores of 2-20 nm diameter exist. Ag-glomerates coalesce into chainlike aggregates, and a con-tinuous network of pores, >20 nm, is formed in the interstices. Shown in Figure 2 is a depiction of carbon black particles, agglomerates of particles, and aggregates of ag-glomerates;thecorrespondingmicro-,meso-,andmacropores formed by these structures are indicated by arrows. In Figure 3, supporting transmission electron microscopy (TEM) im-ages of carbon powders are shown.
nm) 1 S + I (3) SABET) nmNs V (4) t )
(
13.99 0.034 - log(p/p0))
1/2 (Å) (5)FIGURE 1. N2adsorption isotherms for Ketjen Black (squares) and Vulcan XC-72 (triangles) carbon supports. The secondary x axis indicates the pore size and regions of the isotherm characterized by different adsorption mechanisms.
ARTICLE
It can be seen that carbon primary particles agglomerate into spherical-like agglomerates of ∼200 nm, which further aggregate into larger entities of several micrometers, creat-ing an extensive porous network. A similar character of particle aggregation is observed for Ketjen Black and Vulcan XC-72.
Both Ketjen Black and Vulcan XC-72 carbon supports show hysteresis in the adsorption isotherms, but it is more pronounced for Ketjen Black and extended to the wider range of partial pressures, reaching the limiting hysteresis partial pressure at 0.4 P/P0. The partial pressure of the
hysteresis closure is attributed to the tensile strength of the liquid adsorbate because it is assumed that N2condenses in
pores at 77 K and possesses bulk properties of liquid N2. For
N2, independent of the nature of the adsorbent, the partial
pressure of 0.4 is found to be the critical pressure (13). Both hysteresis curves are H3 type according to the IUPAC classification, which is characteristic of aggregates of plate-like particles giving a rise to slit-shaped pores and is common for carbonaceous materials (26, 27). The pronounced hys-teresis in the case of Ketjen Black carbon implies the presence of a more extensively developed pore network wherein the fraction of larger pores trapped within the network of smaller pores is much higher (33-36). This is consistent with the fact that Ketjen Black possesses a large fraction of micropores and a broad PSD, as will be illustrated later. The calculated BET SAs for both carbon supports were found to be 890 ( 64.3 m2/g for Ketjen Black and 228 (
3.57 m2/g for Vulcan XC-72, estimated in the range of partial
pressures 0.05-0.2 P/P0. The total pore volumes, calculated
at a partial pressure of 0.98 P/P0, are 1.02 ( 0.15 and 0.40
( 0.02 cm3/g, respectively.
The PSDs of both types of carbon are estimated from the adsorption branch of the isotherms to avoid the
incorpora-tion of pore network effects in the PSD (13) and are shown in Figure 4. PSD curves are very similar in shape with the PSD maxima at ∼55 nm. However, they differ significantly in their total pore volumes, especially in the micropore-to-mesopore region (2-20 nm), where Ketjen Black carbon adsorbs a notably larger amount of N2.
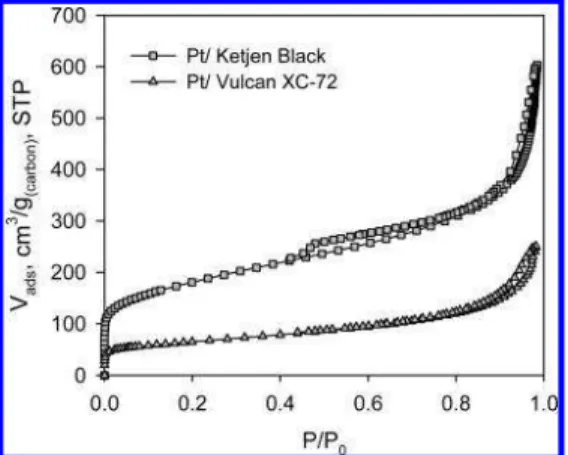
The same trend in the shape of the isotherm and the amount of N2adsorbed is seen in Pt/C powders (Figure 5).
Pt/Vulcan XC-72 powder, exhibiting a BET SA of 228.7 ( 0.657 m2/g, possesses only ∼1/
3the sorption capacity of Pt/
Ketjen Black powder, which has a BET SA of 639.2 ( 26.16 m2/g.
In both cases, hysteresis loops are identical with those of the native carbon powders, i.e., observed in the range of 0.4-1.0 P/P0in the case of the Ketjen Black support and only
at pressures above 0.8 for the Vulcan XC-72 support. The Harkins-Jura (eq 5) was used to determine the t-thickness values over the entire range of partial pressures
FIGURE 2. Schematic representation of the microstructures of carbon black supports: turbostratic crystalline domain, primary carbon particle, agglomerate, and aggregate of agglomerates. Representative micro-, meso-, and macropores are indicated by arrows.
FIGURE 3. TEM micrographs of (a) Ketjen Black and (b) Vulcan XC-72 carbon aggregates.
FIGURE 4. PSD curves for Ketjen Black (squares) and Vulcan XC-72 (triangles).
and subsequently used to determine the microporosity of the carbon supports by replotting of the adsorption iso-therms as a t plot, i.e., a plot of the quantity of adsorbed N2
against t (13, 15-18, 37) (Figure 6).
Two linear regions with differing slopes can be distin-guished in the t plots of the Ketjen Black support and Pt/ Ketjen Black catalyst powder. The first region of steeper gradient is observed between 3.5 and 5 Å; the second linear region extends from 5 to ∼10 Å. This observation suggests that there are two different adsorption phenomena within the pores: one corresponding to dimensions of one or two molecular diameters,and the other associated with pores larger than two molecular diameters but smaller than the diameter required for capillary condensation, which is ∼20 Å. This can be explained in the context of micropore filling and the increased adsorption strength exerted by the pore surface on the gas molecule. A single gas molecule in a pore of similar diameter would experience enhanced adsorption forces from both walls of the pore. In sharp contrast, only one linear region with constant slope can be distinguished for t plots corresponding to Vulcan XC-72 and its Pt-deposited analogue. The intercept of the linear region with the y axis allows the volume of the micropores to be estimated. The results are shown in Table 1.
From the table, it is seen that pores of size <2 nm constitute ∼25% of the total pore volume in Ketjen Black carbon, whereas in the case of Vulcan XC-72, they constitute only ∼15%. From the BET SA and t-plot analysis, it appears that the deposition of platinum significantly decreases the total detectable SA of the Ketjen Black carbon support: from 890 m2/g for Ketjen Black to 639 m2/g for Pt/Ketjen Black.
The volume of the micropores (<2 nm) after platinum deposition decreases by 30% in the case of the Ketjen Black support. Total SAs and pore volumes of Vulcan carbon and Pt/Vulcan XC-72 are similar, indicating that the deposition of platinum does not affect these microstructural properties: 228 m2/g for Vulcan XC-72 and 229 m2/g for Pt/Vulcan
XC-72; 0.40 ( 0.02 cm3/g for Vulcan XC-72 and 0.06 ( 0.002
cm3/g for Pt/Vulcan XC-72. The volume of the micropores
in the Vulcan XC-72 support does not seem to decrease after platinum deposition (Figure 7).
The changes in the micropore filling volume after deposi-tion of platinum onto the carbon supports were examined by plotting the sorption isotherms in the logarithmic scale so that the low-pressure region is accentuated, as shown in Figure 8. Ketjen Black carbon support adsorbs ∼59 cm3/g
(STP) at a partial pressure of 10-4. However, for Pt/Ketjen
Black, the amount adsorbed at this pressure decreased by 25% to 45 cm3/g (STP) after normalization to the carbon
content. In the case of Vulcan XC-72, the volume associated with micropore filling is only 11 cm3/g (STP) at a partial
pressure of 10-4, i.e., significantly lower than that of Ketjen
Black carbon. Furthermore, after normalization to the car-bon content, isotherms of Pt/Vulcan 72 and Vulcan XC-72 carbon coincide, indicating no change in the micropore volume upon platinum deposition on the Vulcan support.
These results are interpreted as blocking, or filling, the micropores of the Ketjen Black support upon deposition of platinum particles. It is speculated that particles block the entrance of these micropores (<2 nm) because the sizes of the platinum particles range between 2 and 4 nm (38). Platinum deposition in the vicinity of the micropores can be explained by the reactivity of the edge sites of crystallites that exist at the entrances to the micropores that extend to the inside of particles (refer to Figure 2). In the case of Vulcan XC-72 carbon, where the fraction of micropores is less significant, this phenomenon is not observed.
Three-Component CCMs.
Isotherms of CLs were examined in the form of CCMs. Sorption isotherms of CCMs and the associated hysteresis are similar in shape to the corresponding Pt/C powder isotherms but differ significantly in the amount of gas adsorbed, as shown in Figure 9a,b.Virtually all of the N2is adsorbed by the CL of the CCM
because the contribution from Nafion 211 is negligible (see the Experimental Section). According to IUPAC classification, isotherms for the CCMs exhibit typical type II behavior, with rapid uptake in the macropore region that can be interpreted as evidence for the presence of large aggregates of particle agglomerates in the CL. As the ionomer loading in the CL is increased, the amount of adsorbed N2decreases, shifting
isotherms downward. This indicates a loss of the total pore
FIGURE 5. N2adsorption isotherms for Pt/Ketjen Black (squares) and Pt/Vulcan XC-72 (triangles) catalyst powders.
FIGURE 6. t plots for Ketjen Black and Vulcan XC-72 carbon supports and corresponding Pt/C-supported catalyst powders: Ketjen Black (circles), Pt/Ketjen Black (triangles), Vulcan XC-72 (diamonds), and Pt/Vulcan XC-72 (triangles). Linear regions are used for t-plot analysis.
ARTICLE
volume in the CL with increasing ionomer content. Hyster-eses show type H3 characteristics, consistent with that of carbon supports. In the case of Ketjen Black based CLs, hysteresis is strongly pronounced over the entire range of partial pressures down to 0.4 P/P0, as it is in the native
catalyst powder. In the case of Vulcan XC-72 based CLs, a hysteresis similar to that of the Pt/Vulcan XC-72 powder is seen in the CCM with 5 wt % ionomer. On the basis of the shapes of hystereses and PSD curves, it is speculated that the addition of ionomer to the Pt/C systems does not affect their inherent agglomeration/aggregation characteristics; ionomer distributes on the preformed porous carbon frame-work, covering and filling the pores. Moreover, no influence of the CL fabrication conditions on the microstructural characteristics of carbon supports was detected (not shown here). The total BET SA of CLs, total pore volume, volume, and SAs of micro- and mesopores are estimated as described in the Experimental Section. t plots and PSD curves for
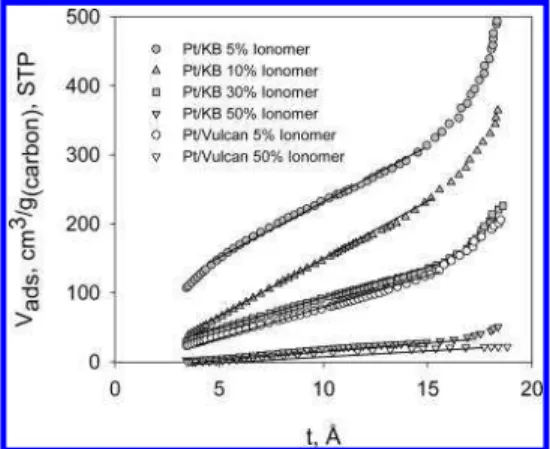
Ketjen Black based CLs containing 5, 10, 30, and 50 wt % ionomer and Vulcan XC-72 based CLs containing 5 and 50 wt % ionomer are shown in Figures 10 and 11, and the results are summarized in Table 2 and Figure 12.
The volume of the micropores was calculated using the intercept of the t plot with the ordinate; however, in the case of 30 and 50 wt % Pt/Ketjen/ionomer and 5 and 50 wt % Pt/Vulcan/ionomer samples, the intercepts are negative, indicating the absence of detectable micropores. For the Pt/ Ketjen Black case, the values of SA of the mesopores (>2 nm diameter) at 30 and 50 wt % calculated from the t plot approach values found for the total BET SAs estimated from the BET plots. In the case of Pt/Vulcan XC-72 at 5 and 50 wt
Table 1. Microstructural Characteristics of Carbon Supports and Pt/C Catalyst Powders Determined from N2
Adsorption Isothermsa
carbon support BET SAtotal, m2/gcarbon SA>2 nm, m2/gcarbon SA<2 nm, m2/gcarbon Vpore,total, cm3/gcarbon Vpore,<2 nm, cm3/gcarbon Ketjen Black 890.6 ( 64.26 409.1 ( 19.46 481.5 ( 61.24 1.02 ( 0.15 0.25 ( 0.03 Pt/Ketjen Black 639.2 ( 26.16 294.1 ( 19.60 345.2 ( 17.32 0.86 ( 0.06 0.18 ( 0.02 Vulcan XC-72 227.7 ( 3.570 114.7 ( 1.930 113.0 ( 3.000 0.40 ( 0.02 0.06 ( 0.002 Pt/Vulcan XC-72 228.7 ( 0.657 132.5 ( 13.15 96.19 ( 13.13 0.39 ( 0.003 0.05 ( 0.01
aThe BET SA was determined in the range of 0.05-0.2 N
2partial pressure; the volume of micropores was determined from the intercept of the t plot, the total pore volume from the total adsorbed gas amount at 0.98 partial pressure, SA of mesopores from the slope of the t plot, and SA of the micropores as the difference between the total SA and the mesopore SA.
FIGURE 7. Total pore and micropore volumes of carbon and Pt/C powders.
FIGURE 8. N2adsorption isotherms for Ketjen Black carbon support, Pt/Ketjen Black catalyst powder, Vulcan XC-72 carbon support, and Pt/Vulcan XC-72 catalyst powder.
FIGURE 9. (a) N2adsorption isotherms of Ketjen Black supported CLs with 5, 10, 30, and 50 wt % ionomer. Isotherms for Ketjen Black and Pt/Ketjen Black are shown for reference. (b) N2 adsorption isotherms for Vulcan XC-72 supported CLs containing 5 and 50 wt % ionomer. Vulcan XC-72 and Pt/Vulcan XC-72 isotherms are shown for reference.
% ionomer contents, the total BET SAs are equal to the SAs of mesopores estimated from the t plots.
With the addition of 10 wt % ionomer in the Pt/Ketjen Black CL, the volume of the micropores decreases from an initial 0.18 cm3/g for the catalyst powder to 0.02 cm3/g for
the CL. In the case of Pt/Vulcan XC-72 CL, the small initial volume of the micropores in the catalyst powder, 0.05 cm3/
g, was found to disappear after the addition of just 5 wt % of ionomer, as shown in Table 2. The clear trend in the loss
of micro/mesopore volume in Pt/Ketjen Black based CLs with increasing ionomer content is seen in the PSD curves shown in Figure 11a. The mesopore volume (2-20 nm), which corresponds to the pore volume within agglomerates, as-ymptotically decreases with the addition of ionomer, whereas in the macropore region, i.e., pores > 50 nm, a drastic decrease in the pore volume is observed only after the addition of 50 wt % ionomer because macropores become filled with ionomer. In the case of Pt/Vulcan XC-72 based CLs, the addition of 50 wt % ionomer causes a complete loss of porosity over the entire PSD range. These findings are in contrast with the observations of Uchida et al.’s group, who report that the primary pore volume within agglomerates remainsunchangedwithincreasingionomercontent,whereas the volume of secondary pores (meso- and macropores) decreases (24, 25).
Summarized structural data of Ketjen Black and Vulcan XC-72 carbon supports and Pt/C and Pt/C/ionomer systems are depicted in Figure 12.
On the basis of these findings, it is postulated that at very low ionomer content (5-10 wt %) ionomer exists in the meso/macroporous void space formed between agglomer-ates of carbon particles, presumably being distributed on the surface of agglomerates. N2, being poorly soluble in the
ionomer, cannot penetrate the ionomeric layer and thereby is restricted from entering both the micropores within primary carbon particles and the mesopores formed in the interior of agglomerates of primary particles. As the ionomer content is increased, it covers more and more of the ag-glomerate surface, resulting in the continuous loss of the detectable micro- and mesopores. At ultrahigh loadings, the ionomer completely fills meso- and macroporous voids, resulting in nearly a complete loss of detectable porosity, as illustrated in Figure 13.
CONCLUSIONS
N2adsorption was employed to study the microstructure
of CLs in PEMFCs and to explain the CL microstructure on the basis of carbon black supports, Pt/C-supported catalysts, and the formation of CLs. Carbon black particles, consisting of turbostratic graphitic structures, coalesce to form ag-glomerates and aggregates in the powder form. The char-acter of carbon particle aggregation in powder form is preserved in CLs, as evidenced by the similar shapes of isotherms, hystereses, and PSD curves. Two commonly used carbon supports, Ketjen Black and Vulcan XC-72, showed significant differences in the total available SA, pore volume, and fraction of micropores. Ketjen Black possessed signifi-cantly higher SA, because of its higher proportion of mi-cropores, <2 nm, and consequently much larger pore vol-ume, compared to Vulcan XC-72.
The detectable micropore volume within Ketjen Black is significantly reduced upon deposition of platinum particles. This raises the question as to whether platinum is deposited at the necks of pores or inside them. Edge sites of microc-rystalline carbon domains are known to be highly reactive, because of the unsaturated electron density, compared to basal plane carbon (8, 39, 40). Higher SA microporous
FIGURE 10. t plots for Ketjen Black supported CLs containing 5, 10, 30, and 50 wt % ionomer and of Vulcan XC-72 supported CLs containing 5 and 50 wt % ionomer. Linear regions were used to determine the micropore volume and mesopore SA.
FIGURE 11. (a) PSD curves for Ketjen Black supported CLs showing the effect of CL ionomer loading on the pore volume and PSD of the CLs. The PSDs of a Ketjen Black support and Pt/Ketjen Black are shown for reference. (b) PSD curves for Vulcan XC-72 supported CLs showing the effect of CL ionomer loading on the pore volume and PSD of the CLs. The PSDs of a Vulcan XC-72 support and Pt/Vulcan XC-72 are shown for reference.
ARTICLE
carbon supports, such as Ketjen Black, are reported to possess a larger number of edge sites; i.e., they are less graphitized and thus more microporous. Thus, platinum deposition may be initiated on the edge sites at the necks of the micropores because deposition inside the pores is unlikely as the platinum particle sizes are 2-4 nm. This phenomenon was not observed in the case of Vulcan XC-72 because of its significantly lower fraction of micropores. By extrapolation, it is predicted that changes in the microstruc-tural characteristics of lower SA carbon supports, i.e., graphi-tized carbon, would not be significantly influenced by deposition of catalyst particles because of their low mi-cropore volume, whereas the reverse is true for higher SA carbon supports.
CLs prepared with various ionomer contents retained the key features of the sorption isotherms of the native carbon powder. Ketjen Black based CLs exhibited hysteresis over a wide range of partial pressures, from unity to 0.4 P/P0,
indicating a complex pore network within the CL. In con-trast, Vulcan XC-72 based CLs showed hysteresis only between partial pressures of unity to ∼0.8 P/P0, which is
attributed to condensation-evaporation hysteresis rather than to a pore-network-induced hysteresis (13).
CLs based on Ketjen Black were found to generally possess higher detectable pore volumes than those based on Vulcan XC-72 at identical ionomer loadings, especially in the pore size range <20 nm. It is speculated that ionomer distributes on the surface of agglomerates, covering the
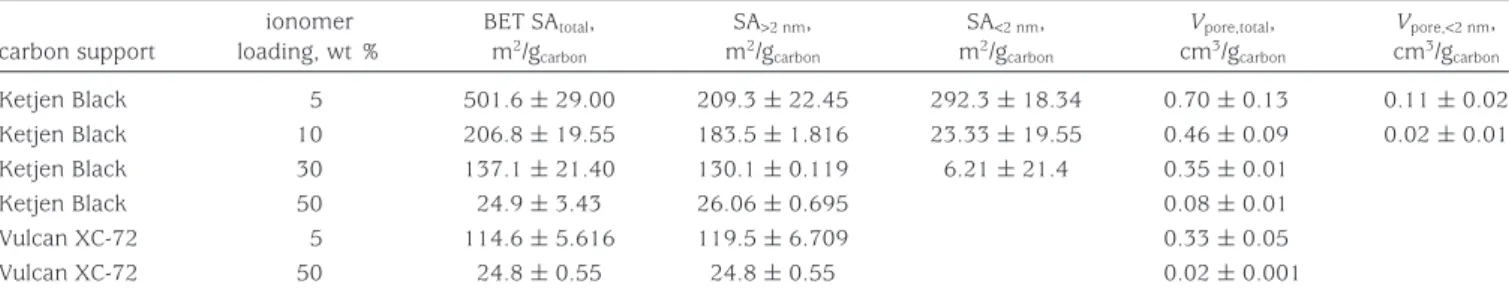
Table 2. Microstructural Characteristics of CLsa,b
carbon support ionomer loading, wt % BET SAtotal, m2/g carbon SA>2 nm, m2/g carbon SA<2 nm, m2/g carbon Vpore,total, cm3/g carbon Vpore,<2 nm, cm3/g carbon Ketjen Black 5 501.6 ( 29.00 209.3 ( 22.45 292.3 ( 18.34 0.70 ( 0.13 0.11 ( 0.02 Ketjen Black 10 206.8 ( 19.55 183.5 ( 1.816 23.33 ( 19.55 0.46 ( 0.09 0.02 ( 0.01 Ketjen Black 30 137.1 ( 21.40 130.1 ( 0.119 6.21 ( 21.4 0.35 ( 0.01 Ketjen Black 50 24.9 ( 3.43 26.06 ( 0.695 0.08 ( 0.01 Vulcan XC-72 5 114.6 ( 5.616 119.5 ( 6.709 0.33 ( 0.05 Vulcan XC-72 50 24.8 ( 0.55 24.8 ( 0.55 0.02 ( 0.001
aThe platinum loading is 0.4 mg/cm2in all CLs.bThe BET SA was determined in the range of 0.05-0.2 N
2partial pressure, the total pore volume from the total adsorbed gas amount at 0.98 N2partial pressure, the volume of the micropores from the intercept of the t plot, the SA of the mesopores from the slope of the t plot, and the SA of the micropores as the difference between the total SA and mesoporous SA.
FIGURE 12. (a) SAs of Ketjen Black, Pt/Ketjen Black, and the corresponding CLs showing the effect of platinum and ionomer loading on the detectable SA of the examined systems. (b) SAs of Vulcan XC-72, Pt/Vulcan XC-72, and corresponding CLs showing the effect of platinum and ionomer loading on the detectable SA of the examined systems. (c) Total pore volume (plain bars) and micropore volume (checked bars) of Ketjen Black (black bars) and Vulcan XC-72 (gray bars) carbon supports, Pt/C, and the corresponding CLs.
intra-agglomerate pores (<20 nm), and this occurs with quite low ionomer loadings, e.g., as low as 5 wt % ionomer. These findings are in agreement with agglomeration models pro-posed by Eikerling et al. (23). For the purpose of fuel cell CLs, it is essential that ionomer contents are maintained as low as possible to sustain the appropriate void fraction for gaseous mass transport to occur, while still being sufficient for creating an ionomer network for proton conduction. Indeed, significant blocking of the pore space by ionomer is observed with higher ionomer loadings and to a consider-ably larger degree in the case of Vulcan XC-72 based CLs. This leads to an assumption that the widely accepted optimum value of 30 wt % ionomer content in the CL cannot be truly optimal for both of these carbon supports because gas and water transport is expected to be hindered to a greater degree in Vulcan XC-72 based CLs because of the lower pore volume. Thus, it is suggested that optimum ionomer loading has to be adjusted for each catalyst support depending on its SA and pore volume, in particular, the ratio of micropores to meso- and macropores, because it has been found that only the SA of pores >20 nm is available for ionomer distribution. Moreover, the lower the fraction of SA available for ionomer distribution, the thicker the ionomer layer created. The thickness of the ionomer has a direct impact on gas and water transport in the CL.
The significance of incorporating high microporosity, i.e., high-SA supports, has to be further investigated because it was found that a significant fraction of platinum particles are deposited at the necks of the micropores, thus appar-ently nullifying the effectiveness of this microporous space. On the basis of this finding, it is speculated that micropores (<2 nm) merely serve as active sites for platinum deposition without contributing to enhanced fuel cell performance.
The presence of an extensive porous network within Ketjen Black based CLs is indicated by adsorption hysteresis and PSD curves. Pore-network effects are known to arise in porous materials with broad PSDs, where larger pores are trapped between smaller pores. A higher fraction of mi-cropores to mesopores, i.e., a broader PSD, creates a condi-tion for pore trapping in Ketjen Black based CLs, which is absent in Vulcan XC-72 based CLs. This, in turn, has a direct implication on the water retention properties of these CLs.
It is suggested that Ketjen Black based CLs possess a better water-retaining capability and hence are suspected to per-form better at lower relative humidities than Vulcan XC-72 based CLs. On the other hand, because of these pore-trapping effects, Ketjen Black based CLs are expected to suffer greater gas-transport limitations if operated at high relative humidities. On the basis of these considerations, it is suggested that, for anode CLs, catalyst supports with broader PSDs and more pronounced pore-trapping effects are advantageous, whereas for cathode CLs, materials with rather narrow PSDs, which would facilitate water removal from the layer, are desirable.
As is shown above, a better understanding of the micro-structure of the CL is valuable for clarification of the existing controversy about the composition and size of Pt/C ag-glomerates, structure, and distribution of the ionomer in the CL; currently, these properties are estimated by modeling methods without substantiating experimental validation. These microstructural properties, in turn, directly dictate the mass-transport properties, such as sorption and retention of water, the wetting properties of the CL, gas transport to the reaction active sites, and proton transport within the ionomer network.
A more detailed understanding of how a microstructure within the CL is formed, depending on the nature of the components, in particular, the carbon support, is valuable for the design of more effective catalyst supports.
Work is ongoing toward an understanding of the porous networks within CLs as well as toward correlation of the microstructures presented here to the water sorption and retention properties, gas transport, electrochemical proper-ties, and overall electrochemical performance of these CLs in a fuel cell.
Acknowledgment. The authors thank NRC-IFCI, NSERC,
and SFU for financial support, TKK for providing carbon and catalyst materials, Prof. Michael Eikerling for helpful discus-sions, and Dr. Ken Shi and Dave Edwards for assistance in TEM analysis.
REFERENCES AND NOTES
(1) Joo, S. H.; Choi, S. J.; Oh, I.; Kwak, J.; Liu, Z.; Terasaki, O.; Ryoo, R. Nature2001, 412, 169.
(2) Gong, K. P.; Du, F.; Xia, Z. H.; Durstock, M.; Dai, L. M. Science
2009, 323, 760.
(3) Bonakdarpour, A.; Fleischauer, M. D.; Brett, M. J.; Dahn, J. R. Appl. Catal., A2008, 349, 110.
(4) Debe, M. K. Handb. Fuel Cells2003, 3.
(5) Caillard, A.; Coutanceau, C.; Brault, P.; Mathias, J.; Leger, J. M. J. Power Sources2006, 162, 66.
(6) Wan, C. H.; Lin, M. T.; Zhuang, Q. H.; Lin, C. H. Surf. Coat. Technol.
2006, 201, 214.
(7) Auer, E.; Freund, A.; Pietsch, J.; Tacke, T. Appl. Catal., A1998,
173, 259.
(8) Kinoshita, K. Carbon: Electrochemical and Physicochemical Proper-ties; Wiley: New York, 1988.
(9) Mattson, J. S. Activated Carbon: Surface Chemistry and Adsorption from Solution; Marcel Dekker: New York, 1971.
(10) Bansal, R. C.; Goyal, M. Activated Carbon Adsorption; CRC Press: New York, 2005.
(11) Brunauer, S.; Emmett, P. H.; Teller, E. J. Am. Chem. Soc.1938,
60, 309.
(12) Thomas, J. M. Introduction to the Principles of Heterogeneous Catalysis; Academic Press: New York, 1967.
FIGURE 13. Schematic representation of platinum on the primary carbon particles of Ketjen Black and Vulcan XC-72 and the proposed distribution of ionomer on the surface of agglomerates. Micropores are blocked, and meso- and macropores exist within aggregates of agglomerates.
ARTICLE
(13) Gregg, S. J.; Sing, K. S. W. Adsorption, Surface Area and Porosity; Acedemic Press: New York, 1982.
(14) Sˇolcova´, O.; Matı`jova´, L.; Schneider, P. Appl. Catal., A2006, 313,
167.
(15) de Boer, J. H.; Lippens, B. C.; Linsen, B. G.; Broekhof, J.; Van-denhe, A.; Osinga, T. J. Colloid Interface Sci.1966, 21, 405.
(16) de Boer, J. H.; Linsen, B. G.; Osinga, T. J. J. Catal.1965, 4, 643.
(17) de Boer, J. H.; Linsen, B. G.; Vanderpl, T.; Zonderva, G. J. Catal.
1965, 4, 649.
(18) de Boer, J. H.; Lippens, B. C. J. Catal.1964, 3, 38.
(19) Lippens, B. C.; de Boer, J. H. J. Catal.1964, 3, 44.
(20) Lippens, B. C.; de Boer, J. H. J. Catal.1965, 4, 319.
(21) Lippens, B. C.; Linsen, B. G.; de Boer, J. H. J. Catal.1964, 3, 32.
(22) Barrett, E. P.; Joyner, L. G.; Halenda, P. P. J. Am. Chem. Soc.1951,
73, 373.
(23) Eikerling, M. J. Electrochem. Soc.2006, 153, E58.
(24) Uchida, M.; Aoyama, Y.; Eda, N.; Ohta, A. J. Electrochem. Soc.
1995, 142, 4143.
(25) Uchida, M.; Fukuoka, Y.; Sugawara, Y.; Eda, N.; Ohta, A. J. Electrochem. Soc.1996, 143, 2245.
(26) Sing, K. S. W.; Everett, D. H.; Haul, R. A. W.; Moscou, L.; Pierotti, R. A.; Rouque´rol, J.; Siemieniewska, T. Pure Appl. Chem.1985,
57, 603 (Reporting Physisorption Data for Gas/Solid Systems, IUPAC report).
(27) Rouque´rol, J.; Avnir, D.; Fairbridge, C. W.; Everett, D. H.; Haynes, J. H.; Pernicone, N.; Ramsay, J. D. F.; Sing, K. S. W.; Unger, K. K. Pure Appl. Chem. 1994, 8, 1739 (Recommendations for the
Characterization of Porous Solids, IUPAC report). (28) Kruk, M.; Jaroniec, M. Chem. Mater.2001, 13, 3169.
(29) Dubinin, M. M. Carbon1987, 25, 593.
(30) Choma, J.; Jaroniec, M.; Piotrowska, J. Carbon1988, 26, 1.
(31) Seaton, N. A.; Walton, J.; Quirke, N. Carbon1989, 27, 853.
(32) Kruk, M.; Jaroniec, M.; Bereznitski, Y. J. Colloid Interface Sci.1996,
182, 282.
(33) Seaton, N. A. Chem. Eng. Sci.1991, 46, 1895.
(34) Liu, H. L.; Seaton, N. A. Chem. Eng. Sci.1994, 49, 1869.
(35) Liu, H. L.; Zhang, L.; Seaton, N. A. Chem. Eng. Sci.1992, 47, 4393.
(36) Murray, K. L.; Seaton, N. A.; Day, M. A. Langmuir1999, 15, 8155.
(37) Kruk, M.; Jaroniec, M.; Sayari, A. Langmuir1997, 13, 6267.
(38) Malek, K.; Eikerling, M.; Wang, Q. P.; Navessin, T. C.; Liu, Z. S. J. Phys. Chem. C2007, 111, 13627.
(39) Chu, X.; Kinoshita, K. Mater. Sci. Eng. B1997, 49, 53.
(40) Conway, B. E. Electrochemical Supercapacitors: Scientific Funda-mentals and Technological Applications; Kluwer Academic/Plenum Publishers: New York, 1999.
AM900600Y